Rusk, TX (Texas) Houses and Residents
| Rusk: | $108,887 |
| Texas: | $275,400 |
Mean price in 2022:
Detached houses: $179,104
Here: $179,104 State: $369,058 Mobile homes: $104,943
Here: $104,943 State: $124,413
Total population: 5,579 (Urban population: 4,646 (all inside urban clusters), Rural population: 644 (all nonfarm))
Houses: 1,196 (1,037 occupied: 701 owner occupied, 350 renter occupied)
| % of renters here: | 33% |
| State: | 38% |
Housing density: 175 houses/condos per square mile
Median price asked for vacant for-sale houses and condos in 2022 in this county: $220,866.
Median contract rent in 2022: $584 (lower quartile is $422, upper quartile is $943)
Median rent asked for vacant for-rent units in 2022: $711
Median gross rent in Rusk, TX in 2022: $975
Housing units in Rusk with a mortgage: 352 (4 second mortgage, 0 home equity loan, 5 both second mortgage and home equity loan)
Houses without a mortgage: 0
Median household income for houses/condos with a mortgage: $80,077
Median household income for apartments without a mortgage: $55,599
Median monthly housing costs: $911
Compare current foreclosures near Rusk, TX:
| Photo | Address | Area | Beds / Baths | Price | Details |
|---|---|---|---|---|---|

|
#1
Thompson St
Rusk, TX 75785
|
- sq. feet
|
- baths - beds |
show details | |

|
#2
County Road 1219
Rusk, TX 75785
|
- sq. feet
|
- baths - beds |
show details | |

|
#3
County Road 2408
Rusk, TX 75785
|
- sq. feet
|
- baths - beds |
show details | |

|
#4
County Road 2217
Rusk, TX 75785
|
- sq. feet
|
- baths - beds |
show details | |

|
#5
County Road 2124
Rusk, TX 75785
|
- sq. feet
|
- baths - beds |
show details | |

|
#6
Alvin St
Rusk, TX 75785
|
960 sq. feet
|
- baths - beds |
show details | |

|
#7
Tower Dr
Rusk, TX 75785
|
1,196 sq. feet
|
- baths - beds |
show details | |

|
#8
County Road 1605
Rusk, TX 75785
|
- sq. feet
|
- baths - beds |
show details | |

|
#9
County Road 4401
Jacksonville, TX 75766
|
1,536 sq. feet
|
2 baths 3 beds |
show details | |

|
#10
County Road 4220
Jacksonville, TX 75766
|
- sq. feet
|
2 baths 4 beds |
show details |
| Photo | Address | Area | Beds / Baths | Price | Details |
|---|---|---|---|---|---|

|
#11
Ridgecrest Dr
Jacksonville, TX 75766
|
2,940 sq. feet
|
- baths - beds |
show details | |

|
#12
Bainbridge St
Jacksonville, TX 75766
|
1,300 sq. feet
|
- baths - beds |
show details | |

|
#13
Myrtle Dr
Jacksonville, TX 75766
|
2,440 sq. feet
|
- baths - beds |
show details | |

|
#14
State Highway 135 N # 28
Jacksonville, TX 75766
|
- sq. feet
|
- baths - beds |
show details | |

|
#15
Monroe St
Jacksonville, TX 75766
|
1,110 sq. feet
|
- baths - beds |
show details | |

|
#16
Johnson St
Jacksonville, TX 75766
|
1,199 sq. feet
|
- baths - beds |
show details | |

|
#17
County Road 4248 W
Reklaw, TX 75784
|
- sq. feet
|
- baths - beds |
show details | |

|
#18
County Road 4216
Jacksonville, TX 75766
|
1,456 sq. feet
|
- baths - beds |
show details | |

|
#19
Japonica Ln
Jacksonville, TX 75766
|
- sq. feet
|
- baths - beds |
show details | |

|
#20
Fm 747 S
Jacksonville, TX 75766
|
- sq. feet
|
- baths - beds |
show details |
| Photo | Address | Area | Beds / Baths | Price | Details |
|---|---|---|---|---|---|

|
#21
Tyler St
Jacksonville, TX 75766
|
1,180 sq. feet
|
- baths - beds |
show details | |

|
#22
Us Highway 79 E
Jacksonville, TX 75766
|
1,080 sq. feet
|
- baths - beds |
show details | |

|
#23
Alameda Dr
Jacksonville, TX 75766
|
1,976 sq. feet
|
- baths - beds |
show details | |

|
#24
Edgewood Dr
Jacksonville, TX 75766
|
1,989 sq. feet
|
- baths - beds |
show details | |

|
#25
Tremont Cir
Jacksonville, TX 75766
|
1,600 sq. feet
|
- baths - beds |
show details | |

|
#26
County Road 4209
Jacksonville, TX 75766
|
- sq. feet
|
- baths - beds |
show details | |

|
#27
Fairway
Jacksonville, TX 75766
|
1,795 sq. feet
|
- baths - beds |
show details | |

|
#28
Howard St
Jacksonville, TX 75766
|
1,628 sq. feet
|
- baths - beds |
show details | |

|
#29
E Loop 456, Apt 302
Jacksonville, TX 75766
|
- sq. feet
|
- baths - beds |
show details | |

|
#30
County Road 3104
Jacksonville, TX 75766
|
- sq. feet
|
- baths - beds |
show details |
| Photo | Address | Area | Beds / Baths | Price | Details |
|---|---|---|---|---|---|

|
#31
Fm 2138 N
Jacksonville, TX 75766
|
- sq. feet
|
- baths - beds |
show details | |

|
#32
County Road 4224
Troup, TX 75789
|
- sq. feet
|
- baths - beds |
show details | |

|
Check over 1 million property listings on Foreclosure.com!
|
browse all offers | |||

Latest news about housing in Rusk, TX collected exclusively by city-data.com from local newspapers, TV, and radio stations

 | Anyone have a house to rent? (3 replies) |
| EaDo townhomes ... Safe or no? (8 replies) |
| Why is it that Houston seems to have more of an "energetic vibe" than Dallas? (607 replies) |
| Houston CORE developments thread (743 replies) |
| Renting a townhome in Houston: Greater Heights v. Rice Military? (10 replies) |
| Homeschool Family in Search of Texas Location (18 replies) |

Median year apartment built: 1993
Household type by relationship:
Households: 5,487- Male householders: 466 (171 living alone), Female householders: 556 (100 living alone)
455 spouses (455 opposite-sex spouses), 60 unmarried partners, (60 opposite-sex unmarried partners), 863 children (772 natural, 32 adopted, 58 stepchildren), 93 grandchildren, 7 brothers or sisters, 34 parents, 18 foster children, 53 other relatives, 53 non-relatives
- In group quarters: 2,823
Size of family households: 235 2-persons, 169 3-persons, 198 4-persons, 91 5-persons, 19 6-persons, 10 7-or-more-persons.
Size of nonfamily households: 286 1-person, 38 2-persons.
523 married couples with children.
147 single-parent households (1 men, 146 women).
85.2% of residents of Rusk speak English at home.
13.8% of residents speak Spanish at home (67% speak English very well, 19% speak English well, 6% speak English not well, 8% don't speak English at all).
0.1% of residents speak other Indo-European language at home (43% speak English very well, 57% speak English not well).
0.5% of residents speak Asian or Pacific Island language at home (14% speak English very well, 86% speak English not well).
Foreign born population: 271 (4.9%)
(17.3% of them are naturalized citizens)
| Here: | 5.4 |
| State: | 6.3 |
| Here: | 4.6 |
| State: | 4.0 |

- Bedrooms in owner-occupied houses and condos in Rusk, Texas
- 3no bedroom
- 231 bedroom
- 1772 bedrooms
- 4153 bedrooms
- 434 bedrooms
- 405+ bedrooms

- Bedrooms in renter-occupied apartments in Rusk, Texas
- 4no bedroom
- 371 bedroom
- 612 bedrooms
- 2483 bedrooms
- 04 bedrooms
- 05+ bedrooms

- Cars and other vehicles available in Rusk in owner-occupied houses/condos
- 23no vehicle
- 1551 vehicle
- 3572 vehicles
- 1543 vehicles
- 04 vehicles
- 125+ vehicles

- Cars and other vehicles available in Rusk in renter-occupied apartments
- 37no vehicle
- 1691 vehicle
- 1452 vehicles
- 03 vehicles
- 04 vehicles
- 05+ vehicles

- Rooms in owner-occupied houses in Rusk, Texas
- 31 room
- 02 rooms
- 163 rooms
- 1274 rooms
- 2285 rooms
- 1386 rooms
- 707 rooms
- 878 rooms
- 339+ rooms

- Rooms in renter-occupied apartments in Rusk, Texas
- 41 room
- 02 rooms
- 383 rooms
- 984 rooms
- 1795 rooms
- 226 rooms
- 107 rooms
- 08 rooms
- 09+ rooms


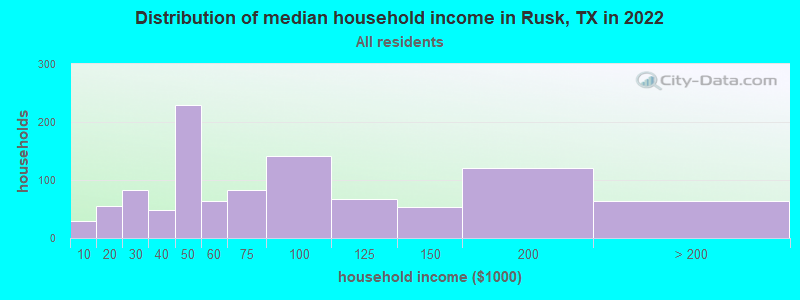
Rusk, TX household income distribution

- 30Less than $10,000
- 56$10,000 to $19,999
- 82$20,000 to $29,999
- 49$30,000 to $39,999
- 229$40,000 to $49,999
- 64$50,000 to $59,999
- 83$60,000 to $74,999
- 141$75,000 to $99,999
- 67$100,000 to $124,999
- 53$125,000 to $149,999
- 121$150,000 to $199,999
- 64$200,000 or more
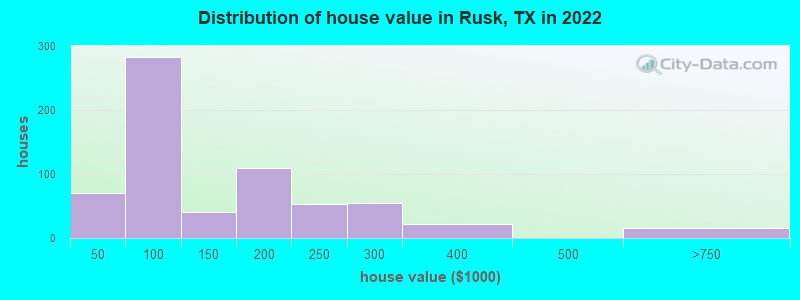
Home value of owner - occupied houses in 2022 in Rusk, TX
-
- 8$10,000 to $14,999
- 10$25,000 to $29,999
- 2$30,000 to $34,999
- 14$35,000 to $39,999
- 34$40,000 to $49,999
- 9$50,000 to $59,999
- 37$60,000 to $69,999
- 113$70,000 to $79,999
- 69$80,000 to $89,999
- 19$90,000 to $99,999
- 14$100,000 to $124,999
- 25$125,000 to $149,999
- 29$150,000 to $174,999
- 79$175,000 to $199,999
- 52$200,000 to $249,999
- 55$250,000 to $299,999
- 22$300,000 to $399,999
- 15$500,000 to $749,999
Rent paid by renters in 2022 in Rusk, TX
-
- 26$200 to $249
- 2$250 to $299
- 23$300 to $349
- 5$400 to $449
- 15$450 to $499
- 26$500 to $549
- 11$550 to $599
- 38$800 to $899
- 48$900 to $999
- 4$1,250 to $1,499
- 123No cash rent


Percentage of workers working in this county: 79.3%
Number of people working at home: 334 (28.5% of all workers)
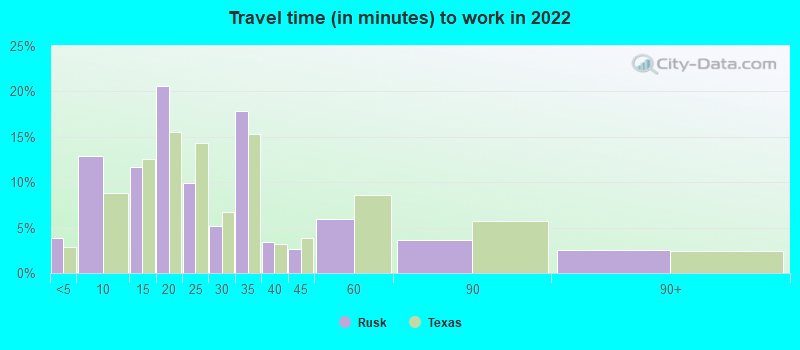
Travel time to work (commute)
- Less than 5 minutes: 81
- 5 to 9 minutes: 242
- 10 to 14 minutes: 170
- 15 to 19 minutes: 73
- 20 to 24 minutes: 63
- 25 to 29 minutes: 29
- 30 to 34 minutes: 54
- 35 to 39 minutes: 26
- 40 to 44 minutes: 30
- 45 to 59 minutes: 49
- 60 to 89 minutes: 8
- 90 or more minutes: 52
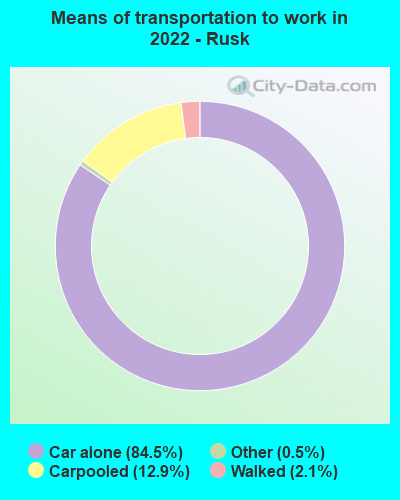
Means of transportation to work:
- Drove a car alone: 2,787 (74.7%)
- Carpooled: 463 (12.4%)
- Taxi: 18 (0.5%)
- Walked: 74 (2.0%)
- Worked at home: 334 (9.0%)

- Unemployment by race in 2022
- Unemployment rate for White non-Hispanic residents
- 4.6%Males
- 20.4%Females

- Year of entry for the foreign-born population in Rusk, Texas
- 482010 or later
- 722000 to 2009
- 1121990 to 1999
- 101980 to 1989
- 01970 to 1979
- 5Before 1970

First ancestries reported:
- American: 885 (23.8%)
- English: 158 (4.3%)
- German: 88 (2.4%)
- African: 66 (1.8%)
- Irish: 31 (0.8%)
- French: 12 (0.3%)
- Scottish: 12 (0.3%)
- Scotch-Irish: 9 (0.2%)
- Italian: 7 (0.2%)
- Swedish: 7 (0.2%)
Most common places of birth for foreign-born residents (%):
| Rusk: | 62.0% (168) |
| Texas: | 48.4% (2,411,723) |
| Rusk: | 8.9% (24) |
| Texas: | 4.5% (224,455) |
| Rusk: | 8.1% (22) |
| Texas: | 1.8% (87,382) |
| Rusk: | 7.7% (21) |
| Texas: | 3.7% (184,770) |
| Rusk: | 4.1% (11) |
| Texas: | 0.4% (20,885) |
| Rusk: | 1.8% (5) |
| Texas: | 0.4% (17,748) |
Place of birth for U.S.-born residents:
- This state: 4,388
- Other state: 753
- Northeast: 96
- Midwest: 68
- South: 342
- West: 248
76.7% of Rusk residents lived in the same house 1 years ago.
Out of people who lived in different houses, 14.2% lived in this county.
Out of people who lived in different counties, 96.8% lived in Texas.
| Rusk: | 76.7% |
| State average: | 85.7% |
Education attainment for males 25 years and older:
- No schooling: 32
- Nursery to 4th grade: 48
- 5th and 6th grade: 55
- 7th and 8th grade: 125
- 9th grade: 87
- 10th grade: 368
- 11th grade: 186
- 12th grade, no diploma: 224
- High school graduate (or equivalency): 1,231
- Less than 1 year of college: 234
- Some college more than 1 year, no degree: 291
- Associate degree: 45
- Bachelor's degree: 142
- Master's degree: 21
- Professional school degree: 34
- Doctorate degree: 0

Education attainment for females 25 years and older:
- No schooling: 7
- Nursery to 4th grade: 9
- 5th and 6th grade: 0
- 7th and 8th grade: 11
- 9th grade: 0
- 10th grade: 85
- 11th grade: 6
- 12th grade, no diploma: 47
- High school graduate (or equivalency): 411
- Less than 1 year of college: 168
- Some college more than 1 year, no degree: 156
- Associate degree: 55
- Bachelor's degree: 121
- Master's degree: 61
- Professional school degree: 0
- Doctorate degree: 4


Housing units in structures:
- One, detached: 1,017
- Two: 28
- 5 to 9: 3
- 10 to 19: 4
- 20 to 49: 22
- Mobile homes: 117
- Boats, RVs, vans, etc.: 3
Housing units lacking complete kitchen facilities in 2022: 3.4%
House/condo owner moved in on average 12 years ago
Renter moved in on average 4 years ago

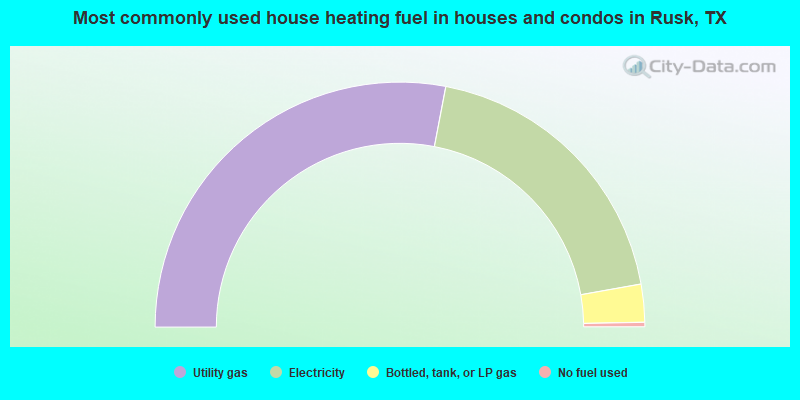
- 56.0%Utility gas
- 38.4%Electricity
- 5.0%Bottled, tank, or LP gas
- 0.6%No fuel used
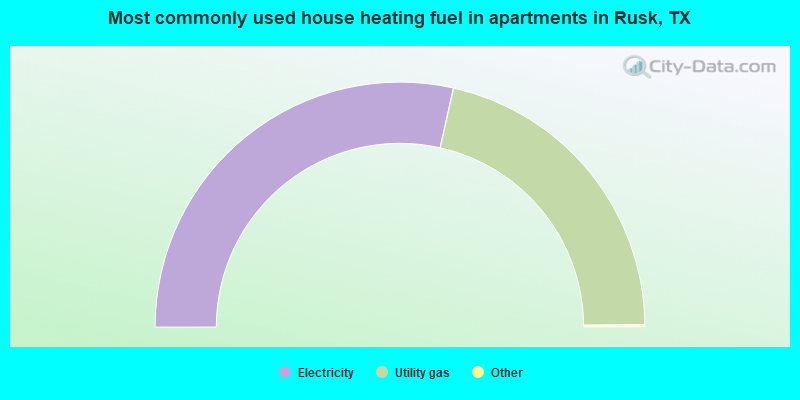
- 57.2%Electricity
- 42.8%Utility gas
Private vs. public school enrollment:
| Here: | 0.0% |
| Texas: | 8.8% |
| Here: | 3.4% |
| Texas: | 8.0% |
| Here: | 9.4% |
| Texas: | 16.2% |


