Rutherford, PA (Pennsylvania) Houses and Residents
| Rutherford: | $177,408 |
| Pennsylvania: | $245,500 |
Mean price in 2022:
Detached houses: $237,712
Here: $237,712 State: $317,202 Townhouses or other attached units: $192,823
Here: $192,823 State: $254,369
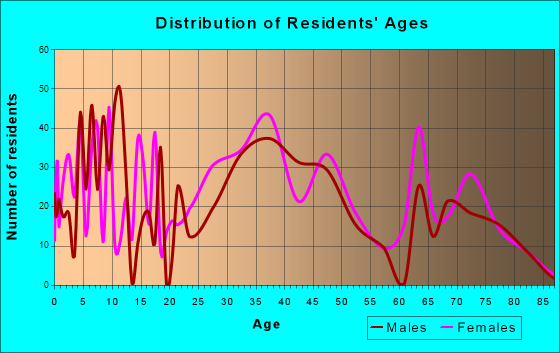
Total population: 4,303 (Urban population: 3,854, Rural population: 0)
Houses: 2,419 (2,401 occupied: 1,819 owner occupied, 649 renter occupied)
| % of renters here: | 26% |
| State: | 31% |
Housing density: 1,971 houses/condos per square mile
Median price asked for vacant for-sale houses and condos in 2022: $876,468.
Median gross rent in Rutherford, PA in 2022: $1,141
Housing units in Rutherford with a mortgage: 1,282 (90 second mortgage, 0 home equity loan, 83 both second mortgage and home equity loan)
Houses without a mortgage: 95
Median household income for houses/condos with a mortgage: $86,927
Median household income for apartments without a mortgage: $69,665
Median monthly housing costs: $1,204
Compare current foreclosures near Rutherford, PA:
| Photo | Address | Area | Beds / Baths | Price | Details |
|---|---|---|---|---|---|

|
#1
Governor Stable Rd
Bainbridge, PA 17502
|
1,599 sq. feet
|
2 baths 3 beds |
show details | |

|
#2
Park St
Harrisburg, PA 17103
|
1,820 sq. feet
|
1 baths 5 beds |
show details | |

|
#3
Conewago Ave
Manchester, PA 17345
|
768 sq. feet
|
1 baths 2 beds |
show details | |

|
#4
S 16th St
Harrisburg, PA 17104
|
800 sq. feet
|
1 baths 2 beds |
show details | |

|
#5
Queen St
Palmyra, PA 17078
|
1,120 sq. feet
|
1 baths 2 beds |
show details | |

|
#6
Race St
Bainbridge, PA 17502
|
1,290 sq. feet
|
3 baths 3 beds |
show details | |

|
#7
Hilltop View Way
Elizabethtown, PA 17022
|
1,092 sq. feet
|
1 baths 3 beds |
show details | |

|
#8
Lawn Rd
Palmyra, PA 17078
|
1,830 sq. feet
|
2 baths 2 beds |
show details | |

|
#9
Green St
Harrisburg, PA 17102
|
2,412 sq. feet
|
1 baths 5 beds |
show details | |

|
#10
W Vine St
Camp Hill, PA 17011
|
1,360 sq. feet
|
3 baths 3 beds |
show details |
| Photo | Address | Area | Beds / Baths | Price | Details |
|---|---|---|---|---|---|

|
#11
Main St
Harrisburg, PA 17113
|
1,205 sq. feet
|
1 baths 4 beds |
show details | |

|
#12
Groff Ave
Elizabethtown, PA 17022
|
1,384 sq. feet
|
1 baths 4 beds |
show details | |

|
#13
Crossing Way
Manchester, PA 17345
|
1,094 sq. feet
|
1 baths 3 beds |
show details | |

|
#14
Prince St
Harrisburg, PA 17109
|
1,040 sq. feet
|
1 baths 2 beds |
show details | |

|
#15
Carlisle Pike
Mechanicsburg, PA 17050
|
2,176 sq. feet
|
1 baths 3 beds |
show details | |

|
#16
N 2nd St
Lemoyne, PA 17043
|
1,520 sq. feet
|
1 baths 3 beds |
show details | |

|
#17
1/2 Norwood St
Harrisburg, PA 17104
|
1,569 sq. feet
|
1 baths 4 beds |
show details | |

|
#18
N Lancaster St
Annville, PA 17003
|
1,257 sq. feet
|
1 baths 4 beds |
show details | |

|
#19
S 2nd St
Lemoyne, PA 17043
|
1,120 sq. feet
|
1 baths 2 beds |
show details | |

|
#20
Heisey Ave
Elizabethtown, PA 17022
|
1,072 sq. feet
|
1 baths 3 beds |
show details |
| Photo | Address | Area | Beds / Baths | Price | Details |
|---|---|---|---|---|---|

|
#21
Dogwood Dr
Elizabethtown, PA 17022
|
2,220 sq. feet
|
2 baths 4 beds |
show details | |

|
#22
Randolph St
Harrisburg, PA 17104
|
1,220 sq. feet
|
1 baths 3 beds |
show details | |

|
#23
Crescent Dr
New Cumberland, PA 17070
|
2,052 sq. feet
|
2 baths 4 beds |
show details | |

|
#24
Nixon Dr
Mechanicsburg, PA 17055
|
2,020 sq. feet
|
1 baths 3 beds |
show details | |

|
#25
E High St
Elizabethtown, PA 17022
|
1,276 sq. feet
|
2 baths 3 beds |
show details | |

|
#26
Lancaster Blvd Apt 11
Mechanicsburg, PA 17055
|
1,214 sq. feet
|
2 baths 2 beds |
show details | |

|
#27
Berkley Dr
Middletown, PA 17057
|
1,196 sq. feet
|
1 baths 4 beds |
show details | |

|
#28
Meadowlark Pl
Harrisburg, PA 17104
|
1,380 sq. feet
|
1 baths 3 beds |
show details | |

|
#29
N Lime St
Elizabethtown, PA 17022
|
1,200 sq. feet
|
2 baths 3 beds |
show details | |

|
#30
W Oak St
Elizabethtown, PA 17022
|
1,080 sq. feet
|
2 baths 3 beds |
show details |
| Photo | Address | Area | Beds / Baths | Price | Details |
|---|---|---|---|---|---|

|
#31
N Market St
Elizabethtown, PA 17022
|
1,656 sq. feet
|
1 baths 3 beds |
show details | |

|
#32
Laurel Grove Rd
Annville, PA 17003
|
1,176 sq. feet
|
1 baths 3 beds |
show details | |

|
#33
Rhema Ct
Elizabethtown, PA 17022
|
1,428 sq. feet
|
2 baths 2 beds |
show details | |

|
#34
Shawnee Dr
Harrisburg, PA 17112
|
1,092 sq. feet
|
1 baths 3 beds |
show details | |

|
#35
S Enola Dr
Enola, PA 17025
|
2,088 sq. feet
|
2 baths 6 beds |
show details | |

|
#36
E Washington St
Elizabethtown, PA 17022
|
1,578 sq. feet
|
1 baths 3 beds |
show details | |

|
#37
Redwood St
Harrisburg, PA 17109
|
864 sq. feet
|
1 baths 2 beds |
show details | |

|
#38
College Ave
Elizabethtown, PA 17022
|
1,419 sq. feet
|
1 baths 3 beds |
show details | |

|
#39
Church Rd
Hummelstown, PA 17036
|
1,520 sq. feet
|
3 baths 4 beds |
show details | |

|
#40
N 5th St
Harrisburg, PA 17110
|
1,815 sq. feet
|
1 baths 4 beds |
show details |
| Photo | Address | Area | Beds / Baths | Price | Details |
|---|---|---|---|---|---|

|
#41
Mulberry St
Harrisburg, PA 17104
|
1,683 sq. feet
|
1 baths 4 beds |
show details | |

|
#42
2nd St
Lemoyne, PA 17043
|
1,120 sq. feet
|
1 baths 2 beds |
show details | |

|
#43
2nd Street Aka 493 Second Street
Highspire, PA 17034
|
1,864 sq. feet
|
1 baths 3 beds |
show details | |

|
#44
Heatherfield Way
Harrisburg, PA 17112
|
1,308 sq. feet
|
2 baths 3 beds |
show details | |

|
#45
Rob Dr
Mount Joy, PA 17552
|
1,240 sq. feet
|
2 baths 3 beds |
show details | |

|
#46
Hunters Ridge Dr
Harrisburg, PA 17110
|
1,364 sq. feet
|
2 baths 3 beds |
show details | |

|
#47
Clover Ln
Halifax, PA 17032
|
1,103 sq. feet
|
1 baths 3 beds |
show details | |

|
#48
S 18th St
Camp Hill, PA 17011
|
1,064 sq. feet
|
1 baths 3 beds |
show details | |

|
#49
Prosperous Dr
Harrisburg, PA 17112
|
3,734 sq. feet
|
3 baths 4 beds |
show details | |

|
Check over 1 million property listings on Foreclosure.com!
|
browse all offers | |||

Latest news about housing in Rutherford, PA collected exclusively by city-data.com from local newspapers, TV, and radio stations


Median year apartment built: 1996
Household type by relationship:
Households: 6,632- Male householders: 942 (197 living alone), Female householders: 1,458 (357 living alone)
1,198 spouses (1,193 opposite-sex spouses), 212 unmarried partners, (212 opposite-sex unmarried partners), 2,280 children (2,234 natural, 0 adopted, 45 stepchildren), 78 grandchildren, 53 brothers or sisters, 185 parents, 0 foster children, 74 other relatives, 138 non-relatives
- In group quarters: 9
Size of family households: 729 2-persons, 431 3-persons, 256 4-persons, 156 5-persons, 108 6-persons, 16 7-or-more-persons.
Size of nonfamily households: 570 1-person, 181 2-persons.
968 married couples with children.
452 single-parent households (0 men, 452 women).
71.9% of residents of Rutherford speak English at home.
8.4% of residents speak Spanish at home (60% speak English very well, 26% speak English well, 14% speak English not well).
12.3% of residents speak other Indo-European language at home (17% speak English very well, 48% speak English well, 10% speak English not well, 24% don't speak English at all).
7.3% of residents speak Asian or Pacific Island language at home (54% speak English very well, 27% speak English well, 8% speak English not well, 12% don't speak English at all).
0.8% of residents speak other language at home (84% speak English very well, 16% speak English well).
Foreign born population: 1,687 (25.4%)
(68.3% of them are naturalized citizens)
| Here: | 6.3 |
| State: | 6.8 |
| Here: | 5.0 |
| State: | 4.3 |

- Bedrooms in owner-occupied houses and condos in Rutherford, Pennsylvania
- 0no bedroom
- 131 bedroom
- 5012 bedrooms
- 7913 bedrooms
- 3914 bedrooms
- 1225+ bedrooms

- Bedrooms in renter-occupied apartments in Rutherford, Pennsylvania
- 0no bedroom
- 211 bedroom
- 3502 bedrooms
- 2793 bedrooms
- 04 bedrooms
- 05+ bedrooms

- Cars and other vehicles available in Rutherford in owner-occupied houses/condos
- 35no vehicle
- 3481 vehicle
- 1,1272 vehicles
- 1623 vehicles
- 934 vehicles
- 545+ vehicles

- Cars and other vehicles available in Rutherford in renter-occupied apartments
- 13no vehicle
- 4011 vehicle
- 2192 vehicles
- 03 vehicles
- 174 vehicles
- 05+ vehicles

- Rooms in owner-occupied houses in Rutherford, Pennsylvania
- 01 room
- 02 rooms
- 173 rooms
- 2374 rooms
- 1155 rooms
- 6786 rooms
- 3387 rooms
- 2068 rooms
- 2299+ rooms

- Rooms in renter-occupied apartments in Rutherford, Pennsylvania
- 01 room
- 02 rooms
- 213 rooms
- 2934 rooms
- 215 rooms
- 1726 rooms
- 987 rooms
- 08 rooms
- 469+ rooms


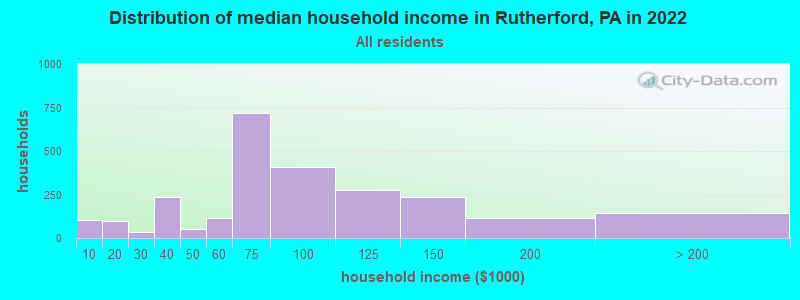
Rutherford, PA household income distribution

- 102Less than $10,000
- 97$10,000 to $19,999
- 32$20,000 to $29,999
- 238$30,000 to $39,999
- 53$40,000 to $49,999
- 113$50,000 to $59,999
- 719$60,000 to $74,999
- 409$75,000 to $99,999
- 278$100,000 to $124,999
- 234$125,000 to $149,999
- 113$150,000 to $199,999
- 145$200,000 or more
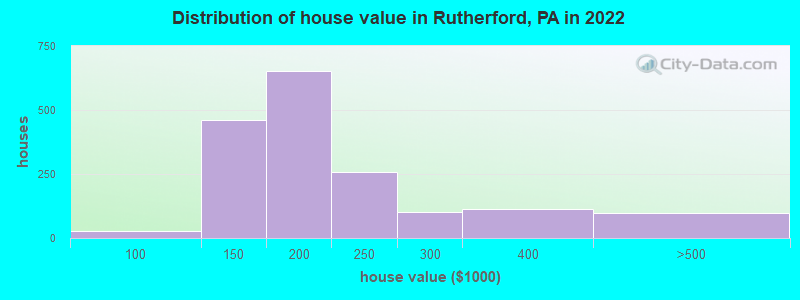
Home value of owner - occupied houses in 2022 in Rutherford, PA
-
- 27$90,000 to $99,999
- 167$100,000 to $124,999
- 291$125,000 to $149,999
- 434$150,000 to $174,999
- 218$175,000 to $199,999
- 257$200,000 to $249,999
- 102$250,000 to $299,999
- 114$300,000 to $399,999
- 99$400,000 to $499,999
Rent paid by renters in 2022 in Rutherford, PA
-
- 88Less than $100
- 22$150 to $199
- 6$600 to $649
- 138$700 to $749
- 8$750 to $799
- 32$800 to $899
- 20$900 to $999
- 17$1,000 to $1,249
- 219$1,500 to $1,999
- 28No cash rent


Percentage of workers working in this county: 75.6%
Number of people working at home: 434 (12.5% of all workers)
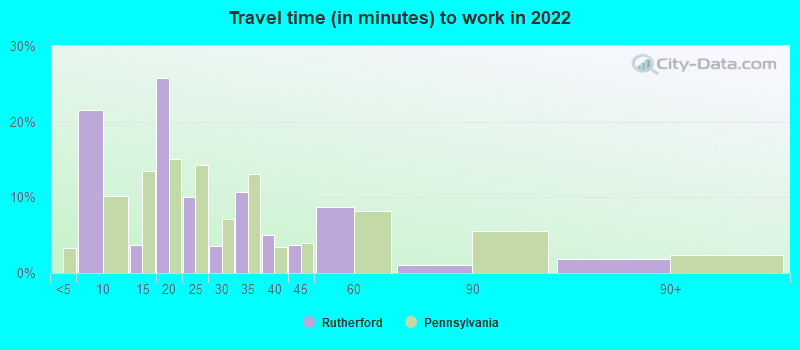
Travel time to work (commute)
- Less than 5 minutes: 0
- 5 to 9 minutes: 259
- 10 to 14 minutes: 387
- 15 to 19 minutes: 777
- 20 to 24 minutes: 683
- 25 to 29 minutes: 189
- 30 to 34 minutes: 169
- 35 to 39 minutes: 58
- 40 to 44 minutes: 40
- 45 to 59 minutes: 242
- 60 to 89 minutes: 25
- 90 or more minutes: 90
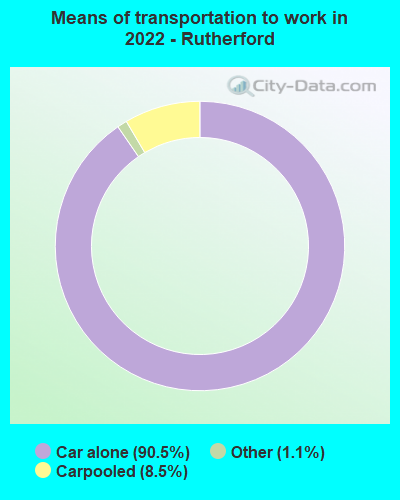
Means of transportation to work:
- Drove a car alone: 608 (61.0%)
- Carpooled: 49 (4.9%)
- Taxi: 10 (1.0%)
- Worked at home: 434 (43.6%)

- Unemployment by race in 2022
- Unemployment rate for White non-Hispanic residents
- 0.8%Males
- 5.2%Females
- Unemployment rate for Black residents
- 5.6%Males
- Unemployment rate for Asian residents
- 9.1%Males

- Year of entry for the foreign-born population in Rutherford, Pennsylvania
- 5542010 or later
- 6312000 to 2009
- 2121990 to 1999
- 261980 to 1989
- 251970 to 1979
- 84Before 1970

First ancestries reported:
- German: 324 (9.4%)
- American: 143 (4.1%)
- Irish: 97 (2.8%)
- English: 76 (2.2%)
- Italian: 52 (1.5%)
- Polish: 43 (1.2%)
- Trinidadian and Tobagonian: 35 (1.0%)
- Moroccan: 28 (0.8%)
- Scotch-Irish: 26 (0.8%)
- Serbian: 23 (0.7%)
- Hungarian: 15 (0.4%)
- Kenyan: 12 (0.3%)
- Pennsylvania German: 11 (0.3%)
Most common places of birth for foreign-born residents (%):
| Rutherford: | 32.6% (472) |
| Pennsylvania: | 0.7% (6,855) |
| Rutherford: | 27.0% (391) |
| Pennsylvania: | 0.8% (7,882) |
| Rutherford: | 9.5% (138) |
| Pennsylvania: | 3.3% (31,542) |
| Rutherford: | 7.7% (111) |
| Pennsylvania: | 0.3% (2,470) |
| Rutherford: | 6.0% (87) |
| Pennsylvania: | 9.2% (86,544) |
| Rutherford: | 3.4% (49) |
| Pennsylvania: | 10.7% (100,596) |
| Rutherford: | 3.0% (44) |
| Pennsylvania: | 0.3% (3,273) |
| Rutherford: | 2.9% (42) |
| Pennsylvania: | 7.2% (67,704) |
| Rutherford: | 2.5% (36) |
| Pennsylvania: | 0.8% (7,224) |
| Rutherford: | 2.4% (34) |
| Pennsylvania: | 0.4% (3,736) |
| Rutherford: | 1.5% (22) |
| Pennsylvania: | 0.5% (4,483) |
Place of birth for U.S.-born residents:
- This state: 3,839
- Other state: 1,067
- Northeast: 234
- Midwest: 76
- South: 697
- West: 119
87.5% of Rutherford residents lived in the same house 1 years ago.
Out of people who lived in different houses, 46.1% lived in this county.
Out of people who lived in different counties, 24.6% lived in Pennsylvania.
| Rutherford: | 87.5% |
| State average: | 89.3% |
Education attainment for males 25 years and older:
- No schooling: 61
- Nursery to 4th grade: 0
- 5th and 6th grade: 0
- 7th and 8th grade: 37
- 9th grade: 0
- 10th grade: 79
- 11th grade: 71
- 12th grade, no diploma: 71
- High school graduate (or equivalency): 788
- Less than 1 year of college: 133
- Some college more than 1 year, no degree: 153
- Associate degree: 169
- Bachelor's degree: 359
- Master's degree: 47
- Professional school degree: 0
- Doctorate degree: 43

Education attainment for females 25 years and older:
- No schooling: 231
- Nursery to 4th grade: 0
- 5th and 6th grade: 0
- 7th and 8th grade: 0
- 9th grade: 0
- 10th grade: 42
- 11th grade: 56
- 12th grade, no diploma: 16
- High school graduate (or equivalency): 528
- Less than 1 year of college: 370
- Some college more than 1 year, no degree: 161
- Associate degree: 137
- Bachelor's degree: 496
- Master's degree: 141
- Professional school degree: 63
- Doctorate degree: 0


Housing units in structures:
- One, detached: 1,133
- One, attached: 953
- 3 or 4: 261
- 5 to 9: 20
- 10 to 19: 7
- 20 to 49: 13
- Mobile homes: 30
House/condo owner moved in on average 12 years ago
Renter moved in on average 3 years ago

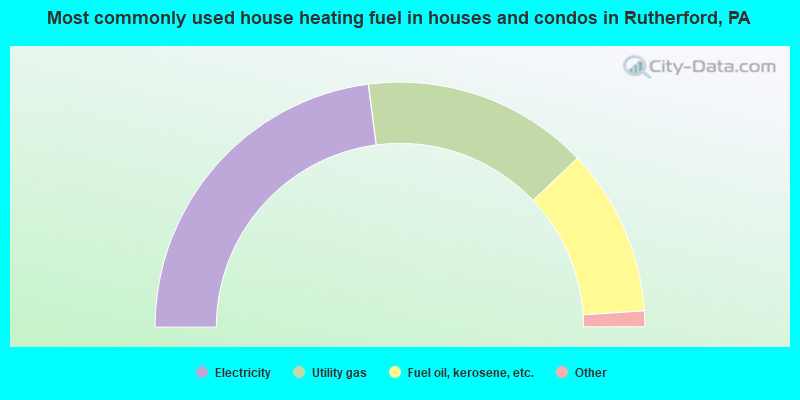
- 45.9%Electricity
- 29.9%Utility gas
- 22.1%Fuel oil, kerosene, etc.
- 1.2%Bottled, tank, or LP gas
- 0.9%Other fuel

- 55.8%Electricity
- 44.2%Utility gas
Private vs. public school enrollment:
| Here: | 7.2% |
| Pennsylvania: | 15.7% |
| Here: | 10.9% |
| Pennsylvania: | 13.4% |
| Here: | 21.4% |
| Pennsylvania: | 39.8% |


