Rutland, NY (New York) Houses and Residents
| Rutland: | $170,979 |
| New York: | $400,400 |
Total population: 3,060 (Urban population: 1,378 (all inside urban clusters), Rural population: 1,560 (126 farm, 1,434 nonfarm))
Houses: 1,154 (1,080 occupied: 820 owner occupied, 260 renter occupied)
| % of renters here: | 24% |
| State: | 46% |
Housing density: 26 houses/condos per square mile
Median price asked for vacant for-sale houses and condos in 2022 in this county: $102,223.
Median contract rent in 2022: $1,083 (lower quartile is $737, upper quartile is $1,208)
Median rent asked for vacant for-rent units in 2022: $1,156
Median gross rent in Rutland, NY in 2022: $1,239
Housing units in Rutland with a mortgage: 366 (21 second mortgage, 54 home equity loan, 4 both second mortgage and home equity loan)
Houses without a mortgage: 141


Household type by relationship:
Households: 110,059- In family households: 92,854 (20,324 male householders, 9,309 female householders)
22,194 spouses, 33,918 children (30,893 natural, 747 adopted, 2,278 stepchildren), 1,654 grandchildren, 586 brothers or sisters, 657 parents, foster children, 750 other relatives, 2,961 non-relatives
- In nonfamily households: 17,205 (6,972 male householders (5,270 living alone)), 6,846 female householders (5,853 living alone)), 3,387 nonrelatives
- In group quarters: 6,170 (2,196 institutionalized population)
20,842 married couples with children.
6,678 single-parent households (1,793 men, 4,885 women).
96.6% of residents of Rutland speak English at home.
1.5% of residents speak Spanish at home (95% speak English very well, 5% speak English not well).
1.3% of residents speak other Indo-European language at home (86% speak English very well, 14% speak English well).
0.6% of residents speak Asian or Pacific Island language at home (12% speak English very well, 41% speak English well, 47% speak English not well).
Foreign born population: 85 (2.8%)
(96.5% of them are naturalized citizens)
| Here: | 6.7 |
| State: | 6.3 |
| Here: | 4.7 |
| State: | 3.8 |

- Bedrooms in owner-occupied houses and condos in Rutland, New York
- 0no bedroom
- 181 bedroom
- 1532 bedrooms
- 4543 bedrooms
- 1464 bedrooms
- 495+ bedrooms

- Bedrooms in renter-occupied apartments in Rutland, New York
- 2no bedroom
- 191 bedroom
- 1382 bedrooms
- 793 bedrooms
- 224 bedrooms
- 05+ bedrooms

- Cars and other vehicles available in Rutland in owner-occupied houses/condos
- 11no vehicle
- 2661 vehicle
- 3792 vehicles
- 1313 vehicles
- 284 vehicles
- 55+ vehicles

- Cars and other vehicles available in Rutland in renter-occupied apartments
- 24no vehicle
- 1561 vehicle
- 802 vehicles
- 03 vehicles
- 04 vehicles
- 05+ vehicles

- Rooms in owner-occupied houses in Rutland, New York
- 01 room
- 62 rooms
- 173 rooms
- 674 rooms
- 1655 rooms
- 1676 rooms
- 1547 rooms
- 1058 rooms
- 1399+ rooms

- Rooms in renter-occupied apartments in Rutland, New York
- 21 room
- 22 rooms
- 243 rooms
- 994 rooms
- 635 rooms
- 406 rooms
- 97 rooms
- 168 rooms
- 59+ rooms


Rutland, NY household income distribution

- 3,578Less than $10,000
- 5,177$10,000 to $19,999
- 3,854$20,000 to $29,999
- 5,706$30,000 to $39,999
- 4,519$40,000 to $49,999
- 3,064$50,000 to $59,999
- 4,849$60,000 to $74,999
- 7,171$75,000 to $99,999
- 5,293$100,000 to $124,999
- 2,430$125,000 to $149,999
- 2,304$150,000 to $199,999
- 2,190$200,000 or more

Percentage of workers working in this county: 94.7%
Number of people working at home: 194 (13.5% of all workers)
Travel time to work (commute)
- Less than 5 minutes: 42
- 5 to 9 minutes: 158
- 10 to 14 minutes: 217
- 15 to 19 minutes: 300
- 20 to 24 minutes: 305
- 25 to 29 minutes: 70
- 30 to 34 minutes: 64
- 35 to 39 minutes: 11
- 40 to 44 minutes: 9
- 45 to 59 minutes: 17
- 60 to 89 minutes: 17
- 90 or more minutes: 15
Means of transportation to work:
- Drove a car alone: 1,072 (82.8%)
- Carpooled: 119 (9.2%)
- Taxi: 7 (0.5%)
- Walked: 24 (1.9%)
- Other means: 3 (0.2%)
- Worked at home: 69 (5.3%)


- Year of entry for the foreign-born population in Rutland, New York
- 01995 to March 2000
- 111990 to 1994
- 61985 to 1989
- 21980 to 1984
- 181975 to 1979
- 51970 to 1974
- 01965 to 1969
- 11Before 1965

First ancestries reported:
- Irish: 507 (16.8%)
- German: 458 (15.2%)
- English: 439 (14.5%)
- Other: 408 (13.5%)
- French: 304 (10.1%)
- United States: 273 (9.0%)
- Italian: 158 (5.2%)
- French Canadian: 141 (4.7%)
- Polish: 104 (3.4%)
- Dutch: 64 (2.1%)
- Scottish: 42 (1.4%)
- Scotch-Irish: 23 (0.8%)
- Ukrainian: 19 (0.6%)
- Swedish: 18 (0.6%)
- Swiss: 16 (0.5%)
- Welsh: 14 (0.5%)
- Russian: 10 (0.3%)
- Hungarian: 8 (0.3%)
- Norwegian: 6 (0.2%)
- Portuguese: 6 (0.2%)
- Slovak: 4 (0.1%)
- Subsaharan African: 1 (0.03%)
Most common places of birth for foreign-born residents (%):
| Rutland: | 28.3% (15) |
| New York: | 1.4% (54,876) |
| Rutland: | 18.9% (10) |
| New York: | 2.5% (97,933) |
| Rutland: | 17.0% (9) |
| New York: | 1.8% (69,327) |
| Rutland: | 9.4% (5) |
| New York: | 1.4% (53,825) |
| Rutland: | 9.4% (5) |
| New York: | 1.9% (72,408) |
| Rutland: | 7.5% (4) |
| New York: | 0.6% (25,141) |
| Rutland: | 5.7% (3) |
| New York: | 0.1% (4,305) |
| Rutland: | 3.8% (2) |
| New York: | 0.2% (7,400) |
Place of birth for U.S.-born residents:
- This state: 2,443
- Other state: 393
- Northeast: 90
- Midwest: 122
- South: 133
- West: 48
60% of Rutland residents lived in the same house 5 years ago.
Out of people who lived in different houses, 74% lived in this county.
Out of people who lived in different counties, 33% lived in New York.
Education attainment for males 25 years and older:
- No schooling: 0
- Nursery to 4th grade: 0
- 5th and 6th grade: 13
- 7th and 8th grade: 17
- 9th grade: 32
- 10th grade: 44
- 11th grade: 44
- 12th grade, no diploma: 21
- High school graduate (or equivalency): 380
- Less than 1 year of college: 105
- Some college more than 1 year, no degree: 83
- Associate degree: 86
- Bachelor's degree: 57
- Master's degree: 26
- Professional school degree: 11
- Doctorate degree: 0

Education attainment for females 25 years and older:
- No schooling: 0
- Nursery to 4th grade: 0
- 5th and 6th grade: 3
- 7th and 8th grade: 9
- 9th grade: 30
- 10th grade: 23
- 11th grade: 14
- 12th grade, no diploma: 44
- High school graduate (or equivalency): 423
- Less than 1 year of college: 90
- Some college more than 1 year, no degree: 114
- Associate degree: 82
- Bachelor's degree: 55
- Master's degree: 35
- Professional school degree: 11
- Doctorate degree: 0


Housing units in structures:
- One, detached: 699
- One, attached: 20
- Two: 72
- 3 or 4: 31
- 5 to 9: 25
- 10 to 19: 11
- 20 to 49: 4
- Mobile homes: 292
Median worth of mobile homes: $73,041
Housing units lacking complete kitchen facilities: 1.0%

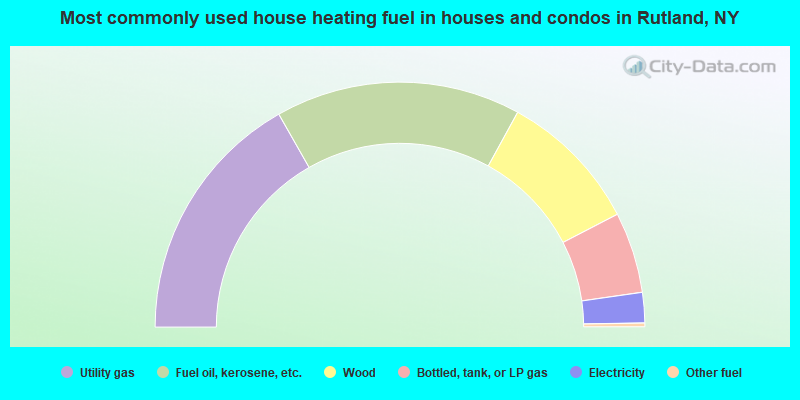
- 33.5%Utility gas
- 32.4%Fuel oil, kerosene, etc.
- 18.8%Wood
- 10.7%Bottled, tank, or LP gas
- 4.0%Electricity
- 0.5%Other fuel
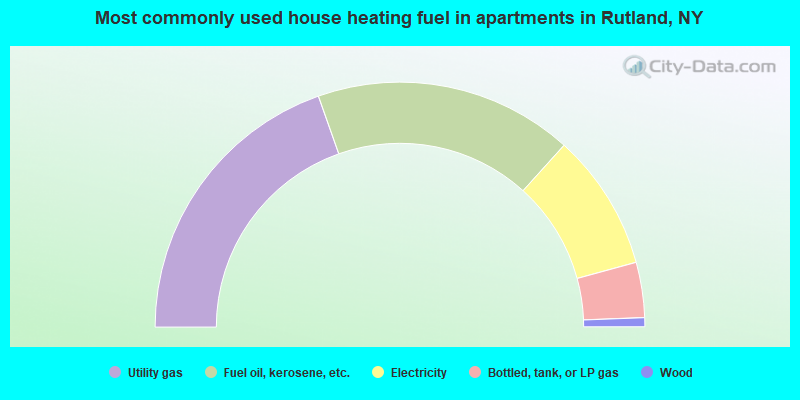
- 39.2%Utility gas
- 34.2%Fuel oil, kerosene, etc.
- 18.1%Electricity
- 7.3%Bottled, tank, or LP gas
- 1.2%Wood
Private vs. public school enrollment:
| Here: | 8.2% |
| New York: | 14.0% |
| Here: | 0.0% |
| New York: | 13.2% |
| Here: | 18.4% |
| New York: | 38.2% |


