Ryland Heights, KY (Kentucky) Houses and Residents
| Ryland Heights: | $197,965 |
| Kentucky: | $196,300 |
Mean price in 2022:
Detached houses: $222,715
Here: $222,715 State: $256,452 Mobile homes: $62,064
Here: $62,064 State: $84,635
Total population: 1,037 (Urban population: 16, Rural population: 796 (all nonfarm))
Houses: 358 (323 occupied: 267 owner occupied, 49 renter occupied)
| % of renters here: | 16% |
| State: | 31% |
Housing density: 72 houses/condos per square mile
Median price asked for vacant for-sale houses and condos in 2022 in this county: $436,610.
Median contract rent in 2022: $954 (lower quartile is $766, upper quartile is $1,070)
Median rent asked for vacant for-rent units in 2022: $218
Median gross rent in Ryland Heights, KY in 2022: $1,213
Housing units in Ryland Heights with a mortgage: 149 (20 second mortgage, 0 home equity loan, 9 both second mortgage and home equity loan)
Houses without a mortgage: 13
Median household income for houses/condos with a mortgage: $82,535
Median household income for apartments without a mortgage: $50,326
Median monthly housing costs: $1,023
Compare current foreclosures near Ryland Heights, KY:
| Photo | Address | Area | Beds / Baths | Price | Details |
|---|---|---|---|---|---|

|
#1
Alex Ct
Hebron, KY 41048
|
1,432 sq. feet
|
2 baths 3 beds |
show details | |

|
#2
Musket Cir
Independence, KY 41051
|
1,147 sq. feet
|
2 baths 3 beds |
show details | |

|
#3
Regent Rd
Cincinnati, OH 45245
|
1,886 sq. feet
|
3 baths 3 beds |
show details | |

|
#4
Linda Dr
Cincinnati, OH 45238
|
1,131 sq. feet
|
2 baths 3 beds |
show details | |

|
#5
Bertus St
Cincinnati, OH 45217
|
1,488 sq. feet
|
2 baths 2 beds |
show details | |

|
#6
Woodlyn Hills Dr
Erlanger, KY 41018
|
1,908 sq. feet
|
3 baths 3 beds |
show details | |

|
#7
Fairway Dr
Dry Ridge, KY 41035
|
1,120 sq. feet
|
2 baths 3 beds |
show details | |

|
#8
Orchard Ln
Amelia, OH 45102
|
2,212 sq. feet
|
1 baths 4 beds |
show details | |

|
#9
Andrew St
Cincinnati, OH 45217
|
1,172 sq. feet
|
1 baths 3 beds |
show details | |

|
#10
Blossom Dr
Newport, KY 41076
|
1,823 sq. feet
|
2 baths 3 beds |
show details |
| Photo | Address | Area | Beds / Baths | Price | Details |
|---|---|---|---|---|---|

|
#11
Philloret Dr
Cincinnati, OH 45239
|
1,233 sq. feet
|
1 baths 3 beds |
show details | |

|
#12
Delhi Ave
Cincinnati, OH 45204
|
950 sq. feet
|
1 baths 3 beds |
show details | |

|
#13
Glade Ave
Cincinnati, OH 45230
|
1,138 sq. feet
|
1 baths 3 beds |
show details | |

|
#14
Ann St
Newport, KY 41071
|
939 sq. feet
|
1 baths 2 beds |
show details | |

|
#15
Terrydel Ln
Cincinnati, OH 45245
|
832 sq. feet
|
1 baths 2 beds |
show details | |

|
#16
Stormy Way
Cincinnati, OH 45230
|
2,448 sq. feet
|
2 baths 4 beds |
show details | |

|
#17
Lexington Dr
Erlanger, KY 41018
|
1,063 sq. feet
|
1 baths 3 beds |
show details | |

|
#18
Garvey Ave
Erlanger, KY 41018
|
848 sq. feet
|
1 baths 3 beds |
show details | |

|
#19
Kirkup Ave
Cincinnati, OH 45213
|
2,142 sq. feet
|
2 baths 4 beds |
show details | |

|
#20
Inlet Ct
Amelia, OH 45102
|
2,658 sq. feet
|
2 baths 4 beds |
show details |
| Photo | Address | Area | Beds / Baths | Price | Details |
|---|---|---|---|---|---|

|
#21
Race Rd
Cincinnati, OH 45211
|
1,523 sq. feet
|
2 baths 3 beds |
show details | |

|
#22
Glenway Ave
Cincinnati, OH 45238
|
1,820 sq. feet
|
1 baths 3 beds |
show details | |

|
#23
Clarion Ave
Cincinnati, OH 45207
|
2,300 sq. feet
|
2 baths 6 beds |
show details | |

|
#24
Morado Dr
Cincinnati, OH 45238
|
1,146 sq. feet
|
1 baths 2 beds |
show details | |

|
#25
Grovedale Pl
Cincinnati, OH 45208
|
2,091 sq. feet
|
2 baths 3 beds |
show details | |

|
#26
Barberry Ave
Cincinnati, OH 45207
|
1,596 sq. feet
|
1 baths 3 beds |
show details | |

|
#27
Jonathan Ave
Cincinnati, OH 45207
|
1,661 sq. feet
|
1 baths 5 beds |
show details | |

|
#28
Scioto Dr
Cincinnati, OH 45244
|
1,224 sq. feet
|
1 baths 3 beds |
show details | |

|
#29
Picuda Ct
Cincinnati, OH 45238
|
972 sq. feet
|
1 baths 3 beds |
show details | |

|
#30
Downing Dr
Cincinnati, OH 45208
|
1,400 sq. feet
|
1 baths 4 beds |
show details |
| Photo | Address | Area | Beds / Baths | Price | Details |
|---|---|---|---|---|---|

|
#31
Olivia Ln
Cincinnati, OH 45238
|
2,381 sq. feet
|
2 baths 4 beds |
show details | |

|
#32
Cannon Gate Dr
Cincinnati, OH 45245
|
1,888 sq. feet
|
2 baths 4 beds |
show details | |

|
#33
Akochia Ave
Cincinnati, OH 45205
|
736 sq. feet
|
1 baths 2 beds |
show details | |

|
#34
Tammy Ct
Cincinnati, OH 45238
|
1,396 sq. feet
|
2 baths 3 beds |
show details | |

|
#35
Deer Run Dr
Burlington, KY 41005
|
1,728 sq. feet
|
2 baths 4 beds |
show details | |

|
#36
Dieckman Ln
Cincinnati, OH 45245
|
1,658 sq. feet
|
1 baths 2 beds |
show details | |

|
#37
Fawnhill Ln
Cincinnati, OH 45205
|
1,073 sq. feet
|
1 baths 3 beds |
show details | |

|
#38
Suncreek Ct
Cincinnati, OH 45238
|
1,444 sq. feet
|
1 baths 3 beds |
show details | |

|
#39
Stillmeadow Dr
Cincinnati, OH 45245
|
1,218 sq. feet
|
2 baths 3 beds |
show details | |

|
#40
Rockdale Ave
Cincinnati, OH 45229
|
1,907 sq. feet
|
2 baths 3 beds |
show details |
| Photo | Address | Area | Beds / Baths | Price | Details |
|---|---|---|---|---|---|

|
#41
Rapid Run Rd
Cincinnati, OH 45238
|
1,363 sq. feet
|
2 baths 4 beds |
show details | |

|
#42
Loda Dr
Cincinnati, OH 45245
|
1,100 sq. feet
|
1 baths 3 beds |
show details | |

|
#43
Dewey Ave # 2
Cincinnati, OH 45205
|
1,737 sq. feet
|
2 baths 3 beds |
show details | |

|
#44
Kenton Ct
Cincinnati, OH 45245
|
1,848 sq. feet
|
2 baths 4 beds |
show details | |

|
#45
Fehr Rd
Cincinnati, OH 45238
|
1,928 sq. feet
|
1 baths 2 beds |
show details | |

|
#46
Gilsey Ave
Cincinnati, OH 45205
|
1,596 sq. feet
|
1 baths 3 beds |
show details | |

|
#47
Claymore Ter
Cincinnati, OH 45238
|
1,232 sq. feet
|
1 baths 4 beds |
show details | |

|
#48
Whitmore Dr
Cincinnati, OH 45238
|
1,530 sq. feet
|
1 baths 3 beds |
show details | |

|
#49
Brierwood Ct
Florence, KY 41042
|
1,768 sq. feet
|
2 baths 4 beds |
show details | |

|
Check over 1 million property listings on Foreclosure.com!
|
browse all offers | |||


Median year apartment built: 1959
Household type by relationship:
Households: 894- Male householders: 161 (26 living alone), Female householders: 161 (31 living alone)
204 spouses (204 opposite-sex spouses), 24 unmarried partners, (24 opposite-sex unmarried partners), 260 children (239 natural, 0 adopted, 21 stepchildren), 17 grandchildren, 9 brothers or sisters, 10 parents, 0 foster children, 14 other relatives, 32 non-relatives
Size of family households: 140 2-persons, 47 3-persons, 46 4-persons, 14 5-persons, 9 6-persons, 5 7-or-more-persons.
Size of nonfamily households: 58 1-person, 2 2-persons.
87 married couples with children.
73 single-parent households (23 men, 50 women).
98.1% of residents of Ryland Heights speak English at home.
1.0% of residents speak Spanish at home (100% speak English very well).
0.7% of residents speak other Indo-European language at home (67% speak English very well, 33% speak English not well).
Foreign born population: 10 (1.1%)
(90.0% of them are naturalized citizens)
| Here: | 6.0 |
| State: | 6.4 |
| Here: | 4.5 |
| State: | 4.4 |

- Bedrooms in owner-occupied houses and condos in Ryland Heights, Kentucky
- 0no bedroom
- 51 bedroom
- 452 bedrooms
- 1673 bedrooms
- 524 bedrooms
- 05+ bedrooms

- Bedrooms in renter-occupied apartments in Ryland Heights, Kentucky
- 0no bedroom
- 91 bedroom
- 262 bedrooms
- 113 bedrooms
- 44 bedrooms
- 05+ bedrooms

- Cars and other vehicles available in Ryland Heights in owner-occupied houses/condos
- 12no vehicle
- 231 vehicle
- 1122 vehicles
- 673 vehicles
- 294 vehicles
- 255+ vehicles

- Cars and other vehicles available in Ryland Heights in renter-occupied apartments
- 2no vehicle
- 151 vehicle
- 72 vehicles
- 233 vehicles
- 04 vehicles
- 35+ vehicles

- Rooms in owner-occupied houses in Ryland Heights, Kentucky
- 01 room
- 22 rooms
- 23 rooms
- 184 rooms
- 405 rooms
- 886 rooms
- 627 rooms
- 228 rooms
- 349+ rooms

- Rooms in renter-occupied apartments in Ryland Heights, Kentucky
- 01 room
- 02 rooms
- 23 rooms
- 204 rooms
- 185 rooms
- 06 rooms
- 67 rooms
- 48 rooms
- 09+ rooms


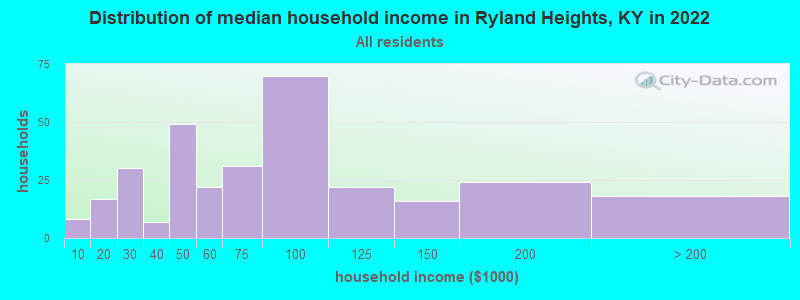
Ryland Heights, KY household income distribution

- 8Less than $10,000
- 17$10,000 to $19,999
- 30$20,000 to $29,999
- 7$30,000 to $39,999
- 49$40,000 to $49,999
- 22$50,000 to $59,999
- 31$60,000 to $74,999
- 70$75,000 to $99,999
- 22$100,000 to $124,999
- 16$125,000 to $149,999
- 24$150,000 to $199,999
- 18$200,000 or more
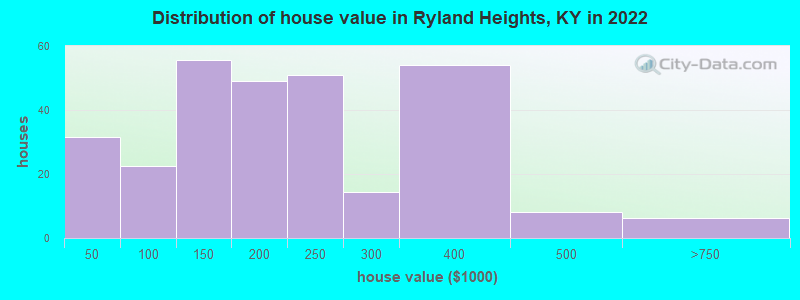
Home value of owner - occupied houses in 2022 in Ryland Heights, KY
-
- 3Less than $10,000
- 5$15,000 to $19,999
- 19$20,000 to $24,999
- 2$30,000 to $34,999
- 4$50,000 to $59,999
- 5$60,000 to $69,999
- 2$70,000 to $79,999
- 6$80,000 to $89,999
- 3$90,000 to $99,999
- 44$100,000 to $124,999
- 11$125,000 to $149,999
- 27$150,000 to $174,999
- 22$175,000 to $199,999
- 51$200,000 to $249,999
- 14$250,000 to $299,999
- 54$300,000 to $399,999
- 8$400,000 to $499,999
- 6$500,000 to $749,999
Rent paid by renters in 2022 in Ryland Heights, KY
-
- 1$450 to $499
- 2$600 to $649
- 6$700 to $749
- 1$800 to $899
- 10$900 to $999
- 6$1,000 to $1,249
- 24No cash rent


Percentage of workers working in this county: 60.6%
Number of people working at home: 54 (14.4% of all workers)
Travel time to work (commute)
- Less than 5 minutes: 5
- 5 to 9 minutes: 0
- 10 to 14 minutes: 30
- 15 to 19 minutes: 30
- 20 to 24 minutes: 69
- 25 to 29 minutes: 44
- 30 to 34 minutes: 101
- 35 to 39 minutes: 11
- 40 to 44 minutes: 3
- 45 to 59 minutes: 23
- 60 to 89 minutes: 0
- 90 or more minutes: 2
Means of transportation to work:
- Drove a car alone: 320 (83.8%)
- Carpooled: 47 (12.3%)
- Bus or trolley bus: 2 (0.5%)
- Other means: 3 (0.8%)
- Worked at home: 10 (2.6%)

- Unemployment by race in 2022
- Unemployment rate for White non-Hispanic residents
- 12.8%Males

- Year of entry for the foreign-born population in Ryland Heights, Kentucky
- 02010 or later
- 02000 to 2009
- 61990 to 1999
- 01980 to 1989
- 01970 to 1979
- 5Before 1970

First ancestries reported:
- American: 96 (24.3%)
- German: 81 (20.5%)
- English: 76 (19.2%)
- Irish: 33 (8.3%)
- European: 15 (3.8%)
- British: 9 (2.3%)
- Scotch-Irish: 9 (2.3%)
- Italian: 8 (2.0%)
- Austrian: 5 (1.3%)
- Scottish: 5 (1.3%)
- Finnish: 3 (0.8%)
- Welsh: 2 (0.5%)
Most common places of birth for foreign-born residents (%):
| Ryland Heights: | 27.3% (3) |
| Kentucky: | 0.0% (82) |
| Ryland Heights: | 27.3% (3) |
| Kentucky: | 3.7% (6,894) |
| Ryland Heights: | 27.3% (3) |
| Kentucky: | 2.5% (4,639) |
Place of birth for U.S.-born residents:
- This state: 642
- Other state: 232
- Northeast: 33
- Midwest: 160
- South: 33
- West: 0
94.0% of Ryland Heights residents lived in the same house 1 years ago.
Out of people who lived in different houses, 43.9% lived in this county.
Out of people who lived in different counties, 21.1% lived in Kentucky.
| Ryland Heights: | 94.0% |
| State average: | 87.2% |
Education attainment for males 25 years and older:
- No schooling: 0
- Nursery to 4th grade: 0
- 5th and 6th grade: 3
- 7th and 8th grade: 10
- 9th grade: 2
- 10th grade: 4
- 11th grade: 5
- 12th grade, no diploma: 1
- High school graduate (or equivalency): 170
- Less than 1 year of college: 25
- Some college more than 1 year, no degree: 29
- Associate degree: 9
- Bachelor's degree: 50
- Master's degree: 5
- Professional school degree: 0
- Doctorate degree: 2

Education attainment for females 25 years and older:
- No schooling: 0
- Nursery to 4th grade: 0
- 5th and 6th grade: 0
- 7th and 8th grade: 4
- 9th grade: 0
- 10th grade: 1
- 11th grade: 6
- 12th grade, no diploma: 1
- High school graduate (or equivalency): 151
- Less than 1 year of college: 41
- Some college more than 1 year, no degree: 44
- Associate degree: 22
- Bachelor's degree: 41
- Master's degree: 19
- Professional school degree: 1
- Doctorate degree: 0


Housing units in structures:
- One, detached: 301
- Two: 4
- Mobile homes: 52
Housing units lacking complete kitchen facilities in 2022: 2.5%
House/condo owner moved in on average 18 years ago
Renter moved in on average 7 years ago

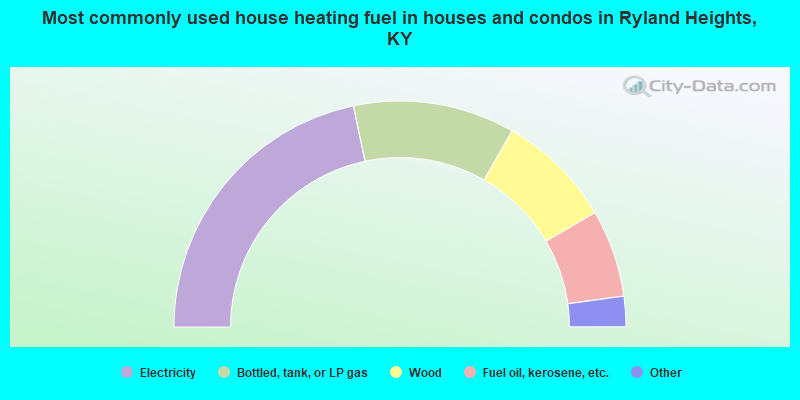
- 43.7%Electricity
- 23.3%Bottled, tank, or LP gas
- 16.7%Wood
- 12.6%Fuel oil, kerosene, etc.
- 2.2%Other fuel
- 1.5%Utility gas
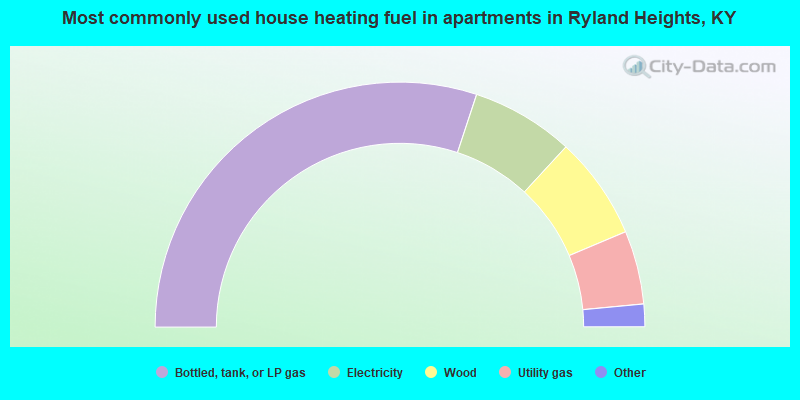
- 62.0%Bottled, tank, or LP gas
- 14.0%Electricity
- 14.0%Wood
- 10.0%Utility gas
Private vs. public school enrollment:
| Here: | 15.2% |
| Kentucky: | 17.2% |
| Here: | 38.6% |
| Kentucky: | 15.2% |
| Here: | 0.0% |
| Kentucky: | 19.6% |


