Housing density: 2,185 houses/condos per square mile
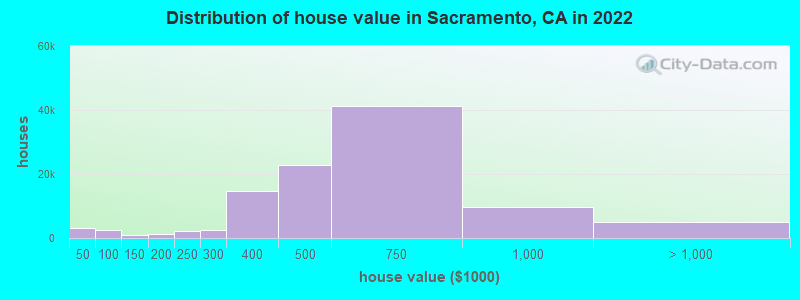
Median price asked for vacant for-sale houses and condos in 2022: $235,760.
Median contract rent in 2022: $1,473 (lower quartile is $1,104, upper quartile is $1,847)
Median rent asked for vacant for-rent units in 2022: $2,736
Median gross rent in Sacramento, CA in 2022: $1,650
Housing units in Sacramento with a mortgage: 73,172 (7,154 second mortgage, 274 home equity loan, 4,939 both second mortgage and home equity loan) Houses without a mortgage: 1,092
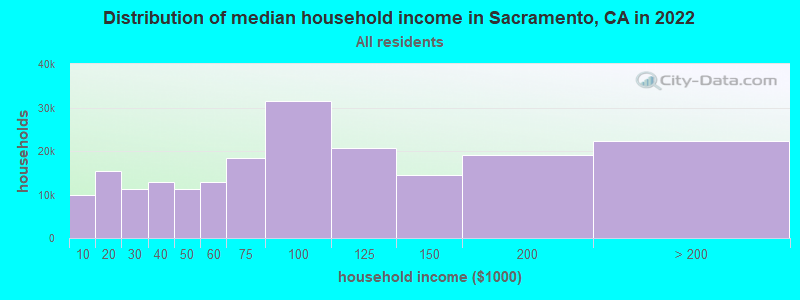
Median household income for houses/condos with a mortgage: $119,790
Median household income for apartments without a mortgage: $80,911
60,368 married couples with children.
34,480 single-parent households (14,258 men, 20,222 women).
62.7% of residents of Sacramento speak English at home.
18.0% of residents speak Spanish at home (63% speak English very well, 15% speak English well, 17% speak English not well, 5% don't speak English at all).
6.6% of residents speak other Indo-European language at home (67% speak English very well, 18% speak English well, 10% speak English not well, 5% don't speak English at all).
11.9% of residents speak Asian or Pacific Island language at home (50% speak English very well, 25% speak English well, 18% speak English not well, 7% don't speak English at all).
0.9% of residents speak other language at home (90% speak English very well, 3% speak English well, 7% speak English not well).
Foreign born population: 117,838 (22.3%)
(60.3% of them are naturalized citizens)
Percentage of workers working in this county: 85.5% Number of people working at home: 49,757 (19.4% of all workers)
Travel time to work (commute)
Less than 5 minutes: 3,806
5 to 9 minutes: 14,809
10 to 14 minutes: 32,466
15 to 19 minutes: 43,182
20 to 24 minutes: 37,315
25 to 29 minutes: 14,760
30 to 34 minutes: 29,882
35 to 39 minutes: 5,842
40 to 44 minutes: 6,416
45 to 59 minutes: 7,238
60 to 89 minutes: 5,028
90 or more minutes: 5,763
Means of transportation to work:
Drove a car alone: 239,155 (70.5%)
Carpooled: 30,422 (9.0%)
Bus: 3,420 (1.0%)
Subway or elevated rail: 201 (0.1%)
Long-distance train or commuter rail: 283 (0.1%)
Light rail, streetcar or trolley: 1,620 (0.5%)
Ferryboat: 120 (0.0%)
Taxi: 4,990 (1.5%)
Bicycle: 2,614 (0.8%)
Walked: 6,639 (2.0%)
Worked at home: 49,757 (14.7%)
Unemployment by race in 2022
Unemployment rate for White non-Hispanic residents
4.4%Males
3.6%Females
Unemployment rate for Black residents
7.3%Males
7.8%Females
Unemployment rate for American Indian and Alaska Native residents
7.5%Males
4.3%Females
Unemployment rate for Asian residents
6.8%Males
2.9%Females
Unemployment rate for other race residents
6.2%Males
3.9%Females
Unemployment rate for two or more race residents
7.0%Males
4.2%Females
Unemployment rate for Hispanic or Latino residents
5.2%Males
3.3%Females
Year of entry for the foreign-born population in Sacramento, California
31,8792010 or later
23,2322000 to 2009
26,9151990 to 1999
27,5151980 to 1989
11,1491970 to 1979
9,706Before 1970
First ancestries reported:
American: 9,760 (3.3%)
German: 7,539 (2.5%)
English: 6,608 (2.2%)
Irish: 6,129 (2.1%)
European: 4,775 (1.6%)
Italian: 4,510 (1.5%)
African: 2,257 (0.8%)
Ukrainian: 2,032 (0.7%)
Russian: 1,901 (0.6%)
Afghan: 1,412 (0.5%)
Norwegian: 1,390 (0.5%)
Polish: 1,382 (0.5%)
Scottish: 1,085 (0.4%)
Portuguese: 1,075 (0.4%)
Romanian: 875 (0.3%)
French: 834 (0.3%)
Swedish: 669 (0.2%)
Nigerian: 647 (0.2%)
Arab: 631 (0.2%)
Kenyan: 617 (0.2%)
Dutch: 604 (0.2%)
Slavic: 489 (0.2%)
Danish: 409 (0.1%)
Iranian: 399 (0.1%)
Yugoslavian: 393 (0.1%)
Eastern European: 387 (0.1%)
Greek: 383 (0.1%)
Northern European: 364 (0.1%)
Armenian: 351 (0.1%)
Scotch-Irish: 337 (0.1%)
British: 329 (0.1%)
French Canadian: 327 (0.1%)
Liberian: 325 (0.1%)
Jamaican: 314 (0.1%)
Ethiopian: 313 (0.1%)
Croatian: 303 (0.1%)
Brazilian: 302 (0.1%)
Hungarian: 292 (0.10%)
Ugandan: 281 (0.09%)
Syrian: 249 (0.08%)
Welsh: 235 (0.08%)
Czech: 214 (0.07%)
Slovak: 193 (0.07%)
Lithuanian: 192 (0.06%)
Trinidadian and Tobagonian: 191 (0.06%)
South African: 187 (0.06%)
Finnish: 183 (0.06%)
Canadian: 167 (0.06%)
Iraqi: 160 (0.05%)
Ghanaian: 134 (0.05%)
Haitian: 132 (0.04%)
Scandinavian: 122 (0.04%)
Egyptian: 121 (0.04%)
Lebanese: 117 (0.04%)
Bulgarian: 112 (0.04%)
Jordanian: 111 (0.04%)
Palestinian: 104 (0.04%)
Estonian: 102 (0.03%)
Basque: 101 (0.03%)
Australian: 100 (0.03%)
Austrian: 94 (0.03%)
Swiss: 89 (0.03%)
Cape Verdean: 79 (0.03%)
West Indian: 68 (0.02%)
Israeli: 61 (0.02%)
Czechoslovakian: 61 (0.02%)
Turkish: 56 (0.02%)
Belgian: 49 (0.02%)
Moroccan: 44 (0.01%)
Maltese: 42 (0.01%)
Luxembourger: 36 (0.01%)
Celtic: 36 (0.01%)
Pennsylvania German: 35 (0.01%)
Macedonian: 33 (0.01%)
Belizean: 30 (0.01%)
Cajun: 21 (0.01%)
Serbian: 17 (0.01%)
Bermudan: 17 (0.01%)
Slovene: 16 (0.01%)
German Russian: 15 (0.01%)
Most common places of birth for foreign-born residents (%):
Mexico
Sacramento:
26.6% (29,644)
California:
37.2% (3,881,193)
India
Sacramento:
7.7% (8,543)
California:
5.2% (539,184)
Philippines
Sacramento:
7.6% (8,481)
California:
7.8% (818,297)
China, excluding Hong Kong and Taiwan
Sacramento:
7.4% (8,208)
California:
6.6% (684,672)
Vietnam
Sacramento:
6.8% (7,527)
California:
4.9% (512,335)
Laos
Sacramento:
5.2% (5,768)
California:
0.5% (48,911)
Fiji
Sacramento:
5.1% (5,666)
California:
0.3% (33,937)
Thailand
Sacramento:
2.4% (2,714)
California:
0.6% (65,335)
Afghanistan
Sacramento:
2.3% (2,537)
California:
0.5% (53,260)
Pakistan
Sacramento:
1.9% (2,132)
California:
0.5% (49,399)
El Salvador
Sacramento:
1.7% (1,919)
California:
4.2% (440,287)
Ukraine
Sacramento:
1.5% (1,703)
California:
0.6% (60,761)
Hong Kong
Sacramento:
1.5% (1,695)
California:
1.0% (105,215)
Place of birth for U.S.-born residents:
This state: 325,904
Other state: 75,311
Northeast: 11,625
Midwest: 17,562
South: 26,337
West: 19,787
87.3% of Sacramento residents lived in the same house 1 years ago. Out of people who lived in different houses, 35.9% lived in this county. Out of people who lived in different counties, 79.8% lived in California.
Sacramento:
87.3%
State average:
88.9%
Education attainment for males 25 years and older:
No schooling: 6,165
Nursery to 4th grade: 1,017
5th and 6th grade: 2,673
7th and 8th grade: 1,156
9th grade: 1,267
10th grade: 1,097
11th grade: 1,813
12th grade, no diploma: 5,452
High school graduate (or equivalency): 38,031
Less than 1 year of college: 11,568
Some college more than 1 year, no degree: 28,552
Associate degree: 15,144
Bachelor's degree: 40,940
Master's degree: 13,165
Professional school degree: 5,851
Doctorate degree: 2,561
Education attainment for females 25 years and older:
No schooling: 7,357
Nursery to 4th grade: 782
5th and 6th grade: 3,279
7th and 8th grade: 1,595
9th grade: 1,962
10th grade: 1,549
11th grade: 1,759
12th grade, no diploma: 4,521
High school graduate (or equivalency): 35,937
Less than 1 year of college: 13,843
Some college more than 1 year, no degree: 26,781
Associate degree: 15,595
Bachelor's degree: 42,688
Master's degree: 19,400
Professional school degree: 5,617
Doctorate degree: 3,648
Housing units in structures:
One, detached: 124,851
One, attached: 16,255
Two: 5,249
3 or 4: 11,626
5 to 9: 18,156
10 to 19: 9,081
20 to 49: 8,249
50 or more: 14,716
Mobile homes: 3,843
Boats, RVs, vans, etc.: 234
Median worth of mobile homes: $107,100
Housing units lacking complete plumbing facilities in 2022: 0.4%
Housing units lacking complete kitchen facilities in 2022: 1.3%
House/condo owner moved in on average 10 years ago