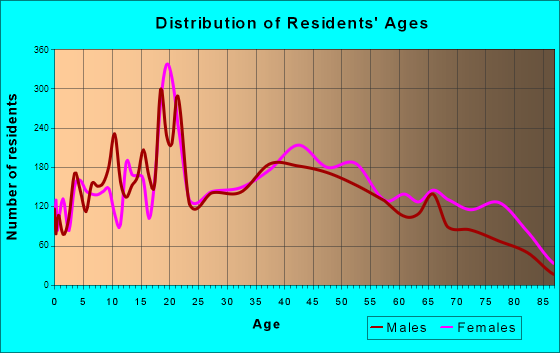
Salem, VA (Virginia) Houses and Residents
Estimated median house or condo value in 2022: $253,411 (it was $99,200 in 2000 )
Salem:
$253,411Virginia:
$365,700
Lower value quartile - upper value quartile: $180,874 - $351,596Total population: 25,483 (Urban population: 24,747, Rural population: 0)
Houses: 11,159 (10,102 occupied: 6,568 owner occupied, 3,699 renter occupied )
% of renters here:
36%State:
33%
Housing density: 765 houses/condos per square mile
Median price asked for vacant for-sale houses and condos in 2022: $309,052.
Median contract rent in 2022: $845 (lower quartile is $699, upper quartile is $1,027)
Median rent asked for vacant for-rent units in 2022: $2,574
Median gross rent in Salem, VA in 2022: $1,083
Housing units in Salem with a mortgage: 3,688 (463 second mortgage, 0 home equity loan, 410 both second mortgage and home equity loan )Houses without a mortgage: 161
Median household income for houses/condos with a mortgage: $98,139
Median household income for apartments without a mortgage: $65,613
Median monthly housing costs: $1,000
Data:
Median house or condo value ($)
Median house or condo value ($ change since 2000)
Median house or condo value ($) - White
Median house or condo value ($) - Black or African American
Median house or condo value ($) - Asian
Median house or condo value ($) - Hispanic or Latino
Median house or condo value ($) - American Indian and Alaska Native
Median house or condo value ($) - Multirace
Median house or condo value ($) - Other Race
Median price asked for mobile homes ($)
Household density (households per square mile)
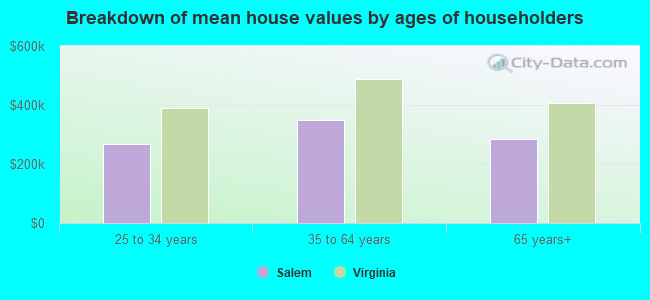
Mean house or condo value by units in structure - 1, detached ($)
Mean house or condo value by units in structure - 1, attached ($)
Mean house or condo value by units in structure - 2 ($)
Mean house or condo value by units in structure by units in structure - 3 or 4 ($)
Mean house or condo value by units in structure - 5 or more ($)
Mean house or condo value by units in structure - Boat, RV, van, etc. ($)
Mean house or condo value by units in structure - Mobile home ($)
Median contract rent ($)
Median contract rent - Lower quartile ($)
Median contract rent - Upper quartile ($)
Median gross rent ($)
Urban houses (%)
Rural houses (%)
Houses occupied (%)
Houses occupied (% change since 2000)
Houses owner occupied (%)
Houses owner occupied (% change since 2000)
Houses renter occupied (%)
Houses renter occupied (% change since 2000)
Vacant housing units - For rent (%)
Vacant housing units - For rent (% change since 2000)
Vacant housing units - For sale only (%)
Vacant housing units - For sale only (% change since 2000)
Vacant housing units - Rented or sold, not occupied (%)
Vacant housing units - Rented or sold, not occupied (% change since 2000)
Vacant housing units - For seasonal, recreational, or occasional use (%)
Vacant housing units - For seasonal, recreational, or occasional use (% change since 2000)
Vacant housing units - For migrant workers (%)
Vacant housing units - For migrant workers (% change since 2000)
Vacant housing units - Other vacant (%)
Vacant housing units - Other vacant (% change since 2000)
Median monthly housing costs ($)
Median household income for houses/condos with a mortgage ($)
Median household income for houses/condos without a mortgage ($)
Median household income ($)
Median household income ($) - White
Median household income ($) - Black or African American
Median household income ($) - Asian
Median household income ($) - Hispanic or Latino
Median household income ($) - American Indian and Alaska Native
Median household income ($) - Multirace
Median household income ($) - Other Race
Mortgage status - with mortgage (%)
Mortgage status - with second mortgage (%)
Mortgage status - with home equity loan (%)
Mortgage status - with both second mortgage and home equity loan (%)
Mortgage status - without a mortgage (%)
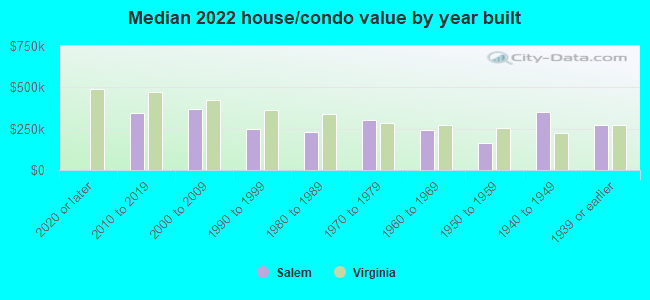
Median year house/condo built
Median year apartment built
Household type by relationship - Male householder living alone (%)
Household type by relationship - Male householder not living alone (%)
Household type by relationship - Female householder living alone (%)
Household type by relationship - Female householder not living alone (%)
Household type by relationship - Opposite-Sex spouse (%)
Household type by relationship - Same-Sex spouse (%)
Household type by relationship - Opposite-Sex unmarried partner (%)
Household type by relationship - Same-Sex unmarried partner (%)
Household type by relationship - In group quarters (%)
Size of family households - 2-person household (%)
Size of family households - 3-person household (%)
Size of family households - 4-person household (%)
Size of family households - 5-person household (%)
Size of family households - 6-person household (%)
Size of family households - 7-or-more-person household (%)
Size of nonfamily households - 1-person household (%)
Size of nonfamily households - 2-person household (%)
Size of nonfamily households - 3-person household (%)
Size of nonfamily households - 4-person household (%)
Size of nonfamily households - 5-person household (%)
Size of nonfamily households - 6-person household (%)
Size of nonfamily households - 7-or-moreperson household (%)
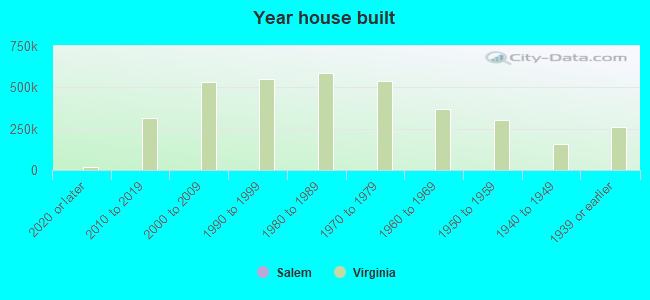
Year house built - Built 2010 or later (%)
Year house built - Built 2000 to 2009 (%)
Year house built - Built 1990 to 1999 (%)
Year house built - Built 1980 to 1989 (%)
Year house built - Built 1970 to 1979 (%)
Year house built - Built 1960 to 1969 (%)
Year house built - Built 1950 to 1959 (%)
Year house built - Built 1940 to 1949 (%)
Year house built - Built 1939 or earlier (%)
Median number of rooms in houses and condos
Median number of rooms in apartments
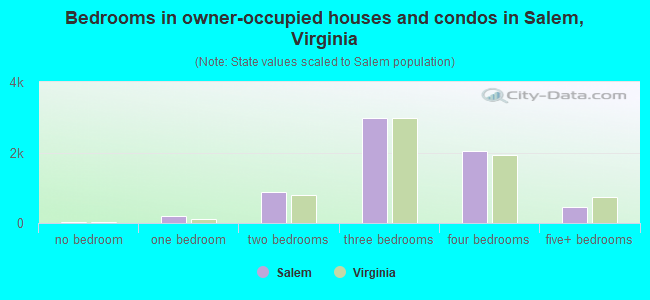
Median number of bedrooms in owner occupied houses
Mean number of bedrooms in owner occupied houses
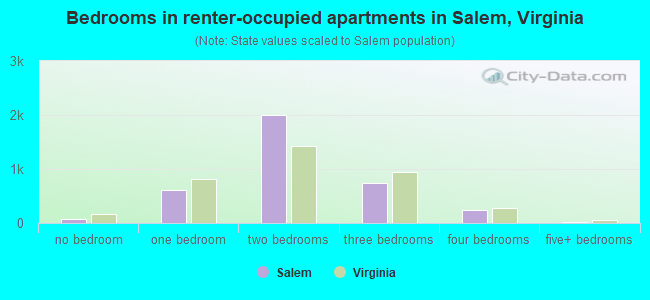
Median number of bedrooms in renter occupied houses
Mean number of bedrooms in renter occupied houses
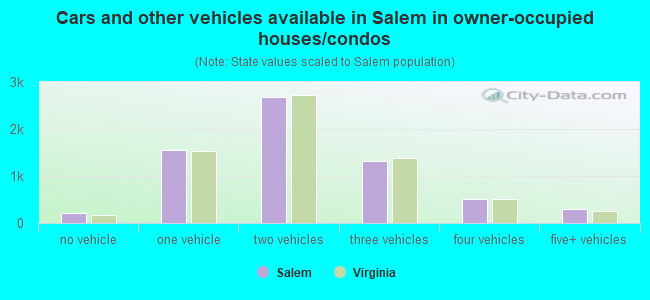
Median number of vehichles in owner occupied houses
Mean number of vehichles in owner occupied houses
Median number of vehichles in renter occupied houses
Mean number of vehichles in renter occupied houses
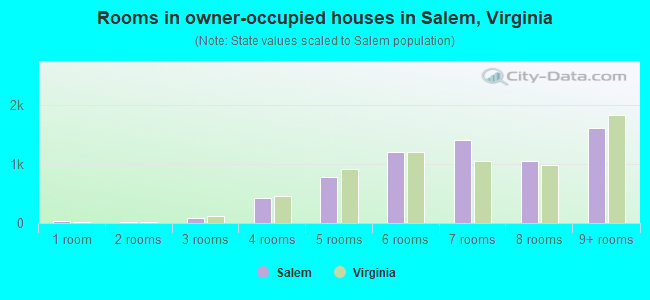
Rooms in owner-occupied houses - 1 room (%)
Rooms in owner-occupied houses - 2 rooms (%)
Rooms in owner-occupied houses - 3 rooms (%)
Rooms in owner-occupied houses - 4 rooms (%)
Rooms in owner-occupied houses - 5 rooms (%)
Rooms in owner-occupied houses - 6 rooms (%)
Rooms in owner-occupied houses - 7 rooms (%)
Rooms in owner-occupied houses - 8 rooms (%)
Rooms in owner-occupied houses - 9+ rooms (%)
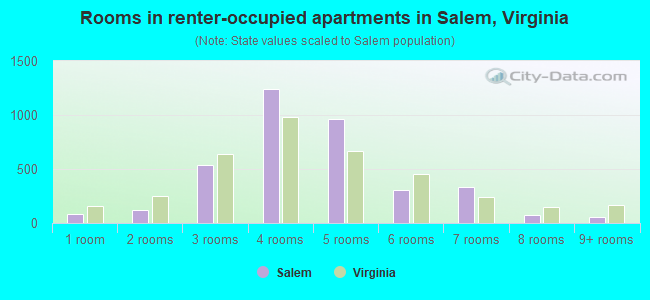
Rooms in renter-occupied houses - 1 room (%)
Rooms in renter-occupied houses - 2 rooms (%)
Rooms in renter-occupied houses - 3 rooms (%)
Rooms in renter-occupied houses - 4 rooms (%)
Rooms in renter-occupied houses - 5 rooms (%)
Rooms in renter-occupied houses - 6 rooms (%)
Rooms in renter-occupied houses - 7 rooms (%)
Rooms in renter-occupied houses - 8 rooms (%)
Rooms in renter-occupied houses - 9+ rooms (%)
Bedrooms in owner-occupied houses - no bedrooms (%)
Bedrooms in owner-occupied houses - 1 bedroom (%)
Bedrooms in owner-occupied houses - 2 bedrooms (%)
Bedrooms in owner-occupied houses - 3 bedrooms (%)
Bedrooms in owner-occupied houses - 4 bedrooms (%)
Bedrooms in owner-occupied houses - 5+ bedrooms (%)
Bedrooms in renter-occupied houses - no bedrooms (%)
Bedrooms in renter-occupied houses - 1 bedroom (%)
Bedrooms in renter-occupied houses - 2 bedrooms (%)
Bedrooms in renter-occupied houses - 3 bedrooms (%)
Bedrooms in renter-occupied houses - 4 bedrooms (%)
Bedrooms in renter-occupied houses - 5+ bedrooms (%)
Vehicles available in owner-occupied houses - no vehicle available (%)
Vehicles available in owner-occupied houses - 1 vehicle available(%)
Vehicles available in owner-occupied houses - 2 Vehicles available (%)
Vehicles available in owner-occupied houses - 3 Vehicles available (%)
Vehicles available in owner-occupied houses - 4 Vehicles available (%)
Vehicles available in owner-occupied houses - 5+ Vehicles available (%)
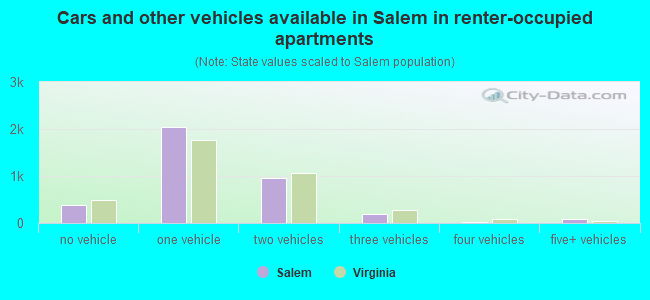
Vehicles available in renter-occupied houses - no vehicle available (%)
Vehicles available in renter-occupied houses - 1 vehicle available (%)
Vehicles available in renter-occupied houses - 2 Vehicles available (%)
Vehicles available in renter-occupied houses - 3 Vehicles available (%)
Vehicles available in renter-occupied houses - 4 Vehicles available (%)
Vehicles available in renter-occupied houses - 5+ Vehicles available (%)
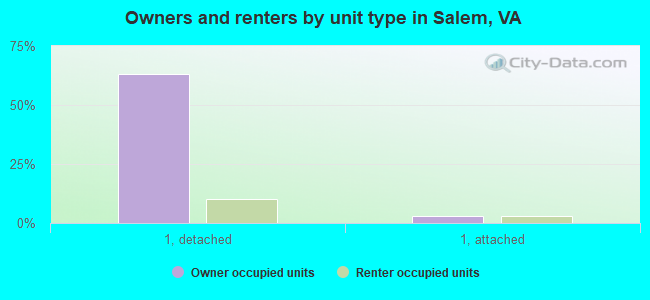
Housing units in structures - 1, detached (%)
Housing units in structures - 1, attached (%)
Housing units in structures - 2 (%)
Housing units in structures - 3 or 4 (%)
Housing units in structures - 5 to 9 (%)
Housing units in structures - 10 to 19 (%)
Housing units in structures - 20 to 49 (%)
Housing units in structures - 50 or more (%)
Housing units in structures - Mobile home (%)
Housing units in structures - Boat, RV, van, etc. (%)
Housing units in structures - Owners - 1, detached (%)
Housing units in structures - Owners - 1, attached (%)
Housing units in structures - Owners - 2 (%)
Housing units in structures - Owners - 3 or 4 (%)
Housing units in structures - Owners - 5 to 9 (%)
Housing units in structures - Owners - 10 to 19 (%)
Housing units in structures - Owners - 20 to 49 (%)
Housing units in structures - Owners - 50 or more (%)
Housing units in structures - Owners - Mobile home (%)
Housing units in structures - Owners - Boat, RV, van, etc. (%)
Housing units in structures - Renters - 1, detached (%)
Housing units in structures - Renters - 1, attached (%)
Housing units in structures - Renters - 2 (%)
Housing units in structures - Renters - 3 or 4 (%)
Housing units in structures - Renters - 5 to 9 (%)
Housing units in structures - Renters - 10 to 19 (%)
Housing units in structures - Renters - 20 to 49 (%)
Housing units in structures - Renters - 50 or more (%)
Housing units in structures - Renters - Mobile home (%)
Housing units in structures - Renters - Boat, RV, van, etc. (%)
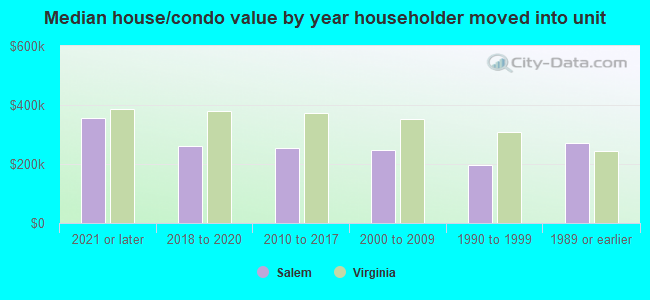
House/condo owner moved in on average (years ago)
Renter moved in on average (years ago)
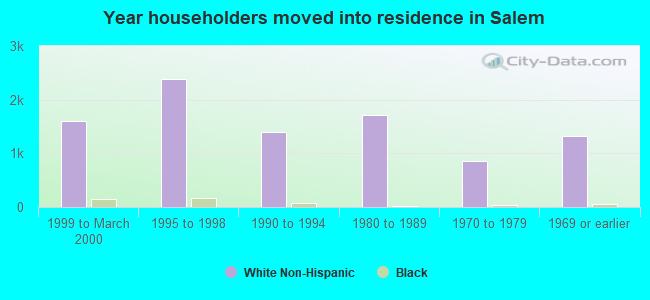
Year householder moved into unit - Moved in 1999 to March 2000 (%)
Year householder moved into unit - Moved in 1999 to March 2000 (%) - White
Year householder moved into unit - Moved in 1999 to March 2000 (%) - Black or African American
Year householder moved into unit - Moved in 1999 to March 2000 (%) - Asian
Year householder moved into unit - Moved in 1999 to March 2000 (%) - Hispanic or Latino
Year householder moved into unit - Moved in 1999 to March 2000 (%) - American Indian and Alaska Native
Year householder moved into unit - Moved in 1999 to March 2000 (%) - Multirace
Year householder moved into unit - Moved in 1999 to March 2000 (%) - Other Race
Year householder moved into unit - Moved in 1995 to 1998 (%)
Year householder moved into unit - Moved in 1995 to 1998 (%) - White
Year householder moved into unit - Moved in 1995 to 1998 (%) - Black or African American
Year householder moved into unit - Moved in 1995 to 1998 (%) - Asian
Year householder moved into unit - Moved in 1995 to 1998 (%) - Hispanic or Latino
Year householder moved into unit - Moved in 1995 to 1998 (%) - American Indian and Alaska Native
Year householder moved into unit - Moved in 1995 to 1998 (%) - Multirace
Year householder moved into unit - Moved in 1995 to 1998 (%) - Other Race
Year householder moved into unit - Moved in 1990 to 1994 (%)
Year householder moved into unit - Moved in 1990 to 1994 (%) - White
Year householder moved into unit - Moved in 1990 to 1994 (%) - Black or African American
Year householder moved into unit - Moved in 1990 to 1994 (%) - Asian
Year householder moved into unit - Moved in 1990 to 1994 (%) - Hispanic or Latino
Year householder moved into unit - Moved in 1990 to 1994 (%) - American Indian and Alaska Native
Year householder moved into unit - Moved in 1990 to 1994 (%) - Multirace
Year householder moved into unit - Moved in 1990 to 1994 (%) - Other Race
Year householder moved into unit - Moved in 1980 to 1989 (%)
Year householder moved into unit - Moved in 1980 to 1989 (%) - White
Year householder moved into unit - Moved in 1980 to 1989 (%) - Black or African American
Year householder moved into unit - Moved in 1980 to 1989 (%) - Asian
Year householder moved into unit - Moved in 1980 to 1989 (%) - Hispanic or Latino
Year householder moved into unit - Moved in 1980 to 1989 (%) - American Indian and Alaska Native
Year householder moved into unit - Moved in 1980 to 1989 (%) - Multirace
Year householder moved into unit - Moved in 1980 to 1989 (%) - Other Race
Year householder moved into unit - Moved in 1970 to 1979 (%)
Year householder moved into unit - Moved in 1970 to 1979 (%) - White
Year householder moved into unit - Moved in 1970 to 1979 (%) - Black or African American
Year householder moved into unit - Moved in 1970 to 1979 (%) - Asian
Year householder moved into unit - Moved in 1970 to 1979 (%) - Hispanic or Latino
Year householder moved into unit - Moved in 1970 to 1979 (%) - American Indian and Alaska Native
Year householder moved into unit - Moved in 1970 to 1979 (%) - Multirace
Year householder moved into unit - Moved in 1970 to 1979 (%) - Other Race
Year householder moved into unit - Moved in 1969 or earlier (%)
Year householder moved into unit - Moved in 1969 or earlier (%) - White
Year householder moved into unit - Moved in 1969 or earlier (%) - Black or African American
Year householder moved into unit - Moved in 1969 or earlier (%) - Asian
Year householder moved into unit - Moved in 1969 or earlier (%) - Hispanic or Latino
Year householder moved into unit - Moved in 1969 or earlier (%) - American Indian and Alaska Native
Year householder moved into unit - Moved in 1969 or earlier (%) - Multirace
Year householder moved into unit - Moved in 1969 or earlier (%) - Other Race
Housing units lacking complete plumbing facilities (%)
Housing units lacking complete kitchen facilities (%)
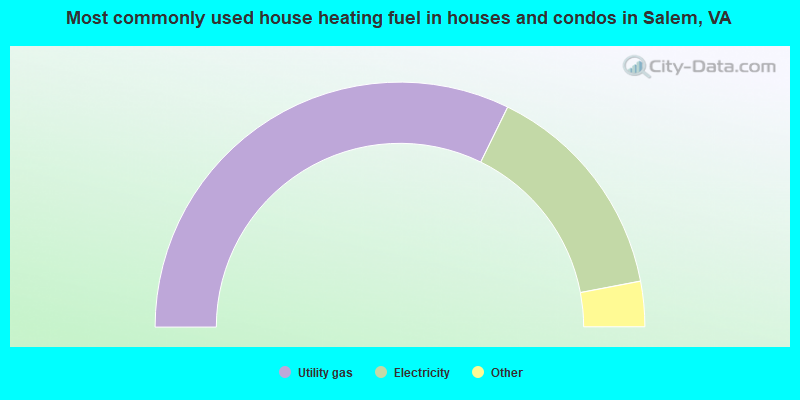
House heating fuel used in houses and condos - Utility gas (%)
House heating fuel used in houses and condos - Bottled, tank, or LP gas (%)
House heating fuel used in houses and condos - Electricity (%)
House heating fuel used in houses and condos - Fuel oil, kerosene, etc. (%)
House heating fuel used in houses and condos - Coal or coke (%)
House heating fuel used in houses and condos - Wood (%)
House heating fuel used in houses and condos - Solar energy (%)
House heating fuel used in houses and condos - Other fuel (%)
House heating fuel used in houses and condos - No fuel used (%)
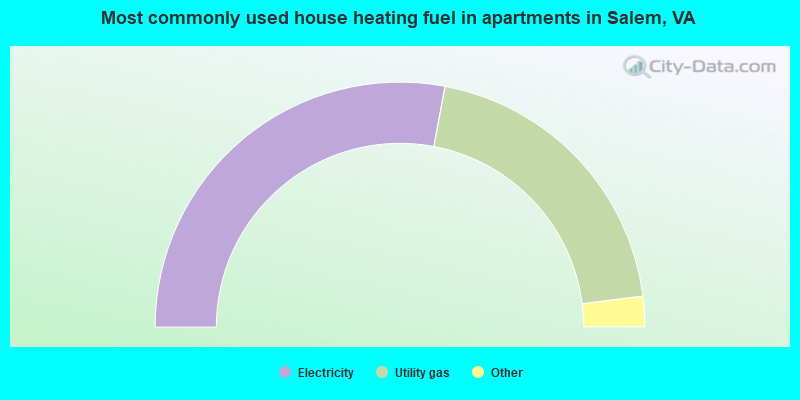
House heating fuel used in apartments - Utility gas (%)
House heating fuel used in apartments - Bottled, tank, or LP gas (%)
House heating fuel used in apartments - Electricity (%)
House heating fuel used in apartments - Fuel oil, kerosene, etc. (%)
House heating fuel used in apartments - Coal or coke (%)
House heating fuel used in apartments - Wood (%)
House heating fuel used in apartments - Solar energy (%)
House heating fuel used in apartments - Other fuel (%)
House heating fuel used in apartments - No fuel used (%)
Latest news about housing in Salem, VA collected exclusively by city-data.com from local newspapers, TV, and radio stations
Median year house/condo built: 1972Median year apartment built: 1972Household type by relationship:
Households: 25,440
Male householders: 4,591 (1,339 living alone ), Female householders: 5,480 (1,706 living alone )4,441 spouses (4,381 opposite-sex spouses ), 882 unmarried partners , (858 opposite-sex unmarried partners ), 5,303 children (4,943 natural , 126 adopted , 233 stepchildren ), 786 grandchildren , 270 brothers or sisters , 163 parents , 8 foster children , 139 other relatives , 723 non-relatives In group quarters: 2,649
Size of family households: 3,470 2-persons , 1,440 3-persons , 900 4-persons , 411 5-persons , 71 6-persons , 100 7-or-more-persons .
Size of nonfamily households: 2,987 1-person , 717 2-persons , 170 3-persons .
2,692 married couples with children. single-parent households (717 men , 526 women ).
94.8% of residents of Salem speak English at home. of residents speak Spanish at home (67% speak English very well , 13% speak English well , 19% speak English not well , 1% don't speak English at all ).of residents speak other Indo-European language at home (76% speak English very well , 20% speak English well , 2% speak English not well , 2% don't speak English at all ).of residents speak Asian or Pacific Island language at home (100% speak English very well ).of residents speak other language at home (57% speak English very well , 18% speak English well , 21% speak English not well , 4% don't speak English at all ).
Foreign born population: 1,180 (4.6%)of them are naturalized citizens )
Median number of rooms in houses and condos:
Median number of rooms in apartments
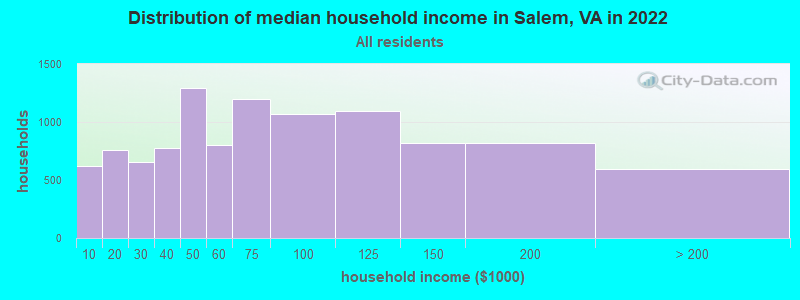
Salem, VA household income distribution 618 Less than $10,000760 $10,000 to $19,999651 $20,000 to $29,999774 $30,000 to $39,9991,291 $40,000 to $49,999805 $50,000 to $59,9991,198 $60,000 to $74,9991,072 $75,000 to $99,9991,096 $100,000 to $124,999815 $125,000 to $149,999816 $150,000 to $199,999596 $200,000 or more
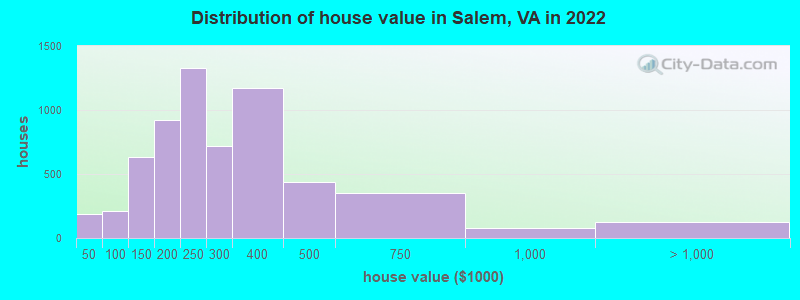
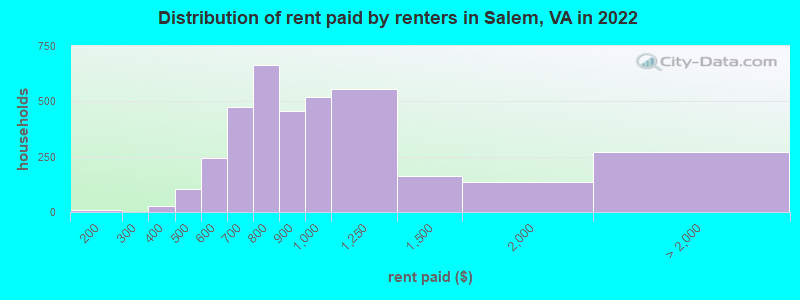
Home value of owner - occupied houses in 2022 in Salem, VA 37 Less than $10,00050 $10,000 to $14,99945 $15,000 to $19,99910 $20,000 to $24,99915 $25,000 to $29,99926 $30,000 to $34,99931 $50,000 to $59,99920 $60,000 to $69,9999 $70,000 to $79,99966 $80,000 to $89,99984 $90,000 to $99,999259 $100,000 to $124,999377 $125,000 to $149,999599 $150,000 to $174,999323 $175,000 to $199,9991,330 $200,000 to $249,999722 $250,000 to $299,9991,170 $300,000 to $399,999437 $400,000 to $499,999353 $500,000 to $749,99979 $750,000 to $999,99971 $1,000,000 to $1,499,99953 $2,000,000 or moreRent paid by renters in 2022 in Salem, VA 10 $100 to $14910 $300 to $34914 $350 to $39969 $400 to $44932 $450 to $499168 $500 to $54973 $550 to $599311 $600 to $649164 $650 to $699376 $700 to $749285 $750 to $799455 $800 to $899520 $900 to $999556 $1,000 to $1,249163 $1,250 to $1,499133 $1,500 to $1,99976 $2,000 to $2,49911 $3,000 to $3,49927 $3,500 or more154 No cash rent
Percentage of workers working in this county: 56.1%Number of people working at home: 1,388 (11.1% of all workers )
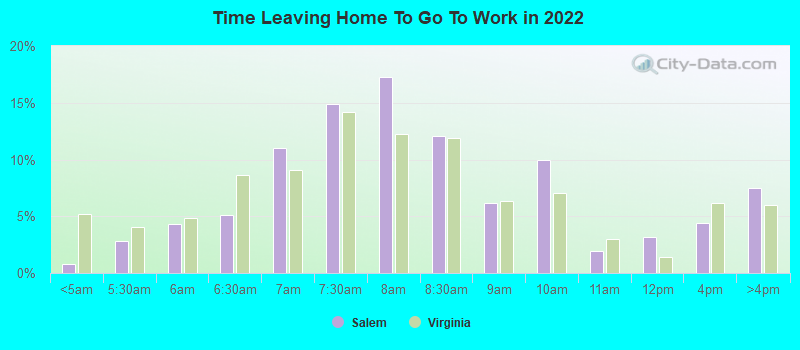
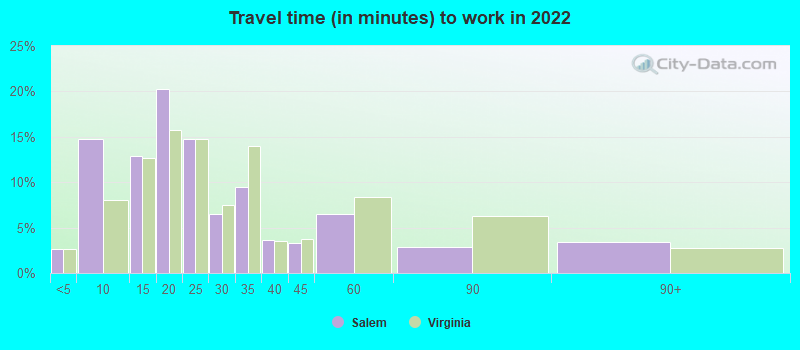
Travel time to work (commute)
Less than 5 minutes: 3485 to 9 minutes: 1,80810 to 14 minutes: 2,03615 to 19 minutes: 1,93120 to 24 minutes: 1,94725 to 29 minutes: 1,09230 to 34 minutes: 77835 to 39 minutes: 14540 to 44 minutes: 14245 to 59 minutes: 24660 to 89 minutes: 20690 or more minutes: 213
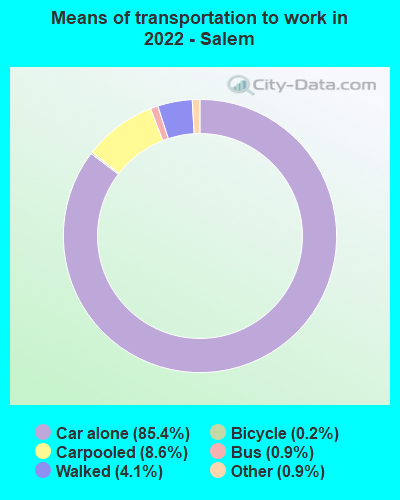
Means of transportation to work:
Drove a car alone: 17,128 (77.4%)Carpooled: 1,743 (7.9%)Bus : 122 (0.6%)Taxi: 216 (1.0%)Bicycle: 37 (0.2%)Walked: 888 (4.0%)Worked at home: 1,388 (6.3%)
Unemployment by race in 2022
Unemployment rate for White non-Hispanic residents 1.2% Males4.1% FemalesUnemployment rate for Black residents 8.6% Males9.3% FemalesUnemployment rate for American Indian and Alaska Native residents 100.0% FemalesUnemployment rate for Asian residents 8.2% FemalesUnemployment rate for two or more race residents 10.7% Males3.0% FemalesUnemployment rate for Hispanic or Latino residents 9.6% Males
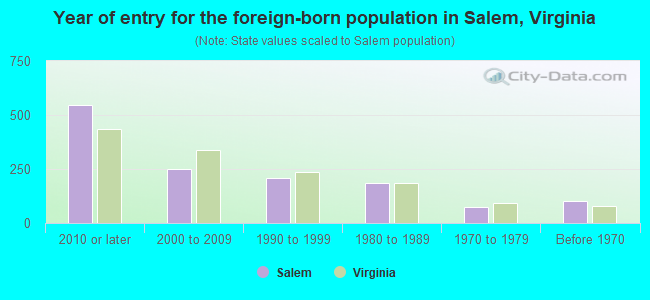
Year of entry for the foreign-born population in Salem, Virginia
545 2010 or later 249 2000 to 2009 209 1990 to 1999 184 1980 to 1989 74 1970 to 1979 102 Before 1970
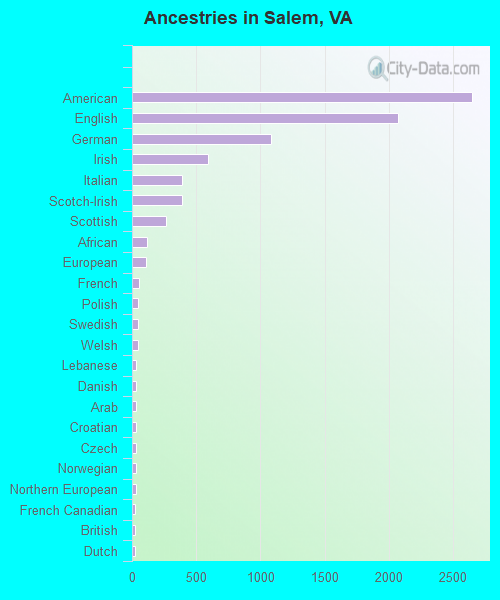
First ancestries reported:
American: 2,649 (22.6%)
English: 2,071 (17.6%)
German: 1,085 (9.2%)
Irish: 589 (5.0%)
Italian: 391 (3.3%)
Scotch-Irish: 387 (3.3%)
Scottish: 265 (2.3%)
African: 120 (1.0%)
European: 109 (0.9%)
French: 58 (0.5%)
Polish: 48 (0.4%)
Swedish: 48 (0.4%)
Welsh: 43 (0.4%)
Lebanese: 32 (0.3%)
Danish: 32 (0.3%)
Arab: 30 (0.3%)
Croatian: 30 (0.3%)
Czech: 29 (0.2%)
Norwegian: 29 (0.2%)
Northern European: 28 (0.2%)
French Canadian: 27 (0.2%)
British: 25 (0.2%)
Dutch: 25 (0.2%)
Swiss: 19 (0.2%)
Ukrainian: 19 (0.2%)
Haitian: 19 (0.2%)
Jamaican: 18 (0.2%)
Hungarian: 15 (0.1%)
Lithuanian: 14 (0.1%)
Romanian: 12 (0.1%)
Australian: 12 (0.1%)
Eastern European: 10 (0.09%)
Cajun: 9 (0.08%)
Austrian: 9 (0.08%)
Greek: 8 (0.07%)
Slovak: 6 (0.05%)
Ghanaian: 6 (0.05%)
Trinidadian and Tobagonian: 5 (0.04%)
Russian: 4 (0.03%) Most common places of birth for foreign-born residents (%): China, excluding Hong Kong and Taiwan Salem:
13.2% (141)Virginia:
3.9% (42,989)
Philippines Salem:
9.6% (103)Virginia:
4.8% (52,629)
Mexico Salem:
9.2% (98)Virginia:
5.3% (57,498)
Germany Salem:
7.3% (78)Virginia:
1.7% (18,227)
Honduras Salem:
6.8% (73)Virginia:
3.0% (32,892)
South Africa Salem:
5.6% (60)Virginia:
0.3% (2,829)
India Salem:
4.8% (51)Virginia:
9.0% (97,830)
England Salem:
2.9% (31)Virginia:
0.9% (9,842)
Asia, n.e.c. Salem:
2.9% (31)Virginia:
0.2% (1,681)
Bosnia and Herzegovina Salem:
2.8% (30)Virginia:
0.2% (2,176)
Saudi Arabia Salem:
2.3% (25)Virginia:
0.3% (3,713)
Venezuela Salem:
2.3% (25)Virginia:
0.8% (8,186)
Brazil Salem:
2.2% (23)Virginia:
0.7% (8,081)
Canada Salem:
1.8% (19)Virginia:
1.2% (12,984)
United Kingdom, excluding England and Scotland Salem:
1.8% (19)Virginia:
0.8% (8,513)
Malaysia Salem:
1.7% (18)Virginia:
0.2% (1,776)
Denmark Salem:
1.6% (17)Virginia:
0.1% (805)
Jamaica Salem:
1.6% (17)Virginia:
1.0% (10,734)
Place of birth for U.S.-born residents:
This state: 16,440Other state: 7,520Northeast: 1,809Midwest: 1,066South: 3,683West: 891 87.1% of Salem residents lived in the same house 1 years ago.
Out of people who lived in different houses, 14.6% lived in this county.
Out of people who lived in different counties, 87.4% lived in Virginia.
Salem:
87.1%State average:
86.6%
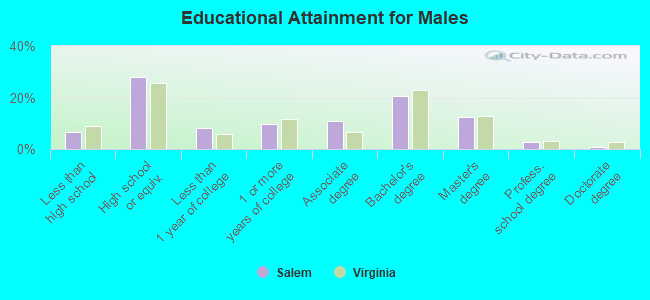
Education attainment for males 25 years and older:
No schooling: 57Nursery to 4th grade: 05th and 6th grade: 97th and 8th grade: 349th grade: 6010th grade: 13911th grade: 14512th grade, no diploma: 87High school graduate (or equivalency): 2,195Less than 1 year of college: 647Some college more than 1 year, no degree: 752Associate degree: 854Bachelor's degree: 1,610Master's degree: 972Professional school degree: 220Doctorate degree: 59
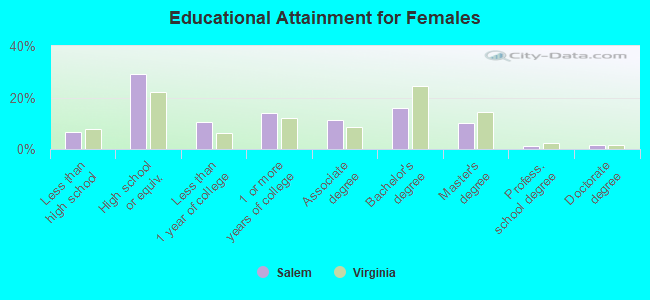
Education attainment for females 25 years and older:
No schooling: 78Nursery to 4th grade: 405th and 6th grade: 167th and 8th grade: 1329th grade: 1910th grade: 2411th grade: 18112th grade, no diploma: 102High school graduate (or equivalency): 2,673Less than 1 year of college: 977Some college more than 1 year, no degree: 1,279Associate degree: 1,020Bachelor's degree: 1,458Master's degree: 945Professional school degree: 100Doctorate degree: 151
Housing units in structures:
One, detached: 7,959One, attached: 469Two: 4073 or 4: 2815 to 9: 41810 to 19: 1,03520 to 49: 17750 or more: 167Mobile homes: 218Boats, RVs, vans, etc.: 24Median worth of mobile homes: $15,054
Housing units lacking complete plumbing facilities in 2022: 1.2%Housing units lacking complete kitchen facilities in 2022: 2.0%House/condo owner moved in on average 12 years ago
Renter moved in on average 3 years ago
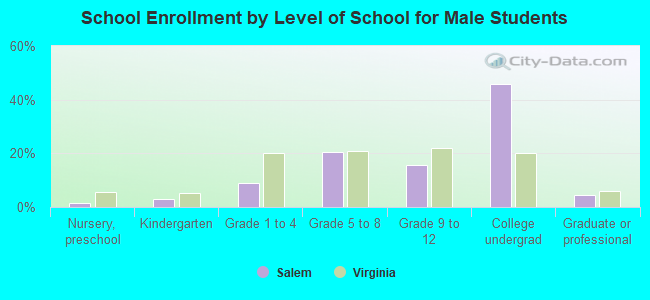
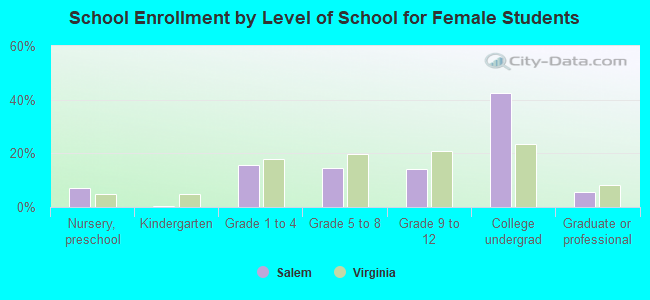
Private vs. public school enrollment:
Students in private schools in grades 1 to 8 (elementary and middle school): 144 Students in private schools in grades 9 to 12 (high school): 60 Students in private undergraduate colleges: 2,065