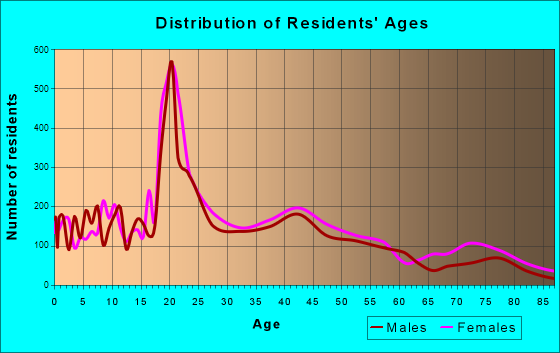
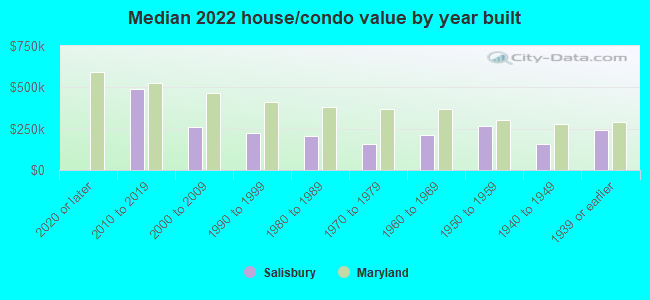
Salisbury, MD (Maryland) Houses and Residents
| Salisbury: | $218,448 |
| Maryland: | $398,100 |
Mean price in 2022:
Detached houses: $207,299
Here: $207,299 State: $526,819 Townhouses or other attached units: $278,281
Here: $278,281 State: $328,305 In 2-unit structures: $52,707
Here: $52,707 State: $346,599 In 3-to-4-unit structures: $171,501
Here: $171,501 State: $295,378 In 5-or-more-unit structures: $186,375
Here: $186,375 State: $350,378
Total population: 32,563 (Urban population: 23,982, Rural population: 177 (all nonfarm))
Houses: 14,735 (13,445 occupied: 3,492 owner occupied, 10,066 renter occupied)
| % of renters here: | 74% |
| State: | 32% |
Housing density: 1,332 houses/condos per square mile
Median price asked for vacant for-sale houses and condos in 2022: $203,924.
Median contract rent in 2022: $1,065 (lower quartile is $769, upper quartile is $1,352)
Median rent asked for vacant for-rent units in 2022: $1,690
Median gross rent in Salisbury, MD in 2022: $1,271
Housing units in Salisbury with a mortgage: 2,521 (210 second mortgage, 9 home equity loan, 167 both second mortgage and home equity loan)
Houses without a mortgage: 7
Median household income for houses/condos with a mortgage: $92,157
Median household income for apartments without a mortgage: $82,134
Median monthly housing costs: $1,251
Compare current foreclosures in Salisbury, MD:
| Photo | Address | Area | Beds / Baths | Price | Details |
|---|---|---|---|---|---|

|
#1
E Church St
Salisbury, MD 21804
|
1,615 sq. feet
|
3 baths 1 beds |
$219,900
|
show details |

|
#2
West Rd
Salisbury, MD 21801
|
1,681 sq. feet
|
1 baths 3 beds |
show details | |

|
#3
Bailey Ln
Salisbury, MD 21801
|
1,560 sq. feet
|
2 baths - beds |
show details | |

|
#4
Rural Pl
Salisbury, MD 21804
|
1,008 sq. feet
|
1 baths - beds |
show details | |

|
#5
Lake St
Salisbury, MD 21801
|
1,056 sq. feet
|
1 baths - beds |
show details | |

|
#6
Johnson Dr
Salisbury, MD 21804
|
1,503 sq. feet
|
2 baths - beds |
show details | |

|
#7
Alvin Ave
Salisbury, MD 21804
|
1,312 sq. feet
|
1 baths - beds |
show details | |

|
#8
Tyler Ave
Salisbury, MD 21804
|
1,176 sq. feet
|
1 baths - beds |
show details | |

|
#9
Sandstone Ct
Salisbury, MD 21804
|
1,340 sq. feet
|
2 baths - beds |
show details | |

|
#10
E Lincoln Ave
Salisbury, MD 21804
|
1,008 sq. feet
|
1 baths - beds |
show details |
| Photo | Address | Area | Beds / Baths | Price | Details |
|---|---|---|---|---|---|

|
#11
Druid Hill Ave
Salisbury, MD 21801
|
1,328 sq. feet
|
1 baths - beds |
show details | |

|
#12
West Rd
Salisbury, MD 21801
|
1,218 sq. feet
|
1 baths - beds |
show details | |

|
#13
Hammond St
Salisbury, MD 21804
|
729 sq. feet
|
1 baths - beds |
show details | |

|
#14
Derby Dr
Salisbury, MD 21801
|
1,689 sq. feet
|
2 baths - beds |
show details | |

|
#15
Kearney Kourt
Salisbury, MD 21804
|
1,944 sq. feet
|
2 baths - beds |
show details | |

|
#16
Burnt Branch Dr
Salisbury, MD 21801
|
1,008 sq. feet
|
2 baths - beds |
show details | |

|
#17
N Curlew Rd
Salisbury, MD 21801
|
1,872 sq. feet
|
2 baths - beds |
show details | |

|
#18
Cherry Way
Salisbury, MD 21804
|
884 sq. feet
|
1 baths - beds |
show details | |

|
#19
Hall Dr
Salisbury, MD 21804
|
1,146 sq. feet
|
1 baths - beds |
show details | |

|
#20
Jersey Rd
Salisbury, MD 21801
|
1,400 sq. feet
|
1 baths - beds |
show details |
| Photo | Address | Area | Beds / Baths | Price | Details |
|---|---|---|---|---|---|

|
#21
Cannon Dr
Salisbury, MD 21804
|
1,325 sq. feet
|
2 baths - beds |
show details | |

|
#22
Shawnee Ave
Salisbury, MD 21801
|
992 sq. feet
|
1 baths - beds |
show details | |

|
#23
Naylor Mill Rd
Salisbury, MD 21801
|
1,344 sq. feet
|
1 baths - beds |
show details | |

|
#24
Jersey Rd
Salisbury, MD 21801
|
1,893 sq. feet
|
2 baths - beds |
show details | |

|
#25
Ebenezer Dr
Salisbury, MD 21801
|
940 sq. feet
|
1 baths - beds |
show details | |

|
#26
Kelvington Ave
Salisbury, MD 21801
|
1,232 sq. feet
|
1 baths - beds |
show details | |

|
#27
Slim Chance Ln
Salisbury, MD 21804
|
1,218 sq. feet
|
3 baths - beds |
show details | |

|
#28
Springfield Cir
Salisbury, MD 21804
|
1,120 sq. feet
|
1 baths - beds |
show details | |

|
#29
E Church St
Salisbury, MD 21804
|
1,954 sq. feet
|
2 baths - beds |
show details | |

|
#30
Frederick Ave
Salisbury, MD 21801
|
1,704 sq. feet
|
1 baths - beds |
show details |
| Photo | Address | Area | Beds / Baths | Price | Details |
|---|---|---|---|---|---|

|
#31
Lancaster Ct
Salisbury, MD 21804
|
1,248 sq. feet
|
2 baths - beds |
show details | |

|
#32
Hollow Mist Dr
Salisbury, MD 21804
|
2,508 sq. feet
|
2 baths - beds |
show details | |

|
#33
Bueclar Dr
Salisbury, MD 21801
|
1,600 sq. feet
|
2 baths - beds |
show details | |

|
#34
Emerald Ct
Salisbury, MD 21804
|
1,362 sq. feet
|
2 baths - beds |
show details | |

|
#35
Windham Ct
Salisbury, MD 21804
|
1,500 sq. feet
|
1 baths - beds |
show details | |

|
#36
Brittingham St
Salisbury, MD 21804
|
1,226 sq. feet
|
2 baths - beds |
show details | |

|
#37
Suffolk Ct
Salisbury, MD 21801
|
1,680 sq. feet
|
2 baths - beds |
show details | |

|
#38
Lakeside Dr
Salisbury, MD 21801
|
2,176 sq. feet
|
1 baths - beds |
show details | |

|
#39
New York Ave
Salisbury, MD 21801
|
1,964 sq. feet
|
1 baths - beds |
show details | |

|
#40
Lakewood Dr
Salisbury, MD 21804
|
1,182 sq. feet
|
1 baths - beds |
show details |
| Photo | Address | Area | Beds / Baths | Price | Details |
|---|---|---|---|---|---|

|
#41
Oxbridge Dr
Salisbury, MD 21801
|
1,632 sq. feet
|
2 baths - beds |
show details | |

|
#42
Heartwood Dr
Salisbury, MD 21804
|
1,124 sq. feet
|
1 baths - beds |
show details | |

|
#43
Meadowlark Dr
Salisbury, MD 21804
|
984 sq. feet
|
1 baths - beds |
show details | |

|
#44
Elizabeth St Apt 3
Salisbury, MD 21801
|
- sq. feet
|
- baths - beds |
show details | |

|
#45
Parkview Ct Apt A
Salisbury, MD 21804
|
- sq. feet
|
- baths - beds |
show details | |

|
#46
Harden Ct
Salisbury, MD 21804
|
- sq. feet
|
- baths - beds |
show details | |

|
#47
Regency Dr
Salisbury, MD 21804
|
- sq. feet
|
- baths - beds |
show details | |

|
#48
Bennett Park Dr
Salisbury, MD 21801
|
- sq. feet
|
- baths - beds |
show details | |

|
#49
Talamore Ct
Salisbury, MD 21804
|
- sq. feet
|
- baths - beds |
show details | |

|
Check over 1 million property listings on Foreclosure.com!
|
browse all offers | |||

Latest news about housing in Salisbury, MD collected exclusively by city-data.com from local newspapers, TV, and radio stations

 | Salisbury apartments (2 replies) |
| Townhomes/Apartments in Salisbury, MD or near Salisbury,MD (4 replies) |
| Moving to Salisbury, MD - Apartments in walkable (and safe) areas? (7 replies) |
| Tell me about Salisbury (6 replies) |
| Salisbury MD and vicinity price of homes (0 replies) |
| Relocating From Louisiana to Salisbury Area (17 replies) |
Median year apartment built: 2002
Household type by relationship:
Households: 33,229- Male householders: 5,334 (1,169 living alone), Female householders: 8,109 (2,994 living alone)
3,654 spouses (3,639 opposite-sex spouses), 1,372 unmarried partners, (1,357 opposite-sex unmarried partners), 8,856 children (8,497 natural, 129 adopted, 229 stepchildren), 1,020 grandchildren, 317 brothers or sisters, 315 parents, 0 foster children, 653 other relatives, 2,237 non-relatives
- In group quarters: 1,358
Size of family households: 3,480 2-persons, 1,619 3-persons, 985 4-persons, 499 5-persons, 308 6-persons, 203 7-or-more-persons.
Size of nonfamily households: 3,806 1-person, 1,595 2-persons, 466 3-persons, 320 4-persons, 20 6-persons.
3,418 married couples with children.
3,032 single-parent households (838 men, 2,194 women).
80.7% of residents of Salisbury speak English at home.
4.2% of residents speak Spanish at home (68% speak English very well, 26% speak English well, 4% speak English not well, 2% don't speak English at all).
10.7% of residents speak other Indo-European language at home (38% speak English very well, 32% speak English well, 20% speak English not well, 10% don't speak English at all).
3.2% of residents speak Asian or Pacific Island language at home (20% speak English very well, 53% speak English well, 18% speak English not well, 9% don't speak English at all).
0.7% of residents speak other language at home (93% speak English very well, 3% speak English well, 4% speak English not well).
Foreign born population: 4,197 (12.6%)
(47.9% of them are naturalized citizens)
| Here: | 6.9 |
| State: | 7.3 |
| Here: | 4.2 |
| State: | 4.2 |
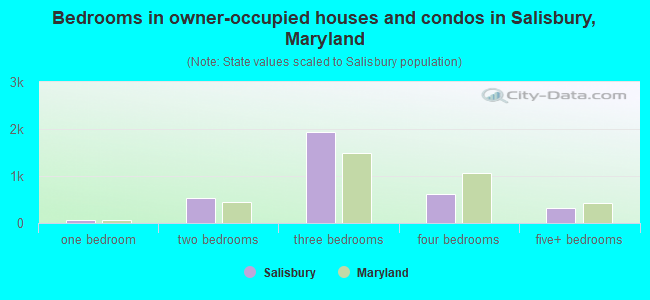
- Bedrooms in owner-occupied houses and condos in Salisbury, Maryland
- 0no bedroom
- 661 bedroom
- 5382 bedrooms
- 1,9403 bedrooms
- 6244 bedrooms
- 3245+ bedrooms
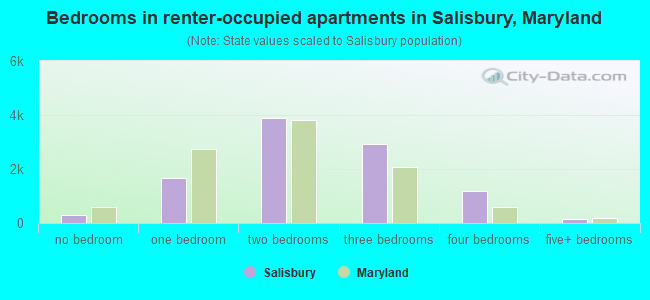
- Bedrooms in renter-occupied apartments in Salisbury, Maryland
- 285no bedroom
- 1,6541 bedroom
- 3,8712 bedrooms
- 2,9333 bedrooms
- 1,1734 bedrooms
- 1505+ bedrooms
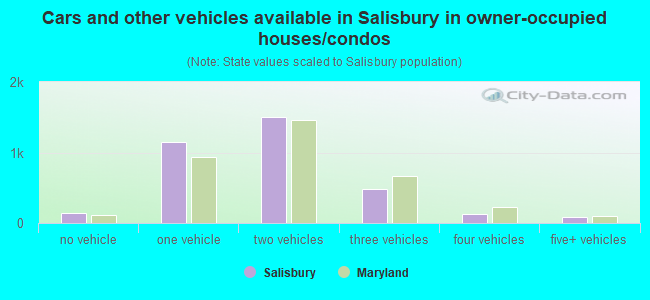
- Cars and other vehicles available in Salisbury in owner-occupied houses/condos
- 135no vehicle
- 1,1431 vehicle
- 1,5082 vehicles
- 4843 vehicles
- 1314 vehicles
- 925+ vehicles
- Cars and other vehicles available in Salisbury in renter-occupied apartments
- 1,674no vehicle
- 4,6161 vehicle
- 3,0572 vehicles
- 3703 vehicles
- 3504 vehicles
- 05+ vehicles
- Rooms in owner-occupied houses in Salisbury, Maryland
- 01 room
- 02 rooms
- 283 rooms
- 2694 rooms
- 6665 rooms
- 7006 rooms
- 7137 rooms
- 4338 rooms
- 6839+ rooms
- Rooms in renter-occupied apartments in Salisbury, Maryland
- 2731 room
- 8282 rooms
- 1,3303 rooms
- 2,6164 rooms
- 2,5405 rooms
- 1,4056 rooms
- 6107 rooms
- 2468 rooms
- 2199+ rooms
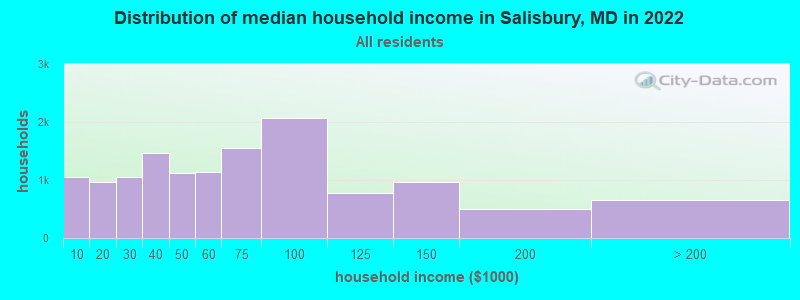
Salisbury, MD household income distribution

- 1,059Less than $10,000
- 973$10,000 to $19,999
- 1,051$20,000 to $29,999
- 1,462$30,000 to $39,999
- 1,116$40,000 to $49,999
- 1,136$50,000 to $59,999
- 1,549$60,000 to $74,999
- 2,063$75,000 to $99,999
- 780$100,000 to $124,999
- 969$125,000 to $149,999
- 503$150,000 to $199,999
- 650$200,000 or more
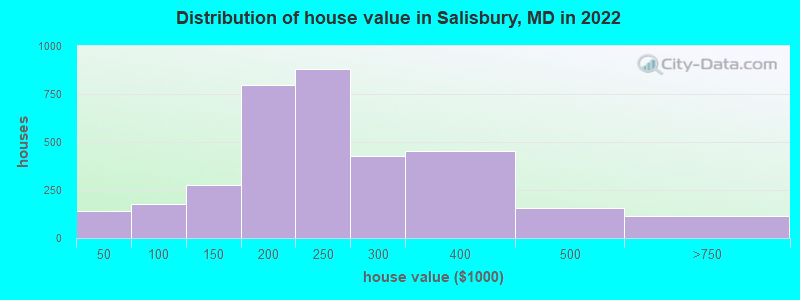
Home value of owner - occupied houses in 2022 in Salisbury, MD
-
- 81Less than $10,000
- 11$10,000 to $14,999
- 12$25,000 to $29,999
- 13$35,000 to $39,999
- 19$40,000 to $49,999
- 20$50,000 to $59,999
- 4$60,000 to $69,999
- 25$70,000 to $79,999
- 97$80,000 to $89,999
- 8$90,000 to $99,999
- 132$100,000 to $124,999
- 141$125,000 to $149,999
- 594$150,000 to $174,999
- 204$175,000 to $199,999
- 881$200,000 to $249,999
- 429$250,000 to $299,999
- 452$300,000 to $399,999
- 153$400,000 to $499,999
- 115$500,000 to $749,999
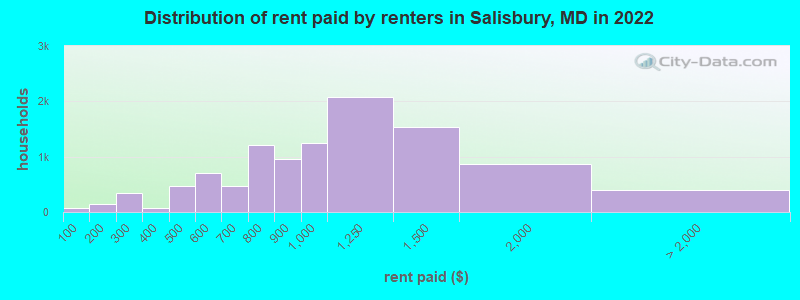
Rent paid by renters in 2022 in Salisbury, MD
-
- 65Less than $100
- 54$100 to $149
- 81$150 to $199
- 304$200 to $249
- 36$250 to $299
- 26$300 to $349
- 49$350 to $399
- 320$400 to $449
- 148$450 to $499
- 559$500 to $549
- 144$550 to $599
- 208$600 to $649
- 252$650 to $699
- 527$700 to $749
- 676$750 to $799
- 964$800 to $899
- 1,255$900 to $999
- 2,085$1,000 to $1,249
- 1,533$1,250 to $1,499
- 863$1,500 to $1,999
- 173$2,000 to $2,499
- 13$2,500 to $2,999
- 18$3,500 or more
- 193No cash rent
Percentage of workers working in this county: 74.4%
Number of people working at home: 629 (3.8% of all workers)
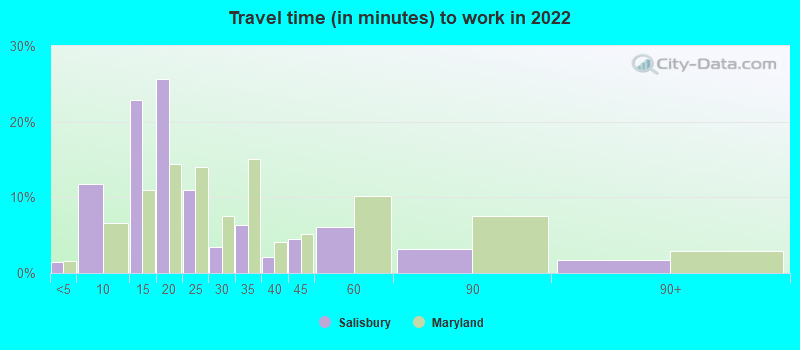
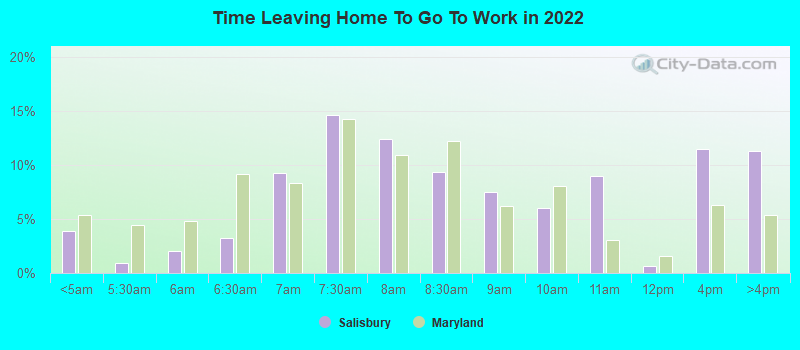
Travel time to work (commute)
- Less than 5 minutes: 480
- 5 to 9 minutes: 2,467
- 10 to 14 minutes: 3,532
- 15 to 19 minutes: 3,598
- 20 to 24 minutes: 967
- 25 to 29 minutes: 253
- 30 to 34 minutes: 1,046
- 35 to 39 minutes: 652
- 40 to 44 minutes: 765
- 45 to 59 minutes: 604
- 60 to 89 minutes: 353
- 90 or more minutes: 671
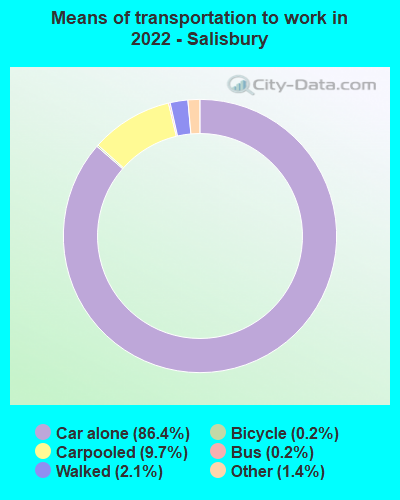
Means of transportation to work:
- Drove a car alone: 24,227 (80.4%)
- Carpooled: 2,890 (9.6%)
- Bus: 47 (0.2%)
- Taxi: 452 (1.5%)
- Bicycle: 62 (0.2%)
- Walked: 562 (1.9%)
- Worked at home: 611 (2.0%)
- Unemployment by race in 2022
- Unemployment rate for White non-Hispanic residents
- 6.8%Males
- 7.9%Females
- Unemployment rate for Black residents
- 6.9%Males
- 5.7%Females
- Unemployment rate for Asian residents
- 6.3%Females
- Unemployment rate for two or more race residents
- 3.3%Males
- 4.4%Females
- Unemployment rate for Hispanic or Latino residents
- 18.1%Males
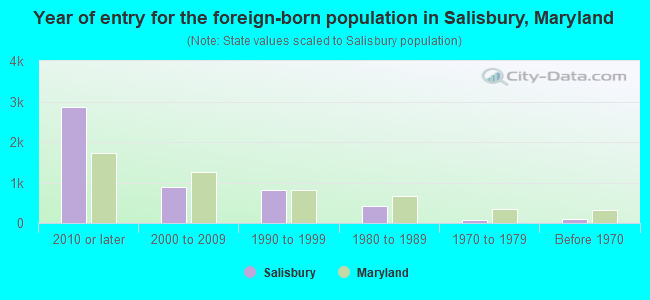
- Year of entry for the foreign-born population in Salisbury, Maryland
- 2,8642010 or later
- 8802000 to 2009
- 8201990 to 1999
- 4151980 to 1989
- 771970 to 1979
- 98Before 1970
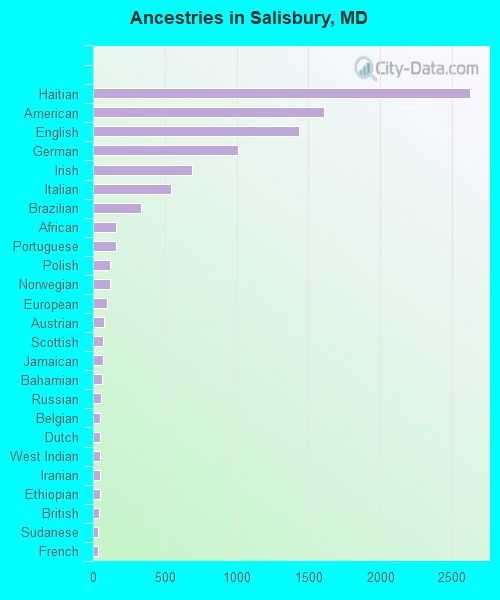
First ancestries reported:
- Haitian: 2,627 (13.1%)
- American: 1,607 (8.0%)
- English: 1,437 (7.2%)
- German: 1,012 (5.1%)
- Irish: 693 (3.5%)
- Italian: 545 (2.7%)
- Brazilian: 336 (1.7%)
- African: 161 (0.8%)
- Portuguese: 159 (0.8%)
- Polish: 117 (0.6%)
- Norwegian: 116 (0.6%)
- European: 101 (0.5%)
- Austrian: 78 (0.4%)
- Scottish: 71 (0.4%)
- Jamaican: 67 (0.3%)
- Bahamian: 64 (0.3%)
- Russian: 57 (0.3%)
- Belgian: 52 (0.3%)
- Dutch: 52 (0.3%)
- West Indian: 50 (0.3%)
- Iranian: 50 (0.3%)
- Ethiopian: 47 (0.2%)
- British: 45 (0.2%)
- Sudanese: 35 (0.2%)
- French: 34 (0.2%)
- Scotch-Irish: 29 (0.1%)
- Welsh: 26 (0.1%)
- Northern European: 24 (0.1%)
- Romanian: 24 (0.1%)
- Swedish: 20 (0.1%)
- Finnish: 19 (0.10%)
- Egyptian: 17 (0.09%)
- French Canadian: 16 (0.08%)
- Scandinavian: 16 (0.08%)
- Ghanaian: 16 (0.08%)
- Swiss: 14 (0.07%)
- Czech: 13 (0.07%)
- Celtic: 13 (0.07%)
- Canadian: 9 (0.05%)
- Eastern European: 8 (0.04%)
- Slovak: 5 (0.03%)
- Bermudan: 4 (0.02%)
- Pennsylvania German: 4 (0.02%)
Most common places of birth for foreign-born residents (%):
| Salisbury: | 35.7% (1,738) |
| Maryland: | 0.9% (9,100) |
| Salisbury: | 11.1% (542) |
| Maryland: | 1.9% (18,716) |
| Salisbury: | 8.1% (392) |
| Maryland: | 1.2% (11,980) |
| Salisbury: | 7.5% (364) |
| Maryland: | 1.8% (17,037) |
| Salisbury: | 6.4% (309) |
| Maryland: | 3.5% (34,065) |
| Salisbury: | 4.7% (230) |
| Maryland: | 3.4% (32,635) |
| Salisbury: | 2.7% (132) |
| Maryland: | 3.8% (36,698) |
| Salisbury: | 2.2% (108) |
| Maryland: | 1.4% (13,947) |
| Salisbury: | 2.1% (100) |
| Maryland: | 0.1% (1,431) |
| Salisbury: | 1.9% (93) |
| Maryland: | 0.1% (738) |
| Salisbury: | 1.8% (90) |
| Maryland: | 4.6% (44,742) |
Place of birth for U.S.-born residents:
- This state: 18,023
- Other state: 10,206
- Northeast: 3,773
- Midwest: 987
- South: 4,820
- West: 636
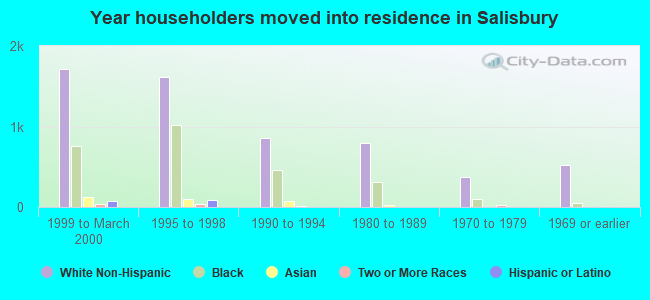
73.8% of Salisbury residents lived in the same house 1 years ago.
Out of people who lived in different houses, 30.6% lived in this county.
Out of people who lived in different counties, 47.3% lived in Maryland.
| Salisbury: | 73.8% |
| State average: | 88.5% |
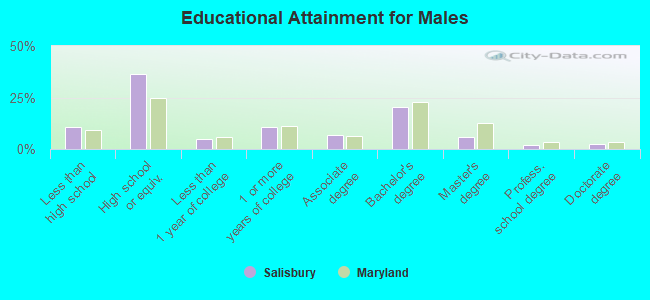
Education attainment for males 25 years and older:
- No schooling: 89
- Nursery to 4th grade: 22
- 5th and 6th grade: 26
- 7th and 8th grade: 130
- 9th grade: 133
- 10th grade: 221
- 11th grade: 94
- 12th grade, no diploma: 187
- High school graduate (or equivalency): 3,089
- Less than 1 year of college: 393
- Some college more than 1 year, no degree: 918
- Associate degree: 568
- Bachelor's degree: 1,713
- Master's degree: 501
- Professional school degree: 145
- Doctorate degree: 204
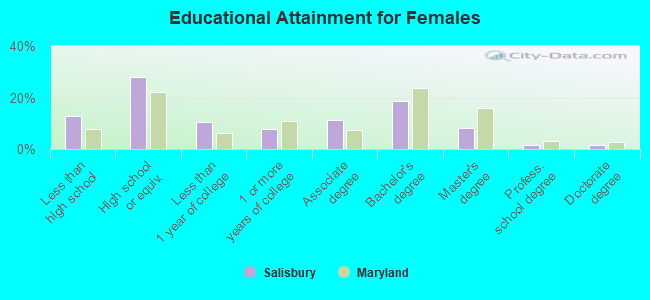
Education attainment for females 25 years and older:
- No schooling: 265
- Nursery to 4th grade: 33
- 5th and 6th grade: 88
- 7th and 8th grade: 265
- 9th grade: 81
- 10th grade: 319
- 11th grade: 268
- 12th grade, no diploma: 110
- High school graduate (or equivalency): 3,151
- Less than 1 year of college: 1,170
- Some college more than 1 year, no degree: 864
- Associate degree: 1,267
- Bachelor's degree: 2,090
- Master's degree: 899
- Professional school degree: 168
- Doctorate degree: 189
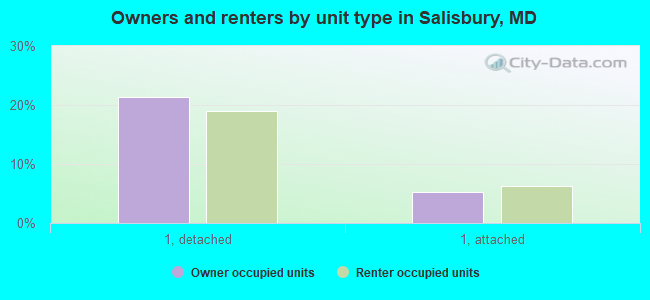
Housing units in structures:
- One, detached: 5,724
- One, attached: 1,992
- Two: 573
- 3 or 4: 968
- 5 to 9: 1,250
- 10 to 19: 2,247
- 20 to 49: 1,042
- 50 or more: 922
- Mobile homes: 13
Housing units lacking complete kitchen facilities in 2022: 1.8%
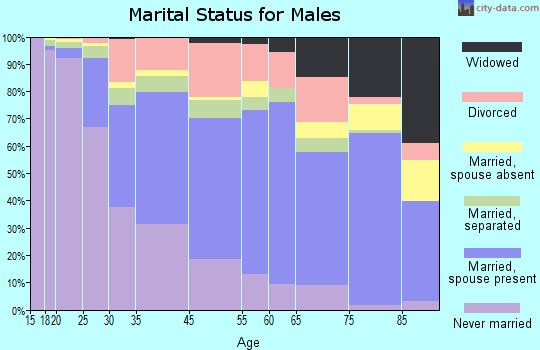
House/condo owner moved in on average 11 years ago
Renter moved in on average 1 years ago
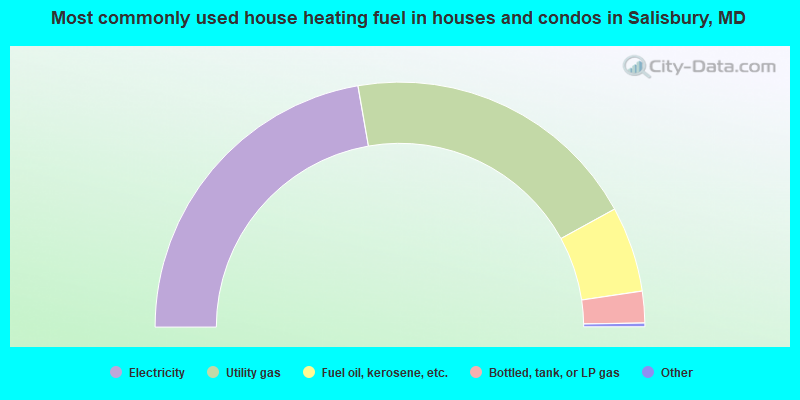
- 44.6%Electricity
- 39.6%Utility gas
- 11.3%Fuel oil, kerosene, etc.
- 4.2%Bottled, tank, or LP gas
- 0.2%Solar energy
- 0.1%Wood
- 0.1%Other fuel
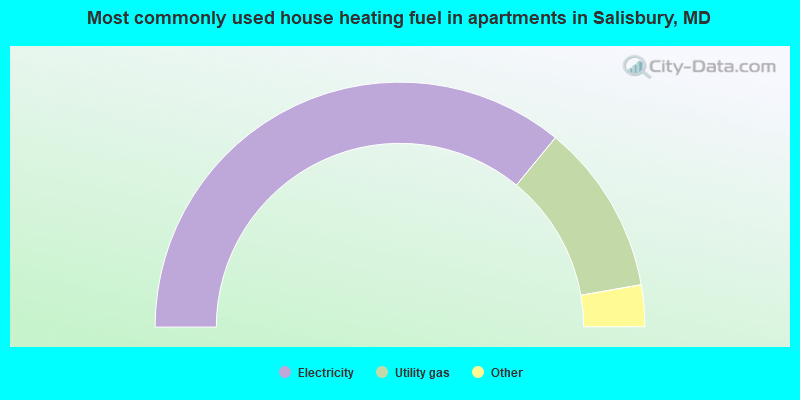
- 71.9%Electricity
- 22.6%Utility gas
- 2.5%Bottled, tank, or LP gas
- 1.7%No fuel used
- 1.2%Fuel oil, kerosene, etc.
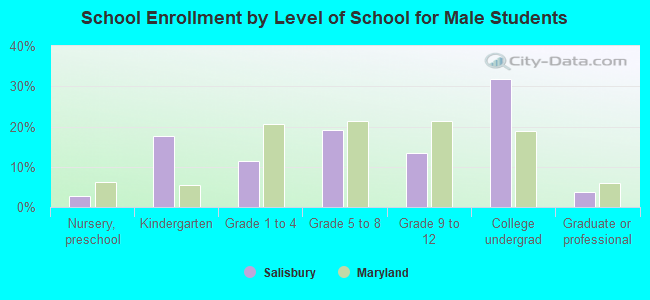
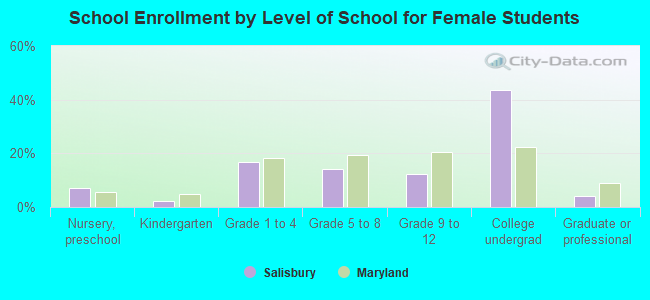
Private vs. public school enrollment:
| Here: | 13.4% |
| Maryland: | 15.2% |
| Here: | 5.7% |
| Maryland: | 14.4% |
| Here: | 5.6% |
| Maryland: | 20.2% |