Housing density: 2,051 houses/condos per square mile
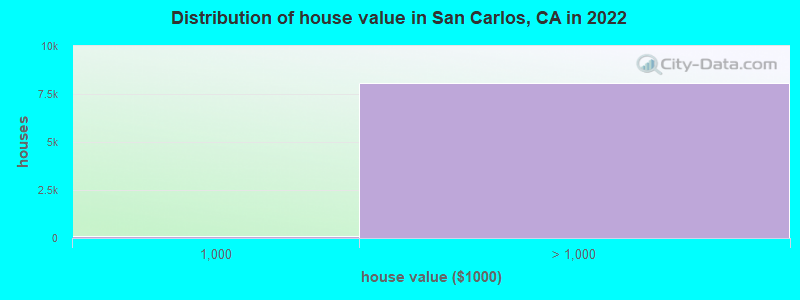
Median price asked for vacant for-sale houses and condos in 2022: $2,168,634.
Median contract rent in 2022: over $2,000 (lower quartile is $1,909, upper quartile is over $2,000)
Median rent asked for vacant for-rent units in 2022: $5,061
Median gross rent in San Carlos, CA in 2022: over $2,000
Housing units in San Carlos with a mortgage: 5,377 (764 second mortgage, 5 home equity loan, 735 both second mortgage and home equity loan) Houses without a mortgage: 111
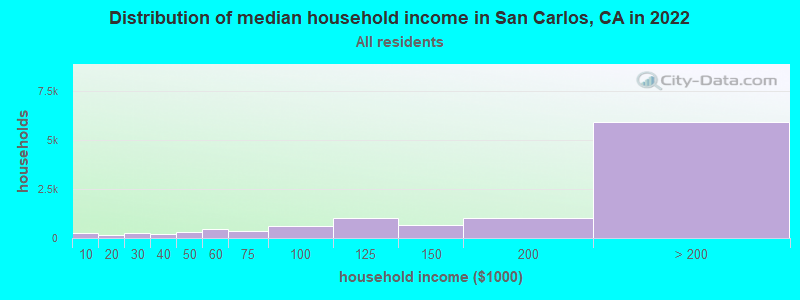
Median household income for houses/condos with a mortgage: $258,196
Median household income for apartments without a mortgage: $145,816
5,501 married couples with children.
859 single-parent households (267 men, 592 women).
74.7% of residents of San Carlos speak English at home.
4.6% of residents speak Spanish at home (60% speak English very well, 24% speak English well, 16% speak English not well, 1% don't speak English at all).
9.8% of residents speak other Indo-European language at home (84% speak English very well, 11% speak English well, 5% speak English not well, 1% don't speak English at all).
10.8% of residents speak Asian or Pacific Island language at home (78% speak English very well, 18% speak English well, 3% speak English not well, 1% don't speak English at all).
0.7% of residents speak other language at home (78% speak English very well, 22% speak English well).
Foreign born population: 7,331 (24.9%)
(58.4% of them are naturalized citizens)
Percentage of workers working in this county: 80.6% Number of people working at home: 5,987 (38.4% of all workers)
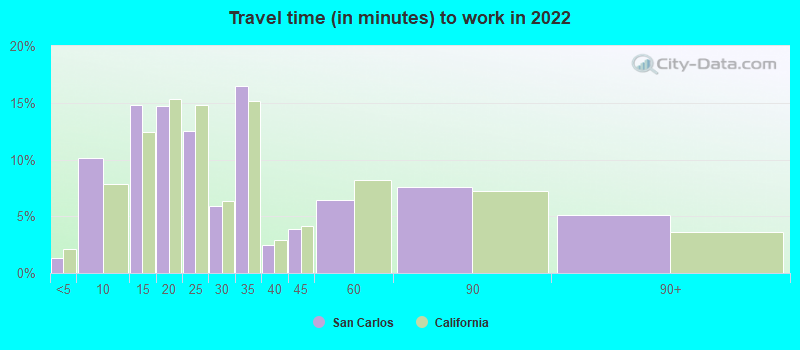
Travel time to work (commute)
Less than 5 minutes: 183
5 to 9 minutes: 1,239
10 to 14 minutes: 1,360
15 to 19 minutes: 1,613
20 to 24 minutes: 1,400
25 to 29 minutes: 817
30 to 34 minutes: 1,508
35 to 39 minutes: 636
40 to 44 minutes: 494
45 to 59 minutes: 557
60 to 89 minutes: 461
90 or more minutes: 139
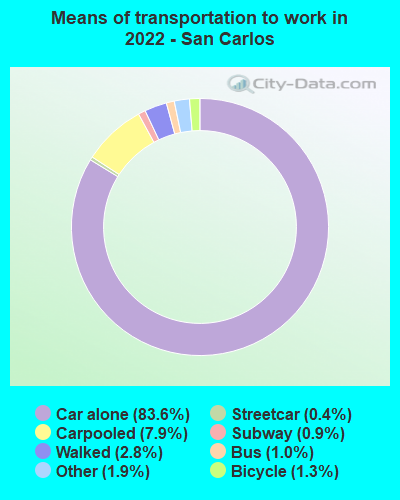
Means of transportation to work:
Drove a car alone: 11,209 (58.9%)
Carpooled: 1,163 (6.1%)
Bus: 124 (0.7%)
Subway or elevated rail: 44 (0.2%)
Long-distance train or commuter rail: 117 (0.6%)
Light rail, streetcar or trolley: 9 (0.0%)
Taxi: 212 (1.1%)
Bicycle: 199 (1.0%)
Walked: 427 (2.2%)
Worked at home: 5,987 (31.4%)
Unemployment by race in 2022
Unemployment rate for White non-Hispanic residents
3.9%Males
3.7%Females
Unemployment rate for Asian residents
0.4%Males
3.7%Females
Unemployment rate for other race residents
4.2%Males
3.5%Females
Unemployment rate for two or more race residents
1.3%Males
1.5%Females
Unemployment rate for Hispanic or Latino residents
2.1%Males
3.9%Females
Year of entry for the foreign-born population in San Carlos, California
1,7672010 or later
1,8422000 to 2009
8441990 to 1999
9511980 to 1989
7911970 to 1979
1,415Before 1970
First ancestries reported:
English: 800 (5.8%)
American: 775 (5.6%)
Italian: 755 (5.4%)
German: 739 (5.3%)
Irish: 582 (4.2%)
European: 427 (3.1%)
Iranian: 314 (2.3%)
Swedish: 262 (1.9%)
Russian: 234 (1.7%)
Greek: 209 (1.5%)
Polish: 188 (1.4%)
Czech: 158 (1.1%)
Eastern European: 146 (1.1%)
British: 142 (1.0%)
Portuguese: 116 (0.8%)
Ukrainian: 115 (0.8%)
Scottish: 94 (0.7%)
Maltese: 92 (0.7%)
Danish: 92 (0.7%)
Romanian: 91 (0.7%)
French: 62 (0.4%)
Canadian: 61 (0.4%)
Swiss: 57 (0.4%)
Dutch: 56 (0.4%)
Brazilian: 45 (0.3%)
African: 42 (0.3%)
Northern European: 41 (0.3%)
Turkish: 41 (0.3%)
Croatian: 36 (0.3%)
Scandinavian: 35 (0.3%)
Norwegian: 32 (0.2%)
Trinidadian and Tobagonian: 31 (0.2%)
Scotch-Irish: 26 (0.2%)
Armenian: 25 (0.2%)
Jordanian: 21 (0.2%)
Welsh: 21 (0.2%)
Austrian: 20 (0.1%)
Lebanese: 19 (0.1%)
French Canadian: 17 (0.1%)
Hungarian: 14 (0.1%)
Estonian: 12 (0.09%)
Kenyan: 11 (0.08%)
Israeli: 10 (0.07%)
Belgian: 10 (0.07%)
Egyptian: 9 (0.06%)
Palestinian: 8 (0.06%)
Finnish: 7 (0.05%)
Basque: 7 (0.05%)
Slavic: 6 (0.04%)
Lithuanian: 4 (0.03%)
Most common places of birth for foreign-born residents (%):
China, excluding Hong Kong and Taiwan
San Carlos:
12.2% (904)
California:
6.6% (684,672)
India
San Carlos:
11.5% (856)
California:
5.2% (539,184)
Philippines
San Carlos:
6.9% (510)
California:
7.8% (818,297)
Iran
San Carlos:
5.3% (394)
California:
2.0% (206,004)
Canada
San Carlos:
4.8% (354)
California:
1.2% (127,477)
Mexico
San Carlos:
4.2% (312)
California:
37.2% (3,881,193)
United Kingdom, excluding England and Scotland
San Carlos:
3.9% (291)
California:
0.6% (60,582)
Hong Kong
San Carlos:
3.3% (242)
California:
1.0% (105,215)
Korea
San Carlos:
3.2% (238)
California:
3.0% (315,248)
Russia
San Carlos:
3.2% (237)
California:
0.7% (71,932)
Taiwan
San Carlos:
3.2% (236)
California:
1.7% (176,274)
Germany
San Carlos:
2.5% (182)
California:
0.7% (73,304)
Japan
San Carlos:
2.2% (164)
California:
1.0% (103,575)
Vietnam
San Carlos:
2.1% (157)
California:
4.9% (512,335)
Ukraine
San Carlos:
1.9% (138)
California:
0.6% (60,761)
Oceania, n.e.c.
San Carlos:
1.7% (126)
California:
0.2% (18,925)
Peru
San Carlos:
1.5% (114)
California:
0.7% (74,025)
Place of birth for U.S.-born residents:
This state: 15,111
Other state: 6,592
Northeast: 1,913
Midwest: 2,124
South: 1,156
West: 1,428
88.2% of San Carlos residents lived in the same house 1 years ago. Out of people who lived in different houses, 38.1% lived in this county. Out of people who lived in different counties, 71.1% lived in California.
San Carlos:
88.2%
State average:
88.9%
Education attainment for males 25 years and older:
No schooling: 34
Nursery to 4th grade: 19
5th and 6th grade: 88
7th and 8th grade: 54
9th grade: 18
10th grade: 6
11th grade: 4
12th grade, no diploma: 100
High school graduate (or equivalency): 841
Less than 1 year of college: 492
Some college more than 1 year, no degree: 990
Associate degree: 511
Bachelor's degree: 3,215
Master's degree: 2,180
Professional school degree: 616
Doctorate degree: 1,053
Education attainment for females 25 years and older:
No schooling: 63
Nursery to 4th grade: 19
5th and 6th grade: 44
7th and 8th grade: 88
9th grade: 0
10th grade: 73
11th grade: 10
12th grade, no diploma: 144
High school graduate (or equivalency): 891
Less than 1 year of college: 526
Some college more than 1 year, no degree: 999
Associate degree: 741
Bachelor's degree: 3,050
Master's degree: 3,086
Professional school degree: 840
Doctorate degree: 685
Housing units in structures:
One, detached: 8,340
One, attached: 452
Two: 75
3 or 4: 339
5 to 9: 894
10 to 19: 1,071
20 to 49: 634
50 or more: 328
Housing units lacking complete plumbing facilities in 2022: 0.1%
Housing units lacking complete kitchen facilities in 2022: 0.5%
House/condo owner moved in on average 16 years ago