San Felipe, TX (Texas) Houses and Residents
| San Felipe: | $233,743 |
| Texas: | $275,400 |
Mean price in 2022:
Detached houses: $263,110
Here: $263,110 State: $369,058 Mobile homes: $58,255
Here: $58,255 State: $124,413
Total population: 770 (Urban population: 0, Rural population: 843 (7 farm, 836 nonfarm))
Houses: 465 (413 occupied: 357 owner occupied, 62 renter occupied)
| % of renters here: | 15% |
| State: | 38% |
Housing density: 56 houses/condos per square mile
Median price asked for vacant for-sale houses and condos in 2022 in this county: $292,320.
Median contract rent in 2022: $1,001
Median rent asked for vacant for-rent units in 2022: $803
Median gross rent in San Felipe, TX in 2022: $1,405
Housing units in San Felipe with a mortgage: 218 (0 second mortgage, 0 home equity loan, 0 both second mortgage and home equity loan)
Houses without a mortgage: 0
Compare current foreclosures near San Felipe, TX:
| Photo | Address | Area | Beds / Baths | Price | Details |
|---|---|---|---|---|---|

|
#1
Karankawa Trail
Katy, TX 77493
|
2,743 sq. feet
|
3 baths 3 beds |
show details | |

|
#2
Willow St
Sealy, TX 77474
|
1,396 sq. feet
|
2 baths 3 beds |
show details | |

|
#3
Prairie Sky Lane
Katy, TX 77493
|
3,842 sq. feet
|
4 baths 5 beds |
show details | |

|
#4
Sunburst Court
Katy, TX 77494
|
- sq. feet
|
2 baths 4 beds |
show details | |

|
#5
Crested Butte Dr
Katy, TX 77494
|
- sq. feet
|
3 baths 4 beds |
show details | |

|
#6
Hamilton Crest
Brookshire, TX 77423
|
- sq. feet
|
2 baths 4 beds |
show details | |

|
#7
Walnut Ln
Brookshire, TX 77423
|
1,621 sq. feet
|
2 baths 3 beds |
show details | |

|
#8
Avenue D
Katy, TX 77493
|
3,063 sq. feet
|
2 baths 3 beds |
show details | |

|
#9
Pine Lakes Dr
Katy, TX 77493
|
2,044 sq. feet
|
2 baths 3 beds |
show details | |

|
#10
E Elm Cir
Katy, TX 77493
|
3,574 sq. feet
|
3 baths 4 beds |
show details |
| Photo | Address | Area | Beds / Baths | Price | Details |
|---|---|---|---|---|---|

|
#11
Willow St
Sealy, TX 77474
|
2,532 sq. feet
|
2 baths - beds |
show details | |

|
#12
Fannin St
Sealy, TX 77474
|
792 sq. feet
|
1 baths - beds |
show details | |

|
#13
Old Columbus Rd N
Sealy, TX 77474
|
2,107 sq. feet
|
2 baths - beds |
show details | |

|
#14
Chalet Park Dr
Katy, TX 77494
|
2,314 sq. feet
|
- baths 3 beds |
show details | |

|
#15
Quail Holw
Sealy, TX 77474
|
1,657 sq. feet
|
2 baths - beds |
show details | |

|
#16
Mesquite Rd
Wallis, TX 77485
|
1,462 sq. feet
|
2 baths - beds |
show details | |

|
#17
Henson Falls Dr
Katy, TX 77494
|
2,514 sq. feet
|
- baths 4 beds |
show details | |

|
#18
River Bend Ln
Sealy, TX 77474
|
1,846 sq. feet
|
2 baths - beds |
show details | |

|
#19
Harvest Rd
Sealy, TX 77474
|
1,660 sq. feet
|
2 baths - beds |
show details | |

|
#20
Meyer St
Sealy, TX 77474
|
2,508 sq. feet
|
2 baths - beds |
show details |
| Photo | Address | Area | Beds / Baths | Price | Details |
|---|---|---|---|---|---|

|
#21
Saras Way
Brookshire, TX 77423
|
- sq. feet
|
- baths - beds |
show details | |

|
#22
Greenshank Dr
Katy, TX 77493
|
- sq. feet
|
- baths - beds |
show details | |

|
#23
Lakes Of Katy Ln
Katy, TX 77493
|
5,229 sq. feet
|
- baths - beds |
show details | |

|
#24
Eagle Nest Acres
Wallis, TX 77485
|
- sq. feet
|
- baths - beds |
show details | |

|
#25
Monaco St
Katy, TX 77494
|
- sq. feet
|
- baths - beds |
show details | |

|
#26
Anna Ln
Sealy, TX 77474
|
- sq. feet
|
- baths - beds |
show details | |

|
#27
Morton Rd
Katy, TX 77493
|
1,840 sq. feet
|
- baths - beds |
show details | |

|
#28
Pearl Bridge Ln
Katy, TX 77494
|
- sq. feet
|
- baths - beds |
show details | |

|
#29
Woods Hollow Trl
Richmond, TX 77406
|
- sq. feet
|
- baths - beds |
show details | |

|
#30
Sunrise Gables Dr
Katy, TX 77493
|
- sq. feet
|
- baths - beds |
show details |
| Photo | Address | Area | Beds / Baths | Price | Details |
|---|---|---|---|---|---|

|
#31
Fragile Sail Ct
Katy, TX 77494
|
- sq. feet
|
- baths - beds |
show details | |

|
#32
Sallow Bay Ln
Fulshear, TX 77441
|
- sq. feet
|
- baths - beds |
show details | |

|
#33
Crescent Mirror Ln
Katy, TX 77494
|
- sq. feet
|
- baths - beds |
show details | |

|
#34
Harlow Ranch Ct
Fulshear, TX 77441
|
- sq. feet
|
- baths - beds |
show details | |

|
#35
Emma Rose Dr
Katy, TX 77493
|
- sq. feet
|
- baths - beds |
show details | |

|
#36
Elm Patch Dr
Katy, TX 77493
|
- sq. feet
|
- baths - beds |
show details | |

|
#37
Lazy River Dr
Sealy, TX 77474
|
- sq. feet
|
- baths - beds |
show details | |

|
#38
Brannon Branch Ct
Fulshear, TX 77441
|
- sq. feet
|
- baths - beds |
show details | |

|
#39
Grayson Gardens Ct
Fulshear, TX 77441
|
- sq. feet
|
- baths - beds |
show details | |

|
#40
Cedar Elm Ln
Fulshear, TX 77441
|
- sq. feet
|
- baths - beds |
show details |
| Photo | Address | Area | Beds / Baths | Price | Details |
|---|---|---|---|---|---|

|
#41
Stoney Shores Ln
Katy, TX 77494
|
- sq. feet
|
- baths - beds |
show details | |

|
#42
Postwood Manor Ct
Katy, TX 77494
|
- sq. feet
|
- baths - beds |
show details | |

|
#43
Woodcreek Bend Ln
Katy, TX 77494
|
- sq. feet
|
- baths - beds |
show details | |

|
#44
Quiet Canyon Ln
Fulshear, TX 77441
|
- sq. feet
|
- baths - beds |
show details | |

|
#45
Bentridge Park Ln
Katy, TX 77494
|
- sq. feet
|
- baths - beds |
show details | |

|
#46
Wooded Hollow Ct
Katy, TX 77494
|
- sq. feet
|
- baths - beds |
show details | |

|
#47
Mert Ln
Katy, TX 77493
|
2,150 sq. feet
|
- baths - beds |
show details | |

|
#48
Donna Ct
Brookshire, TX 77423
|
- sq. feet
|
- baths - beds |
show details | |

|
#49
Fairway Glen Ln
Katy, TX 77493
|
- sq. feet
|
- baths - beds |
show details | |

|
Check over 1 million property listings on Foreclosure.com!
|
browse all offers | |||


Median year apartment built: 1974
Household type by relationship:
Households: 1,066- Male householders: 202 (37 living alone), Female householders: 205 (29 living alone)
137 spouses (137 opposite-sex spouses), 14 unmarried partners, (14 opposite-sex unmarried partners), 321 children (315 natural, 0 adopted, 6 stepchildren), 156 grandchildren, 8 brothers or sisters, 9 parents, 0 foster children, 4 other relatives, 8 non-relatives
Size of family households: 69 2-persons, 128 3-persons, 110 4-persons, 16 5-persons, 7 6-persons, 3 7-or-more-persons.
Size of nonfamily households: 71 1-person, 10 2-persons.
157 married couples with children.
66 single-parent households (14 men, 52 women).
84.0% of residents of San Felipe speak English at home.
14.2% of residents speak Spanish at home (32% speak English very well, 65% speak English well, 2% speak English not well, 1% don't speak English at all).
1.5% of residents speak Asian or Pacific Island language at home (100% speak English very well).
0.2% of residents speak other language at home (100% speak English very well).
Foreign born population: 135 (12.7%)
(37.8% of them are naturalized citizens)
| Here: | 6.8 |
| State: | 6.3 |
| Here: | 5.3 |
| State: | 4.0 |

- Bedrooms in owner-occupied houses and condos in San Felipe, Texas
- 3no bedroom
- 101 bedroom
- 622 bedrooms
- 1573 bedrooms
- 1224 bedrooms
- 35+ bedrooms

- Bedrooms in renter-occupied apartments in San Felipe, Texas
- 0no bedroom
- 01 bedroom
- 82 bedrooms
- 543 bedrooms
- 04 bedrooms
- 05+ bedrooms

- Cars and other vehicles available in San Felipe in owner-occupied houses/condos
- 23no vehicle
- 1161 vehicle
- 1332 vehicles
- 583 vehicles
- 264 vehicles
- 05+ vehicles

- Cars and other vehicles available in San Felipe in renter-occupied apartments
- 0no vehicle
- 211 vehicle
- 372 vehicles
- 43 vehicles
- 04 vehicles
- 05+ vehicles

- Rooms in owner-occupied houses in San Felipe, Texas
- 31 room
- 02 rooms
- 133 rooms
- 314 rooms
- 385 rooms
- 696 rooms
- 947 rooms
- 918 rooms
- 199+ rooms

- Rooms in renter-occupied apartments in San Felipe, Texas
- 01 room
- 02 rooms
- 03 rooms
- 34 rooms
- 305 rooms
- 306 rooms
- 07 rooms
- 08 rooms
- 09+ rooms


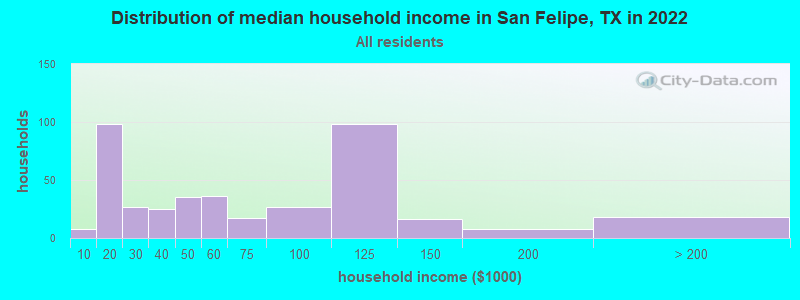
San Felipe, TX household income distribution

- 8Less than $10,000
- 98$10,000 to $19,999
- 27$20,000 to $29,999
- 25$30,000 to $39,999
- 35$40,000 to $49,999
- 36$50,000 to $59,999
- 17$60,000 to $74,999
- 27$75,000 to $99,999
- 98$100,000 to $124,999
- 16$125,000 to $149,999
- 8$150,000 to $199,999
- 18$200,000 or more
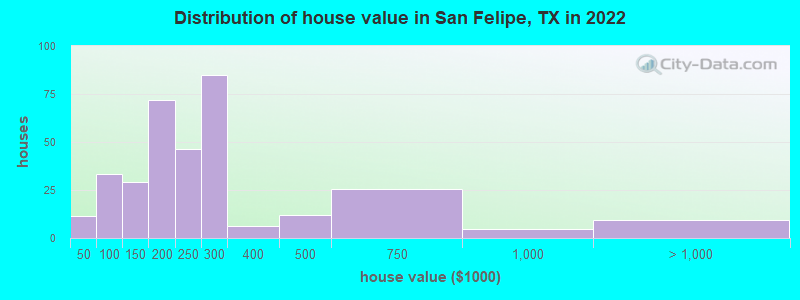
Home value of owner - occupied houses in 2022 in San Felipe, TX
-
- 8$20,000 to $24,999
- 3$25,000 to $29,999
- 18$50,000 to $59,999
- 9$80,000 to $89,999
- 5$90,000 to $99,999
- 24$100,000 to $124,999
- 4$125,000 to $149,999
- 59$150,000 to $174,999
- 12$175,000 to $199,999
- 46$200,000 to $249,999
- 84$250,000 to $299,999
- 6$300,000 to $399,999
- 11$400,000 to $499,999
- 25$500,000 to $749,999
- 4$750,000 to $999,999
- 9$1,500,000 to $1,999,999
Rent paid by renters in 2022 in San Felipe, TX
-
- 12$200 to $249
- 5$500 to $549
- 15$900 to $999
- 10$1,000 to $1,249
- 14$1,250 to $1,499


Percentage of workers working in this county: 32.9%
Number of people working at home: 23 (5.5% of all workers)
Travel time to work (commute)
- Less than 5 minutes: 28
- 5 to 9 minutes: 21
- 10 to 14 minutes: 22
- 15 to 19 minutes: 49
- 20 to 24 minutes: 5
- 25 to 29 minutes: 14
- 30 to 34 minutes: 12
- 35 to 39 minutes: 1
- 40 to 44 minutes: 66
- 45 to 59 minutes: 100
- 60 to 89 minutes: 48
- 90 or more minutes: 15
Means of transportation to work:
- Drove a car alone: 277 (75.5%)
- Carpooled: 71 (19.3%)
- Walked: 2 (0.5%)
- Other means: 5 (1.4%)
- Worked at home: 12 (3.3%)

- Unemployment by race in 2022
- Unemployment rate for White non-Hispanic residents
- 3.9%Males
- 12.3%Females

- Year of entry for the foreign-born population in San Felipe, Texas
- 632010 or later
- 412000 to 2009
- 291990 to 1999
- 01980 to 1989
- 01970 to 1979
- 7Before 1970

First ancestries reported:
- English: 43 (7.4%)
- German: 33 (5.7%)
- American: 21 (3.6%)
- Czech: 14 (2.4%)
- Polish: 12 (2.1%)
- Irish: 9 (1.6%)
- European: 8 (1.4%)
- Italian: 3 (0.5%)
- African: 1 (0.2%)
Most common places of birth for foreign-born residents (%):
| San Felipe: | 63.0% (85) |
| Texas: | 48.4% (2,411,723) |
| San Felipe: | 26.7% (36) |
| Texas: | 3.0% (147,182) |
| San Felipe: | 13.3% (18) |
| Texas: | 0.1% (3,669) |
Place of birth for U.S.-born residents:
- This state: 794
- Other state: 122
- Northeast: 17
- Midwest: 45
- South: 30
- West: 28
94.4% of San Felipe residents lived in the same house 1 years ago.
Out of people who lived in different houses, 28.6% lived in this county.
Out of people who lived in different counties, 100.0% lived in Texas.
| San Felipe: | 94.4% |
| State average: | 85.7% |
Education attainment for males 25 years and older:
- No schooling: 3
- Nursery to 4th grade: 0
- 5th and 6th grade: 0
- 7th and 8th grade: 9
- 9th grade: 13
- 10th grade: 5
- 11th grade: 5
- 12th grade, no diploma: 18
- High school graduate (or equivalency): 134
- Less than 1 year of college: 13
- Some college more than 1 year, no degree: 26
- Associate degree: 29
- Bachelor's degree: 22
- Master's degree: 35
- Professional school degree: 0
- Doctorate degree: 0

Education attainment for females 25 years and older:
- No schooling: 1
- Nursery to 4th grade: 2
- 5th and 6th grade: 1
- 7th and 8th grade: 0
- 9th grade: 0
- 10th grade: 0
- 11th grade: 0
- 12th grade, no diploma: 4
- High school graduate (or equivalency): 162
- Less than 1 year of college: 12
- Some college more than 1 year, no degree: 53
- Associate degree: 5
- Bachelor's degree: 60
- Master's degree: 17
- Professional school degree: 7
- Doctorate degree: 0


Housing units in structures:
- One, detached: 352
- One, attached: 7
- Two: 2
- Mobile homes: 103
Median worth of mobile homes: $182,242
Housing units lacking complete kitchen facilities in 2022: 5.1%
House/condo owner moved in on average 16 years ago
Renter moved in on average 3 years ago

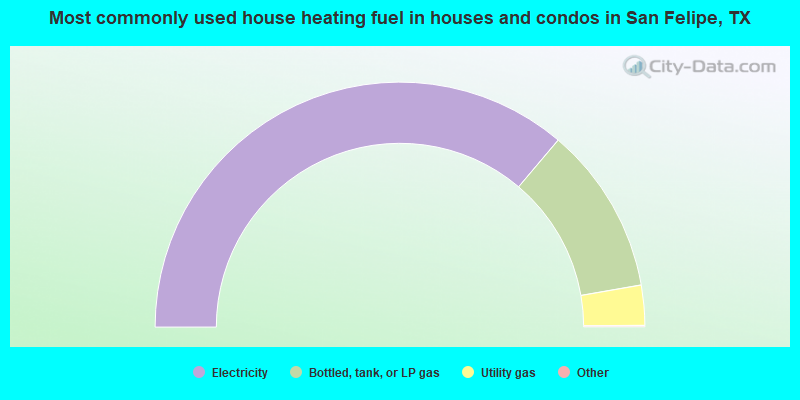
- 72.5%Electricity
- 22.2%Bottled, tank, or LP gas
- 5.3%Utility gas
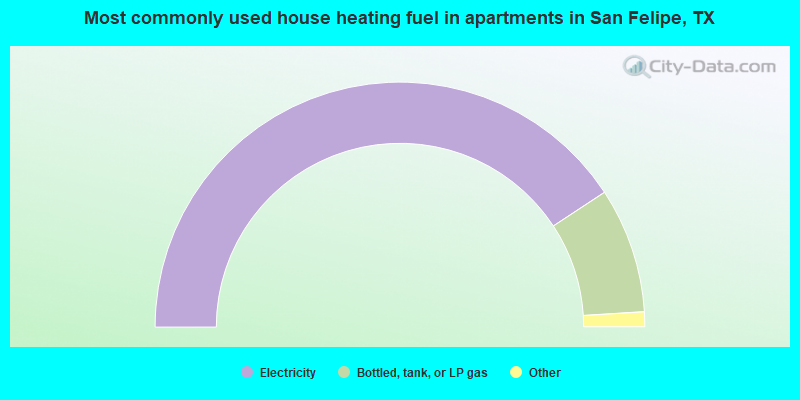
- 83.1%Electricity
- 16.9%Bottled, tank, or LP gas
Private vs. public school enrollment:
| Here: | 4.4% |
| Texas: | 8.8% |
| Here: | 0.0% |
| Texas: | 8.0% |
| Here: | 0.0% |
| Texas: | 16.2% |


