San Jacinto, CA (California) Houses and Residents
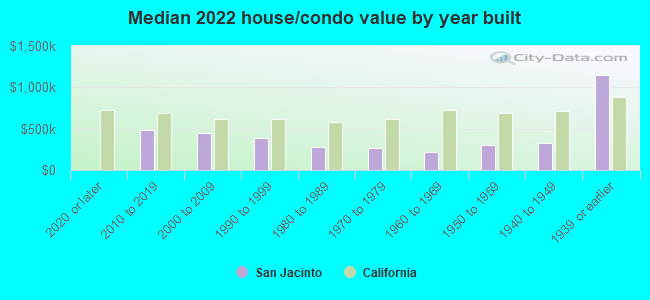
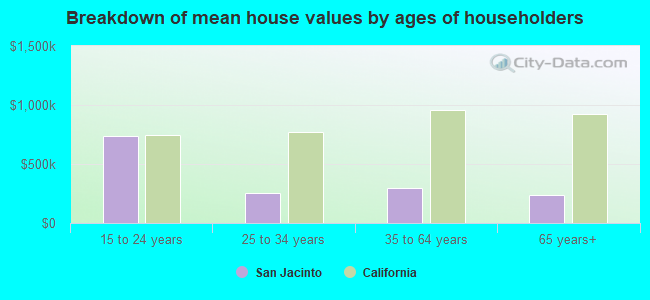
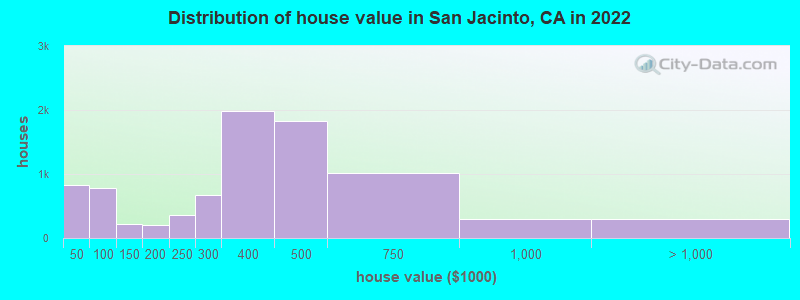
Estimated median house or condo value in 2022: $414,900 (it was $78,500 in 2000 )
San Jacinto:
$414,900California:
$715,900
Lower value quartile - upper value quartile: $315,996 - $483,605Total population: 46,490 (Urban population: 22,996, Rural population: 927 (165 farm, 762 nonfarm ))
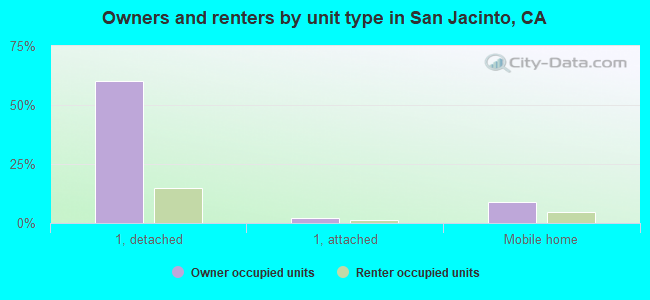
Houses: 15,701 (14,702 occupied: 10,588 owner occupied, 4,212 renter occupied )
% of renters here:
28%State:
44%
Housing density: 630 houses/condos per square mile
Median price asked for vacant for-sale houses and condos in 2022: $306,078.
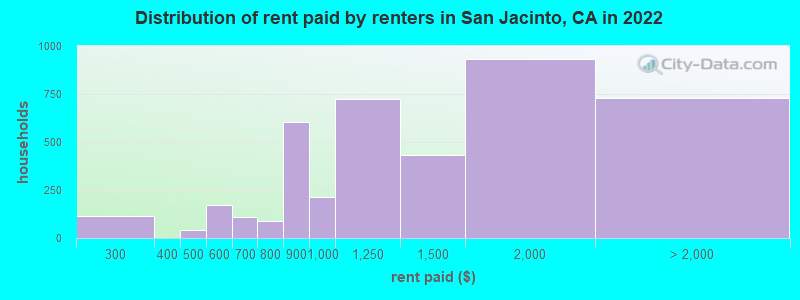
Median contract rent in 2022: $1,284 (lower quartile is $897, upper quartile is $1,816)
Median rent asked for vacant for-rent units in 2022: $1,929
Median gross rent in San Jacinto, CA in 2022: $1,540
Housing units in San Jacinto with a mortgage: 7,487 (341 second mortgage, 1 home equity loan, 151 both second mortgage and home equity loan )Houses without a mortgage: 0
Median household income for houses/condos with a mortgage: $94,546
Median household income for apartments without a mortgage: $51,608
Median monthly housing costs: $1,670
Data:
Median house or condo value ($)
Median house or condo value ($ change since 2000)
Median house or condo value ($) - White
Median house or condo value ($) - Black or African American
Median house or condo value ($) - Asian
Median house or condo value ($) - Hispanic or Latino
Median house or condo value ($) - American Indian and Alaska Native
Median house or condo value ($) - Multirace
Median house or condo value ($) - Other Race
Median price asked for mobile homes ($)
Household density (households per square mile)
Mean house or condo value by units in structure - 1, detached ($)
Mean house or condo value by units in structure - 1, attached ($)
Mean house or condo value by units in structure - 2 ($)
Mean house or condo value by units in structure by units in structure - 3 or 4 ($)
Mean house or condo value by units in structure - 5 or more ($)
Mean house or condo value by units in structure - Boat, RV, van, etc. ($)
Mean house or condo value by units in structure - Mobile home ($)
Median contract rent ($)
Median contract rent - Lower quartile ($)
Median contract rent - Upper quartile ($)
Median gross rent ($)
Urban houses (%)
Rural houses (%)
Houses occupied (%)
Houses occupied (% change since 2000)
Houses owner occupied (%)
Houses owner occupied (% change since 2000)
Houses renter occupied (%)
Houses renter occupied (% change since 2000)
Vacant housing units - For rent (%)
Vacant housing units - For rent (% change since 2000)
Vacant housing units - For sale only (%)
Vacant housing units - For sale only (% change since 2000)
Vacant housing units - Rented or sold, not occupied (%)
Vacant housing units - Rented or sold, not occupied (% change since 2000)
Vacant housing units - For seasonal, recreational, or occasional use (%)
Vacant housing units - For seasonal, recreational, or occasional use (% change since 2000)
Vacant housing units - For migrant workers (%)
Vacant housing units - For migrant workers (% change since 2000)
Vacant housing units - Other vacant (%)
Vacant housing units - Other vacant (% change since 2000)
Median monthly housing costs ($)
Median household income for houses/condos with a mortgage ($)
Median household income for houses/condos without a mortgage ($)
Median household income ($)
Median household income ($) - White
Median household income ($) - Black or African American
Median household income ($) - Asian
Median household income ($) - Hispanic or Latino
Median household income ($) - American Indian and Alaska Native
Median household income ($) - Multirace
Median household income ($) - Other Race
Mortgage status - with mortgage (%)
Mortgage status - with second mortgage (%)
Mortgage status - with home equity loan (%)
Mortgage status - with both second mortgage and home equity loan (%)
Mortgage status - without a mortgage (%)
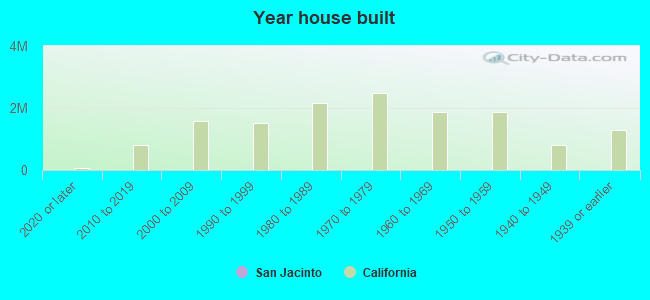
Median year house/condo built
Median year apartment built
Household type by relationship - Male householder living alone (%)
Household type by relationship - Male householder not living alone (%)
Household type by relationship - Female householder living alone (%)
Household type by relationship - Female householder not living alone (%)
Household type by relationship - Opposite-Sex spouse (%)
Household type by relationship - Same-Sex spouse (%)
Household type by relationship - Opposite-Sex unmarried partner (%)
Household type by relationship - Same-Sex unmarried partner (%)
Household type by relationship - In group quarters (%)
Size of family households - 2-person household (%)
Size of family households - 3-person household (%)
Size of family households - 4-person household (%)
Size of family households - 5-person household (%)
Size of family households - 6-person household (%)
Size of family households - 7-or-more-person household (%)
Size of nonfamily households - 1-person household (%)
Size of nonfamily households - 2-person household (%)
Size of nonfamily households - 3-person household (%)
Size of nonfamily households - 4-person household (%)
Size of nonfamily households - 5-person household (%)
Size of nonfamily households - 6-person household (%)
Size of nonfamily households - 7-or-moreperson household (%)
Year house built - Built 2010 or later (%)
Year house built - Built 2000 to 2009 (%)
Year house built - Built 1990 to 1999 (%)
Year house built - Built 1980 to 1989 (%)
Year house built - Built 1970 to 1979 (%)
Year house built - Built 1960 to 1969 (%)
Year house built - Built 1950 to 1959 (%)
Year house built - Built 1940 to 1949 (%)
Year house built - Built 1939 or earlier (%)
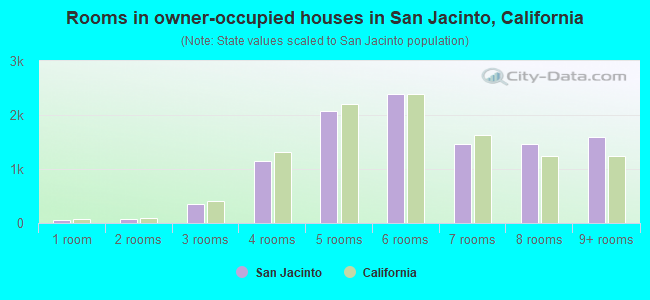
Median number of rooms in houses and condos
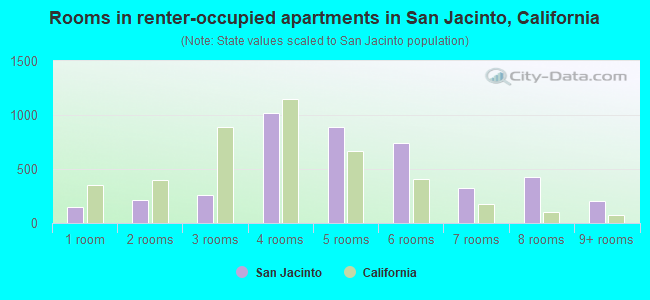
Median number of rooms in apartments
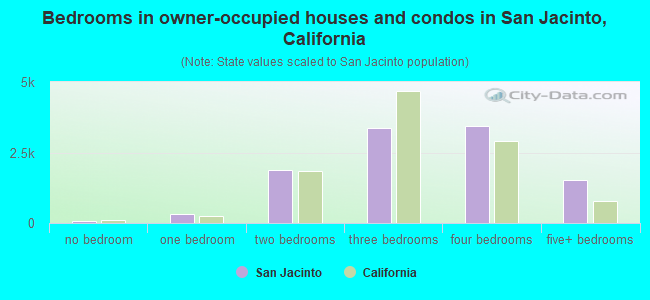
Median number of bedrooms in owner occupied houses
Mean number of bedrooms in owner occupied houses
Median number of bedrooms in renter occupied houses
Mean number of bedrooms in renter occupied houses
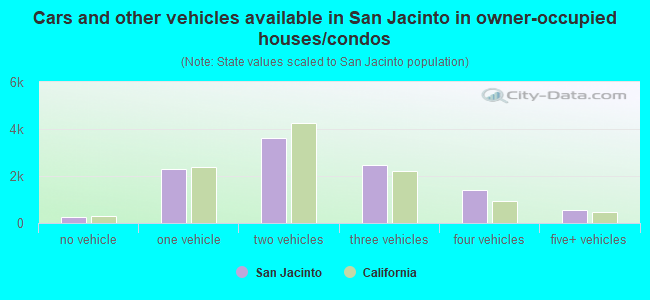
Median number of vehichles in owner occupied houses
Mean number of vehichles in owner occupied houses
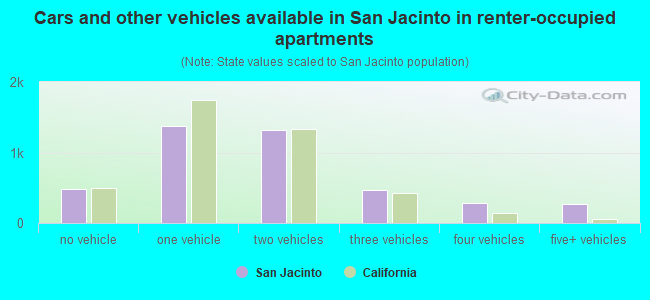
Median number of vehichles in renter occupied houses
Mean number of vehichles in renter occupied houses
Rooms in owner-occupied houses - 1 room (%)
Rooms in owner-occupied houses - 2 rooms (%)
Rooms in owner-occupied houses - 3 rooms (%)
Rooms in owner-occupied houses - 4 rooms (%)
Rooms in owner-occupied houses - 5 rooms (%)
Rooms in owner-occupied houses - 6 rooms (%)
Rooms in owner-occupied houses - 7 rooms (%)
Rooms in owner-occupied houses - 8 rooms (%)
Rooms in owner-occupied houses - 9+ rooms (%)
Rooms in renter-occupied houses - 1 room (%)
Rooms in renter-occupied houses - 2 rooms (%)
Rooms in renter-occupied houses - 3 rooms (%)
Rooms in renter-occupied houses - 4 rooms (%)
Rooms in renter-occupied houses - 5 rooms (%)
Rooms in renter-occupied houses - 6 rooms (%)
Rooms in renter-occupied houses - 7 rooms (%)
Rooms in renter-occupied houses - 8 rooms (%)
Rooms in renter-occupied houses - 9+ rooms (%)
Bedrooms in owner-occupied houses - no bedrooms (%)
Bedrooms in owner-occupied houses - 1 bedroom (%)
Bedrooms in owner-occupied houses - 2 bedrooms (%)
Bedrooms in owner-occupied houses - 3 bedrooms (%)
Bedrooms in owner-occupied houses - 4 bedrooms (%)
Bedrooms in owner-occupied houses - 5+ bedrooms (%)
Bedrooms in renter-occupied houses - no bedrooms (%)
Bedrooms in renter-occupied houses - 1 bedroom (%)
Bedrooms in renter-occupied houses - 2 bedrooms (%)
Bedrooms in renter-occupied houses - 3 bedrooms (%)
Bedrooms in renter-occupied houses - 4 bedrooms (%)
Bedrooms in renter-occupied houses - 5+ bedrooms (%)
Vehicles available in owner-occupied houses - no vehicle available (%)
Vehicles available in owner-occupied houses - 1 vehicle available(%)
Vehicles available in owner-occupied houses - 2 Vehicles available (%)
Vehicles available in owner-occupied houses - 3 Vehicles available (%)
Vehicles available in owner-occupied houses - 4 Vehicles available (%)
Vehicles available in owner-occupied houses - 5+ Vehicles available (%)
Vehicles available in renter-occupied houses - no vehicle available (%)
Vehicles available in renter-occupied houses - 1 vehicle available (%)
Vehicles available in renter-occupied houses - 2 Vehicles available (%)
Vehicles available in renter-occupied houses - 3 Vehicles available (%)
Vehicles available in renter-occupied houses - 4 Vehicles available (%)
Vehicles available in renter-occupied houses - 5+ Vehicles available (%)
Housing units in structures - 1, detached (%)
Housing units in structures - 1, attached (%)
Housing units in structures - 2 (%)
Housing units in structures - 3 or 4 (%)
Housing units in structures - 5 to 9 (%)
Housing units in structures - 10 to 19 (%)
Housing units in structures - 20 to 49 (%)
Housing units in structures - 50 or more (%)
Housing units in structures - Mobile home (%)
Housing units in structures - Boat, RV, van, etc. (%)
Housing units in structures - Owners - 1, detached (%)
Housing units in structures - Owners - 1, attached (%)
Housing units in structures - Owners - 2 (%)
Housing units in structures - Owners - 3 or 4 (%)
Housing units in structures - Owners - 5 to 9 (%)
Housing units in structures - Owners - 10 to 19 (%)
Housing units in structures - Owners - 20 to 49 (%)
Housing units in structures - Owners - 50 or more (%)
Housing units in structures - Owners - Mobile home (%)
Housing units in structures - Owners - Boat, RV, van, etc. (%)
Housing units in structures - Renters - 1, detached (%)
Housing units in structures - Renters - 1, attached (%)
Housing units in structures - Renters - 2 (%)
Housing units in structures - Renters - 3 or 4 (%)
Housing units in structures - Renters - 5 to 9 (%)
Housing units in structures - Renters - 10 to 19 (%)
Housing units in structures - Renters - 20 to 49 (%)
Housing units in structures - Renters - 50 or more (%)
Housing units in structures - Renters - Mobile home (%)
Housing units in structures - Renters - Boat, RV, van, etc. (%)
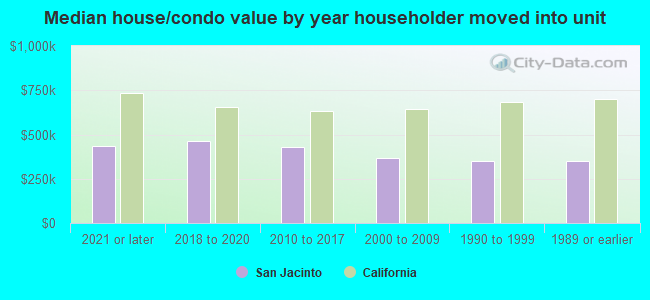
House/condo owner moved in on average (years ago)
Renter moved in on average (years ago)
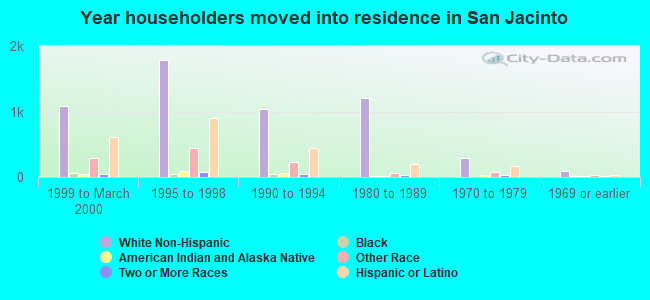
Year householder moved into unit - Moved in 1999 to March 2000 (%)
Year householder moved into unit - Moved in 1999 to March 2000 (%) - White
Year householder moved into unit - Moved in 1999 to March 2000 (%) - Black or African American
Year householder moved into unit - Moved in 1999 to March 2000 (%) - Asian
Year householder moved into unit - Moved in 1999 to March 2000 (%) - Hispanic or Latino
Year householder moved into unit - Moved in 1999 to March 2000 (%) - American Indian and Alaska Native
Year householder moved into unit - Moved in 1999 to March 2000 (%) - Multirace
Year householder moved into unit - Moved in 1999 to March 2000 (%) - Other Race
Year householder moved into unit - Moved in 1995 to 1998 (%)
Year householder moved into unit - Moved in 1995 to 1998 (%) - White
Year householder moved into unit - Moved in 1995 to 1998 (%) - Black or African American
Year householder moved into unit - Moved in 1995 to 1998 (%) - Asian
Year householder moved into unit - Moved in 1995 to 1998 (%) - Hispanic or Latino
Year householder moved into unit - Moved in 1995 to 1998 (%) - American Indian and Alaska Native
Year householder moved into unit - Moved in 1995 to 1998 (%) - Multirace
Year householder moved into unit - Moved in 1995 to 1998 (%) - Other Race
Year householder moved into unit - Moved in 1990 to 1994 (%)
Year householder moved into unit - Moved in 1990 to 1994 (%) - White
Year householder moved into unit - Moved in 1990 to 1994 (%) - Black or African American
Year householder moved into unit - Moved in 1990 to 1994 (%) - Asian
Year householder moved into unit - Moved in 1990 to 1994 (%) - Hispanic or Latino
Year householder moved into unit - Moved in 1990 to 1994 (%) - American Indian and Alaska Native
Year householder moved into unit - Moved in 1990 to 1994 (%) - Multirace
Year householder moved into unit - Moved in 1990 to 1994 (%) - Other Race
Year householder moved into unit - Moved in 1980 to 1989 (%)
Year householder moved into unit - Moved in 1980 to 1989 (%) - White
Year householder moved into unit - Moved in 1980 to 1989 (%) - Black or African American
Year householder moved into unit - Moved in 1980 to 1989 (%) - Asian
Year householder moved into unit - Moved in 1980 to 1989 (%) - Hispanic or Latino
Year householder moved into unit - Moved in 1980 to 1989 (%) - American Indian and Alaska Native
Year householder moved into unit - Moved in 1980 to 1989 (%) - Multirace
Year householder moved into unit - Moved in 1980 to 1989 (%) - Other Race
Year householder moved into unit - Moved in 1970 to 1979 (%)
Year householder moved into unit - Moved in 1970 to 1979 (%) - White
Year householder moved into unit - Moved in 1970 to 1979 (%) - Black or African American
Year householder moved into unit - Moved in 1970 to 1979 (%) - Asian
Year householder moved into unit - Moved in 1970 to 1979 (%) - Hispanic or Latino
Year householder moved into unit - Moved in 1970 to 1979 (%) - American Indian and Alaska Native
Year householder moved into unit - Moved in 1970 to 1979 (%) - Multirace
Year householder moved into unit - Moved in 1970 to 1979 (%) - Other Race
Year householder moved into unit - Moved in 1969 or earlier (%)
Year householder moved into unit - Moved in 1969 or earlier (%) - White
Year householder moved into unit - Moved in 1969 or earlier (%) - Black or African American
Year householder moved into unit - Moved in 1969 or earlier (%) - Asian
Year householder moved into unit - Moved in 1969 or earlier (%) - Hispanic or Latino
Year householder moved into unit - Moved in 1969 or earlier (%) - American Indian and Alaska Native
Year householder moved into unit - Moved in 1969 or earlier (%) - Multirace
Year householder moved into unit - Moved in 1969 or earlier (%) - Other Race
Housing units lacking complete plumbing facilities (%)
Housing units lacking complete kitchen facilities (%)
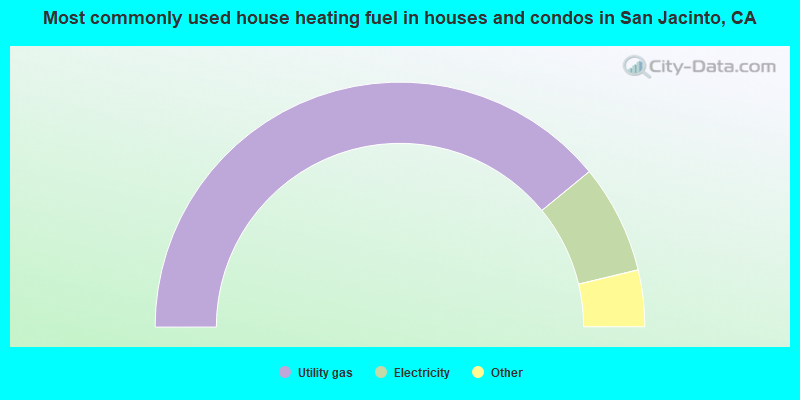
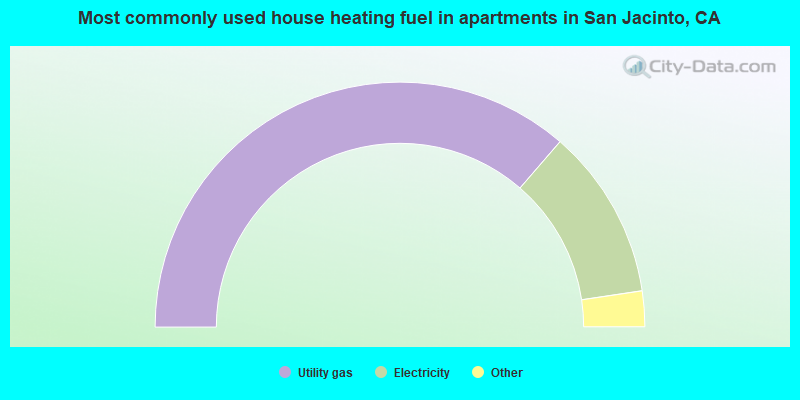
House heating fuel used in houses and condos - Utility gas (%)
House heating fuel used in houses and condos - Bottled, tank, or LP gas (%)
House heating fuel used in houses and condos - Electricity (%)
House heating fuel used in houses and condos - Fuel oil, kerosene, etc. (%)
House heating fuel used in houses and condos - Coal or coke (%)
House heating fuel used in houses and condos - Wood (%)
House heating fuel used in houses and condos - Solar energy (%)
House heating fuel used in houses and condos - Other fuel (%)
House heating fuel used in houses and condos - No fuel used (%)
House heating fuel used in apartments - Utility gas (%)
House heating fuel used in apartments - Bottled, tank, or LP gas (%)
House heating fuel used in apartments - Electricity (%)
House heating fuel used in apartments - Fuel oil, kerosene, etc. (%)
House heating fuel used in apartments - Coal or coke (%)
House heating fuel used in apartments - Wood (%)
House heating fuel used in apartments - Solar energy (%)
House heating fuel used in apartments - Other fuel (%)
House heating fuel used in apartments - No fuel used (%)
Median year house/condo built: 2003Median year apartment built: 1985Household type by relationship:
Households: 55,065
Male householders: 7,262 (982 living alone ), Female householders: 7,427 (1,272 living alone )7,747 spouses (7,688 opposite-sex spouses ), 1,022 unmarried partners , (1,012 opposite-sex unmarried partners ), 21,934 children (19,638 natural , 854 adopted , 1,441 stepchildren ), 2,292 grandchildren , 1,230 brothers or sisters , 1,591 parents , 366 foster children , 1,767 other relatives , 2,185 non-relatives In group quarters: 238
Size of family households: 2,862 2-persons , 2,422 3-persons , 2,461 4-persons , 2,083 5-persons , 902 6-persons , 1,032 7-or-more-persons .
Size of nonfamily households: 2,186 1-person , 600 2-persons , 107 3-persons , 111 4-persons , 74 5-persons .
8,432 married couples with children. single-parent households (1,634 men , 2,791 women ).
56.1% of residents of San Jacinto speak English at home. of residents speak Spanish at home (69% speak English very well , 16% speak English well , 9% speak English not well , 6% don't speak English at all ).of residents speak other Indo-European language at home (60% speak English very well , 26% speak English well , 14% speak English not well ).of residents speak Asian or Pacific Island language at home (73% speak English very well , 21% speak English well , 6% speak English not well ).of residents speak other language at home (78% speak English very well , 9% speak English well , 10% speak English not well , 4% don't speak English at all ).
Foreign born population: 9,677 (17.6%)of them are naturalized citizens )
Median number of rooms in houses and condos:
Median number of rooms in apartments
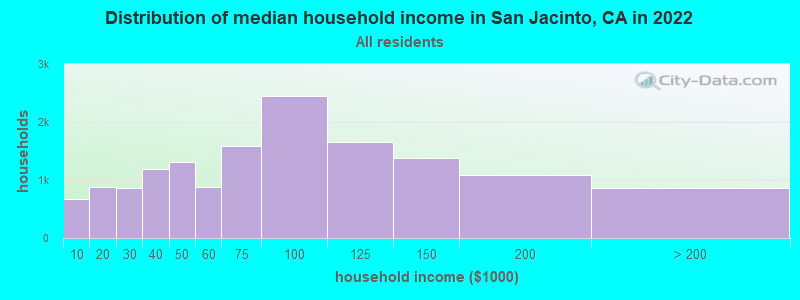
San Jacinto, CA household income distribution 672 Less than $10,000883 $10,000 to $19,999859 $20,000 to $29,9991,182 $30,000 to $39,9991,306 $40,000 to $49,999878 $50,000 to $59,9991,580 $60,000 to $74,9992,445 $75,000 to $99,9991,658 $100,000 to $124,9991,371 $125,000 to $149,9991,092 $150,000 to $199,999858 $200,000 or more
Home value of owner - occupied houses in 2022 in San Jacinto, CA 207 Less than $10,00084 $10,000 to $14,99918 $15,000 to $19,99972 $20,000 to $24,99939 $25,000 to $29,99961 $30,000 to $34,99927 $35,000 to $39,999318 $40,000 to $49,999142 $50,000 to $59,999154 $60,000 to $69,99969 $70,000 to $79,99973 $80,000 to $89,99924 $90,000 to $99,999148 $100,000 to $124,99971 $125,000 to $149,999104 $150,000 to $174,99991 $175,000 to $199,999362 $200,000 to $249,999665 $250,000 to $299,9991,980 $300,000 to $399,9991,834 $400,000 to $499,9991,020 $500,000 to $749,999294 $750,000 to $999,999158 $1,000,000 to $1,499,99981 $1,500,000 to $1,999,99959 $2,000,000 or moreRent paid by renters in 2022 in San Jacinto, CA 109 $200 to $2492 $250 to $29926 $400 to $44915 $450 to $499133 $500 to $54939 $550 to $59952 $600 to $64955 $650 to $69977 $700 to $74912 $750 to $799603 $800 to $899212 $900 to $999724 $1,000 to $1,249433 $1,250 to $1,499929 $1,500 to $1,999461 $2,000 to $2,49977 $2,500 to $2,999190 No cash rent
Percentage of workers working in this county: 78.8%Number of people working at home: 2,200 (9.8% of all workers )
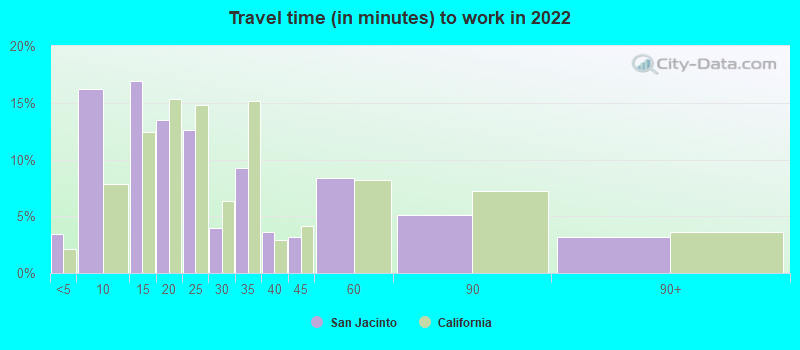
Travel time to work (commute)
Less than 5 minutes: 5055 to 9 minutes: 1,86810 to 14 minutes: 1,61515 to 19 minutes: 1,58220 to 24 minutes: 1,43925 to 29 minutes: 95230 to 34 minutes: 2,33935 to 39 minutes: 98640 to 44 minutes: 1,03045 to 59 minutes: 2,50460 to 89 minutes: 2,63490 or more minutes: 2,396
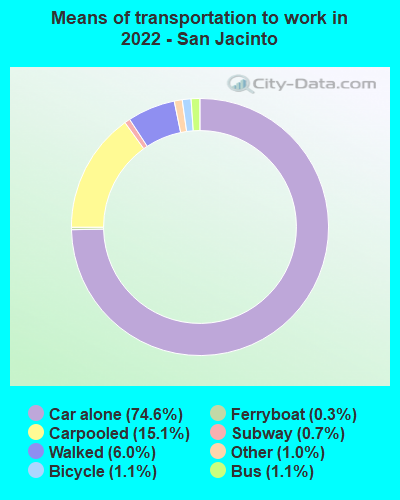
Means of transportation to work:
Drove a car alone: 6,736 (60.3%)Carpooled: 1,474 (13.2%)Bus : 87 (0.8%)Long-distance train or commuter rail : 41 (0.4%)Ferryboat: 24 (0.2%)Taxi: 96 (0.9%)Bicycle: 145 (1.3%)Walked: 542 (4.9%)Worked at home: 2,200 (19.7%)
Unemployment by race in 2022
Unemployment rate for White non-Hispanic residents 1.7% Males6.2% FemalesUnemployment rate for Black residents 6.9% Males3.3% FemalesUnemployment rate for other race residents 6.2% Males7.9% FemalesUnemployment rate for two or more race residents 7.7% Males11.2% FemalesUnemployment rate for Hispanic or Latino residents 7.2% Males10.3% Females
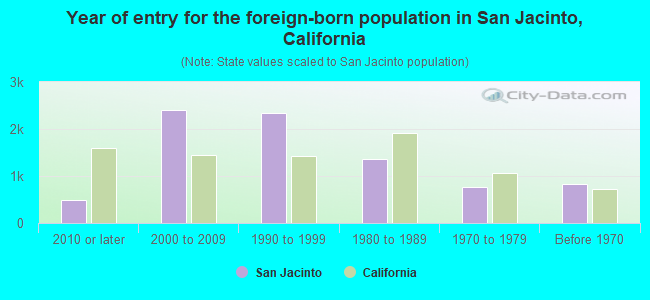
Year of entry for the foreign-born population in San Jacinto, California
500 2010 or later 2,403 2000 to 2009 2,330 1990 to 1999 1,355 1980 to 1989 764 1970 to 1979 820 Before 1970
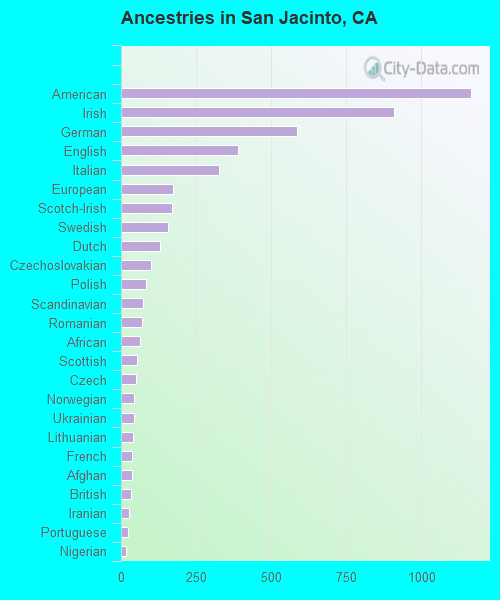
First ancestries reported:
American: 1,168 (3.7%)
Irish: 909 (2.9%)
German: 587 (1.9%)
English: 391 (1.2%)
Italian: 325 (1.0%)
European: 172 (0.5%)
Scotch-Irish: 169 (0.5%)
Swedish: 157 (0.5%)
Dutch: 130 (0.4%)
Czechoslovakian: 101 (0.3%)
Polish: 84 (0.3%)
Scandinavian: 72 (0.2%)
Romanian: 69 (0.2%)
African: 63 (0.2%)
Scottish: 52 (0.2%)
Czech: 49 (0.2%)
Norwegian: 44 (0.1%)
Ukrainian: 44 (0.1%)
Lithuanian: 40 (0.1%)
French: 36 (0.1%)
Afghan: 36 (0.1%)
British: 32 (0.1%)
Iranian: 28 (0.09%)
Portuguese: 23 (0.07%)
Nigerian: 18 (0.06%)
Pennsylvania German: 17 (0.05%)
Egyptian: 17 (0.05%)
Jamaican: 17 (0.05%)
West Indian: 16 (0.05%)
Northern European: 15 (0.05%)
Hungarian: 13 (0.04%)
Russian: 12 (0.04%)
Danish: 11 (0.04%)
Canadian: 11 (0.04%)
Lebanese: 8 (0.03%)
French Canadian: 4 (0.01%)
Armenian: 3 (0.01%) Most common places of birth for foreign-born residents (%): Mexico San Jacinto:
65.7% (6,353)California:
37.2% (3,881,193)
Philippines San Jacinto:
8.1% (784)California:
7.8% (818,297)
El Salvador San Jacinto:
5.2% (505)California:
4.2% (440,287)
Guatemala San Jacinto:
4.8% (465)California:
2.8% (290,436)
Honduras San Jacinto:
1.7% (160)California:
0.6% (66,590)
Place of birth for U.S.-born residents:
This state: 38,307Other state: 5,994Northeast: 965Midwest: 1,622South: 2,311West: 1,076 91.0% of San Jacinto residents lived in the same house 1 years ago.
Out of people who lived in different houses, 37.7% lived in this county.
Out of people who lived in different counties, 94.3% lived in California.
San Jacinto:
91.0%State average:
88.9%
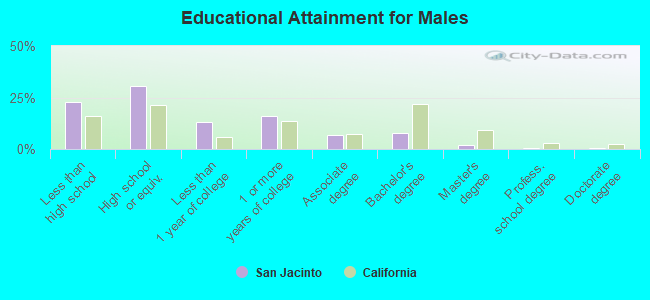
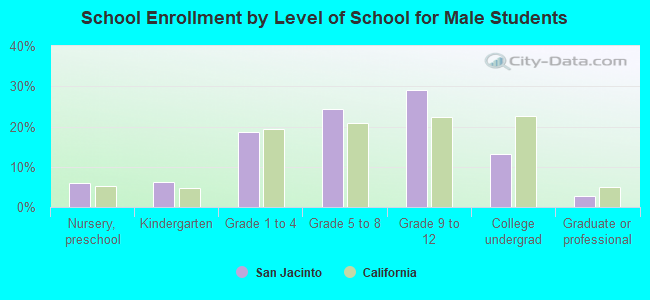
Education attainment for males 25 years and older:
No schooling: 1,033Nursery to 4th grade: 1775th and 6th grade: 5117th and 8th grade: 1839th grade: 40510th grade: 37511th grade: 32312th grade, no diploma: 721High school graduate (or equivalency): 5,029Less than 1 year of college: 2,171Some college more than 1 year, no degree: 2,593Associate degree: 1,119Bachelor's degree: 1,308Master's degree: 343Professional school degree: 58Doctorate degree: 55
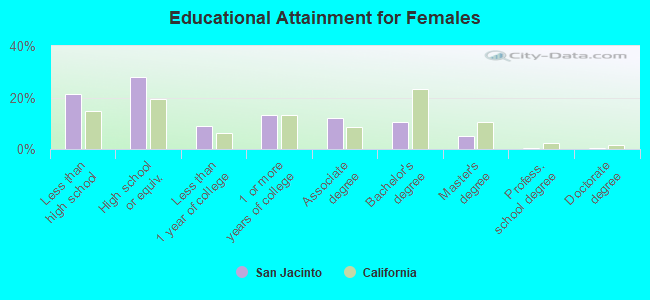
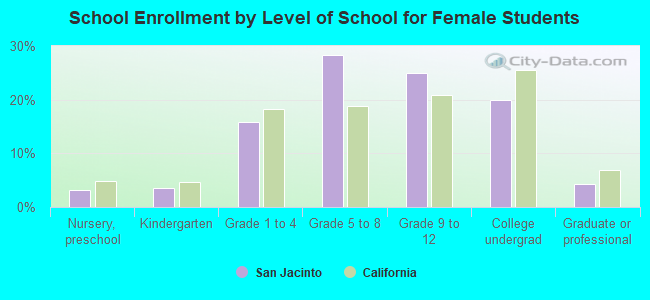
Education attainment for females 25 years and older:
No schooling: 502Nursery to 4th grade: 2125th and 6th grade: 4187th and 8th grade: 2849th grade: 39310th grade: 46011th grade: 49712th grade, no diploma: 842High school graduate (or equivalency): 4,706Less than 1 year of college: 1,530Some college more than 1 year, no degree: 2,253Associate degree: 2,037Bachelor's degree: 1,765Master's degree: 841Professional school degree: 68Doctorate degree: 44
Housing units in structures:
One, detached: 11,665One, attached: 445Two: 2623 or 4: 4675 to 9: 17110 to 19: 8820 to 49: 16350 or more: 138Mobile homes: 2,279Boats, RVs, vans, etc.: 18Median worth of mobile homes: $59,592
Housing units lacking complete plumbing facilities in 2022: 0.9%Housing units lacking complete kitchen facilities in 2022: 2.8%House/condo owner moved in on average 8 years ago
Renter moved in on average 3 years ago
Private vs. public school enrollment:
Students in private schools in grades 1 to 8 (elementary and middle school): 334 Here:
4.8%California:
10.5%
Students in private schools in grades 9 to 12 (high school): 94 Students in private undergraduate colleges: 305 Here:
11.4%California:
15.9%