San Jose, IL (Illinois) Houses and Residents
| San Jose: | $66,399 |
| Illinois: | $251,600 |
Mean price in 2022:
Detached houses: $90,108
Here: $90,108 State: $310,164 Mobile homes: $23,079
Here: $23,079 State: $78,855
Total population: 619 (Urban population: 0, Rural population: 717 (all nonfarm))
Houses: 261 (247 occupied: 223 owner occupied, 26 renter occupied)
| % of renters here: | 10% |
| State: | 33% |
Housing density: 510 houses/condos per square mile
Median price asked for vacant for-sale houses and condos in 2022 in this county: $70,031.
Median contract rent in 2022: $540 (lower quartile is $518, upper quartile is $641)
Median rent asked for vacant for-rent units in 2022: $501
Median gross rent in San Jose, IL in 2022: $910
Housing units in San Jose with a mortgage: 140 (7 second mortgage, 0 home equity loan, 3 both second mortgage and home equity loan)
Houses without a mortgage: 8
Median household income for houses/condos with a mortgage: $67,307
Median household income for apartments without a mortgage: $48,666
Median monthly housing costs: $794
Compare current foreclosures near San Jose, IL:
| Photo | Address | Area | Beds / Baths | Price | Details |
|---|---|---|---|---|---|

|
#1
2nd St
Pekin, IL 61554
|
1,058 sq. feet
|
1 baths 3 beds |
$124,900
|
show details |

|
#2
N Main St
Lincoln, IL 62656
|
784 sq. feet
|
1 baths 2 beds |
$117,900
|
show details |

|
#3
N Ottawa St
Lincoln, IL 62656
|
- sq. feet
|
1 baths 3 beds |
$55,000
|
show details |

|
#4
N Anson St
Middletown, IL 62666
|
3,114 sq. feet
|
2 baths 3 beds |
show details | |

|
#5
Parkfield Dr
Pekin, IL 61554
|
2,123 sq. feet
|
2 baths 3 beds |
show details | |

|
#6
E 7th St
Delavan, IL 61734
|
1,064 sq. feet
|
1 baths 2 beds |
show details | |

|
#7
W 5th St
Delavan, IL 61734
|
- sq. feet
|
- baths - beds |
$63,600
|
show details |

|
#8
E Pine St
Mason City, IL 62664
|
3,960 sq. feet
|
3 baths 4 beds |
show details | |

|
#9
Memory Ln
Pekin, IL 61554
|
1,200 sq. feet
|
1 baths 3 beds |
show details | |

|
#10
Sunset Blvd
Green Valley, IL 61534
|
1,647 sq. feet
|
2 baths 3 beds |
show details |
| Photo | Address | Area | Beds / Baths | Price | Details |
|---|---|---|---|---|---|

|
#11
Highwood Ave
Pekin, IL 61554
|
2,055 sq. feet
|
2 baths 3 beds |
show details | |

|
#12
Ivy Ln
Tremont, IL 61568
|
1,232 sq. feet
|
2 baths 3 beds |
show details | |

|
#13
S Monroe St
Armington, IL 61721
|
1,075 sq. feet
|
1 baths 3 beds |
show details | |

|
#14
North St
Armington, IL 61721
|
1,120 sq. feet
|
1 baths 3 beds |
show details | |

|
#15
Sierra Ct
Pekin, IL 61554
|
1,650 sq. feet
|
1 baths 3 beds |
show details | |

|
#16
N Keefer St
Mason City, IL 62664
|
- sq. feet
|
2 baths 2 beds |
show details | |

|
#17
Townline Rd
Green Valley, IL 61534
|
2,186 sq. feet
|
1 baths 3 beds |
show details | |

|
#18
1275th Ave
Armington, IL 61721
|
- sq. feet
|
- baths - beds |
show details | |

|
#19
N Logan St
Lincoln, IL 62656
|
- sq. feet
|
- baths - beds |
show details | |

|
#20
Lincoln St
Emden, IL 62635
|
- sq. feet
|
- baths - beds |
show details |
| Photo | Address | Area | Beds / Baths | Price | Details |
|---|---|---|---|---|---|

|
#21
Wichita Ave
Lincoln, IL 62656
|
- sq. feet
|
- baths - beds |
show details | |

|
#22
8th St
Lincoln, IL 62656
|
- sq. feet
|
- baths - beds |
show details | |

|
#23
1500th St
Lincoln, IL 62656
|
- sq. feet
|
- baths - beds |
show details | |

|
#24
S Hamilton St
Lincoln, IL 62656
|
- sq. feet
|
- baths - beds |
show details | |

|
#25
W Arch St
Mason City, IL 62664
|
- sq. feet
|
- baths - beds |
show details | |

|
#26
N Main St
Mason City, IL 62664
|
- sq. feet
|
- baths - beds |
show details | |

|
#27
Florentine Ct
Pekin, IL 61554
|
- sq. feet
|
- baths - beds |
show details | |

|
#28
Wiseman Rd
Pekin, IL 61554
|
- sq. feet
|
- baths - beds |
show details | |

|
#29
E 4th St
Delavan, IL 61734
|
- sq. feet
|
- baths - beds |
show details | |

|
#30
Birkett St
South Pekin, IL 61564
|
- sq. feet
|
- baths - beds |
show details |
| Photo | Address | Area | Beds / Baths | Price | Details |
|---|---|---|---|---|---|

|
#31
Hopedale Rd
Hopedale, IL 61747
|
- sq. feet
|
- baths - beds |
show details | |

|
#32
1st St
Pekin, IL 61554
|
- sq. feet
|
- baths - beds |
show details | |

|
#33
Omaha Ave
Lincoln, IL 62656
|
- sq. feet
|
- baths - beds |
show details | |

|
#34
N Mclean St
Lincoln, IL 62656
|
- sq. feet
|
- baths - beds |
show details | |

|
#35
N Mclean St
Lincoln, IL 62656
|
- sq. feet
|
- baths - beds |
show details | |

|
#36
E Myrtle St
Mason City, IL 62664
|
- sq. feet
|
- baths - beds |
show details | |

|
#37
S Elm St
Lincoln, IL 62656
|
- sq. feet
|
- baths - beds |
show details | |

|
#38
N Kankakee St
Lincoln, IL 62656
|
- sq. feet
|
- baths - beds |
show details | |

|
#39
N Tonica St
Mason City, IL 62664
|
- sq. feet
|
- baths - beds |
show details | |

|
#40
N Main St
Mason City, IL 62664
|
- sq. feet
|
- baths - beds |
show details |
| Photo | Address | Area | Beds / Baths | Price | Details |
|---|---|---|---|---|---|

|
#41
S Park Ave
Manito, IL 61546
|
- sq. feet
|
- baths - beds |
show details | |

|
#42
E Meadow Lawn St
Manito, IL 61546
|
- sq. feet
|
- baths - beds |
show details | |

|
#43
N Morgan St
Mason City, IL 62664
|
- sq. feet
|
- baths - beds |
show details | |

|
#44
Southgate St
Lincoln, IL 62656
|
- sq. feet
|
- baths - beds |
show details | |

|
Check over 1 million property listings on Foreclosure.com!
|
browse all offers | |||


Median year apartment built: 1954
Household type by relationship:
Households: 605- Male householders: 110 (9 living alone), Female householders: 132 (42 living alone)
135 spouses (135 opposite-sex spouses), 25 unmarried partners, (25 opposite-sex unmarried partners), 172 children (170 natural, 0 adopted, 1 stepchildren), 7 grandchildren, 0 brothers or sisters, 4 parents, 7 foster children, 3 other relatives, 3 non-relatives
Size of family households: 87 2-persons, 53 3-persons, 31 4-persons, 9 5-persons, 4 6-persons.
Size of nonfamily households: 55 1-person, 8 2-persons.
93 married couples with children.
27 single-parent households (19 men, 8 women).
98.1% of residents of San Jose speak English at home.
0.5% of residents speak Spanish at home (100% speak English very well).
0.3% of residents speak other Indo-European language at home (100% speak English very well).
| Here: | 6.2 |
| State: | 6.4 |
| Here: | 5.8 |
| State: | 4.1 |

- Bedrooms in owner-occupied houses and condos in San Jose, Illinois
- 0no bedroom
- 91 bedroom
- 382 bedrooms
- 1453 bedrooms
- 254 bedrooms
- 75+ bedrooms

- Bedrooms in renter-occupied apartments in San Jose, Illinois
- 0no bedroom
- 21 bedroom
- 62 bedrooms
- 163 bedrooms
- 24 bedrooms
- 05+ bedrooms

- Cars and other vehicles available in San Jose in owner-occupied houses/condos
- 0no vehicle
- 611 vehicle
- 982 vehicles
- 563 vehicles
- 64 vehicles
- 35+ vehicles

- Cars and other vehicles available in San Jose in renter-occupied apartments
- 0no vehicle
- 121 vehicle
- 142 vehicles
- 03 vehicles
- 04 vehicles
- 05+ vehicles

- Rooms in owner-occupied houses in San Jose, Illinois
- 01 room
- 02 rooms
- 63 rooms
- 194 rooms
- 325 rooms
- 756 rooms
- 397 rooms
- 308 rooms
- 239+ rooms

- Rooms in renter-occupied apartments in San Jose, Illinois
- 01 room
- 02 rooms
- 23 rooms
- 14 rooms
- 25 rooms
- 196 rooms
- 07 rooms
- 08 rooms
- 29+ rooms


San Jose, IL household income distribution

- 21Less than $10,000
- 11$10,000 to $19,999
- 17$20,000 to $29,999
- 14$30,000 to $39,999
- 35$40,000 to $49,999
- 26$50,000 to $59,999
- 35$60,000 to $74,999
- 47$75,000 to $99,999
- 7$100,000 to $124,999
- 24$125,000 to $149,999
- 15$150,000 to $199,999

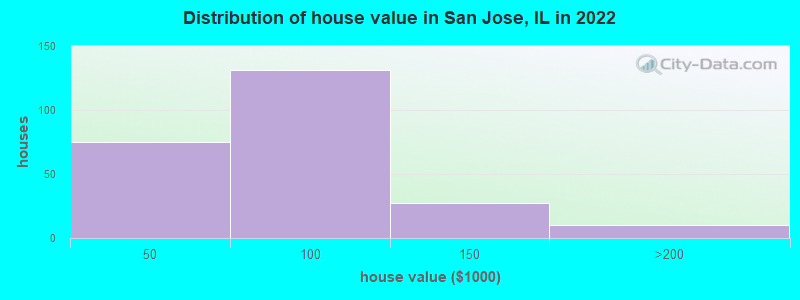
Home value of owner - occupied houses in 2022 in San Jose, IL
-
- 4Less than $10,000
- 3$10,000 to $14,999
- 11$25,000 to $29,999
- 8$30,000 to $34,999
- 18$35,000 to $39,999
- 28$40,000 to $49,999
- 20$50,000 to $59,999
- 34$60,000 to $69,999
- 16$70,000 to $79,999
- 12$80,000 to $89,999
- 17$90,000 to $99,999
- 19$100,000 to $124,999
- 7$125,000 to $149,999
- 8$150,000 to $174,999
- 1$175,000 to $199,999
Rent paid by renters in 2022 in San Jose, IL
-
- 15$500 to $549
- 7$600 to $649
- 2$650 to $699
- 2$700 to $749
- 2No cash rent


Percentage of workers working in this county: 19.9%
Number of people working at home: 15 (4.9% of all workers)
Travel time to work (commute)
- Less than 5 minutes: 23
- 5 to 9 minutes: 3
- 10 to 14 minutes: 15
- 15 to 19 minutes: 36
- 20 to 24 minutes: 48
- 25 to 29 minutes: 25
- 30 to 34 minutes: 77
- 35 to 39 minutes: 7
- 40 to 44 minutes: 7
- 45 to 59 minutes: 28
- 60 to 89 minutes: 5
- 90 or more minutes: 2
Means of transportation to work:
- Drove a car alone: 256 (80.3%)
- Carpooled: 44 (13.8%)
- Walked: 3 (0.9%)
- Other means: 5 (1.6%)
- Worked at home: 11 (3.4%)

- Unemployment by race in 2022
- Unemployment rate for White non-Hispanic residents
- 5.0%Males
- 5.0%Females
- Unemployment rate for two or more race residents
- 27.0%Males
- 100.0%Females

- Year of entry for the foreign-born population in San Jose, Illinois
- 01995 to March 2000
- 01990 to 1994
- 01985 to 1989
- 01980 to 1984
- 21975 to 1979
- 01970 to 1974
- 01965 to 1969
- 0Before 1965

First ancestries reported:
- German: 88 (34.3%)
- English: 43 (16.7%)
- American: 29 (11.3%)
- Irish: 20 (7.8%)
- Scottish: 17 (6.6%)
- Welsh: 7 (2.7%)
- French: 6 (2.3%)
- European: 2 (0.8%)
Most common places of birth for foreign-born residents (%):
| San Jose: | 100.0% (2) |
| Illinois: | 40.4% (617,828) |
Place of birth for U.S.-born residents:
- This state: 518
- Other state: 84
- Northeast: 10
- Midwest: 22
- South: 28
- West: 23
85.7% of San Jose residents lived in the same house 1 years ago.
Out of people who lived in different houses, 2.3% lived in this county.
Out of people who lived in different counties, 100.0% lived in Illinois.
| San Jose: | 85.7% |
| State average: | 88.3% |
Education attainment for males 25 years and older:
- No schooling: 2
- Nursery to 4th grade: 0
- 5th and 6th grade: 0
- 7th and 8th grade: 0
- 9th grade: 0
- 10th grade: 1
- 11th grade: 12
- 12th grade, no diploma: 4
- High school graduate (or equivalency): 105
- Less than 1 year of college: 21
- Some college more than 1 year, no degree: 8
- Associate degree: 15
- Bachelor's degree: 28
- Master's degree: 2
- Professional school degree: 7
- Doctorate degree: 0

Education attainment for females 25 years and older:
- No schooling: 3
- Nursery to 4th grade: 0
- 5th and 6th grade: 0
- 7th and 8th grade: 0
- 9th grade: 0
- 10th grade: 1
- 11th grade: 0
- 12th grade, no diploma: 7
- High school graduate (or equivalency): 101
- Less than 1 year of college: 28
- Some college more than 1 year, no degree: 26
- Associate degree: 17
- Bachelor's degree: 47
- Master's degree: 2
- Professional school degree: 0
- Doctorate degree: 0


Housing units in structures:
- One, detached: 259
- Mobile homes: 2
House/condo owner moved in on average 10 years ago
Renter moved in on average 3 years ago

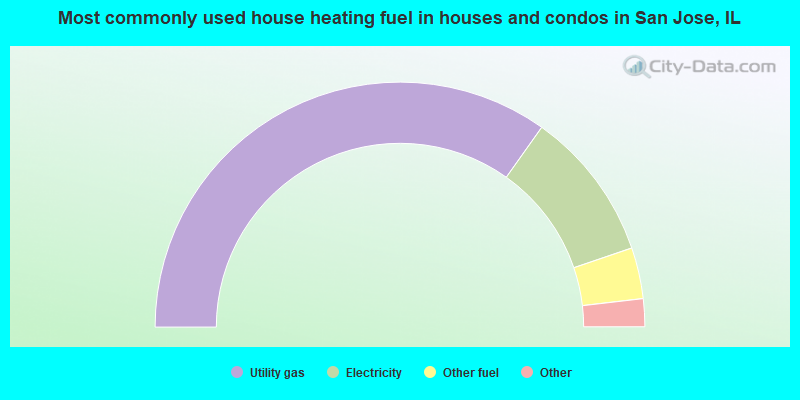
- 70.0%Utility gas
- 20.0%Electricity
- 6.8%Other fuel
- 1.8%No fuel used
- 1.4%Bottled, tank, or LP gas
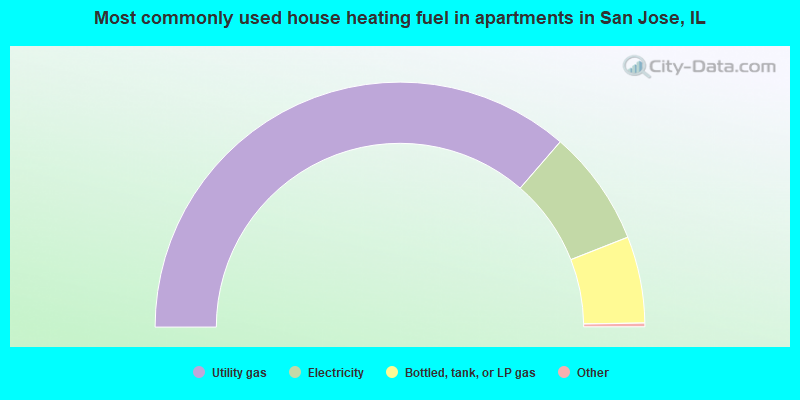
- 73.1%Utility gas
- 15.4%Electricity
- 11.5%Bottled, tank, or LP gas
Private vs. public school enrollment:
| Here: | 6.2% |
| Illinois: | 13.3% |
| Here: | 0.0% |
| Illinois: | 9.9% |
| Here: | 100.0% |
| Illinois: | 27.4% |


