Housing density: 2,313 houses/condos per square mile
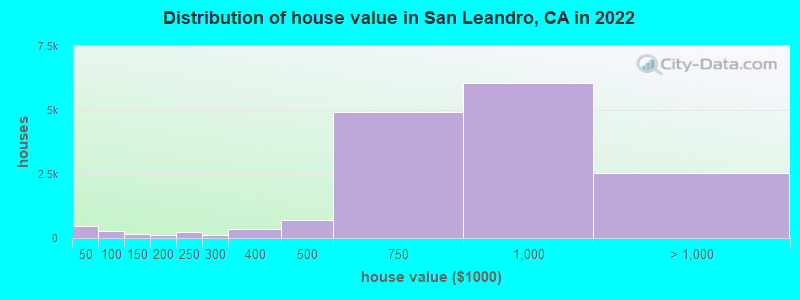
Median price asked for vacant for-sale houses and condos in 2022: $592,562.
Median contract rent in 2022: $1,893 (lower quartile is $1,553, upper quartile is over $2,000)
Median rent asked for vacant for-rent units in 2022: $1,297
Median gross rent in San Leandro, CA in 2022: over $2,000
Housing units in San Leandro with a mortgage: 11,046 (1,964 second mortgage, 55 home equity loan, 1,094 both second mortgage and home equity loan) Houses without a mortgage: 136
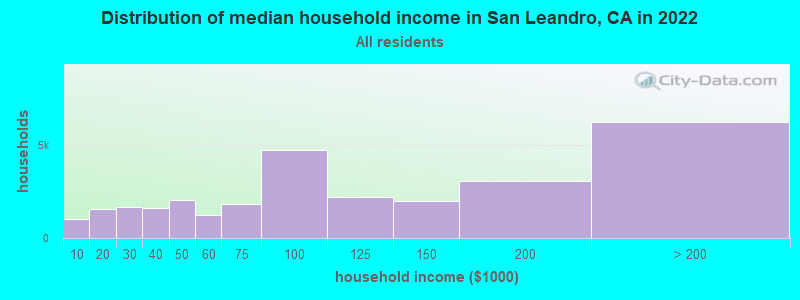
Median household income for houses/condos with a mortgage: $145,358
Median household income for apartments without a mortgage: $83,569
11,036 married couples with children.
3,200 single-parent households (204 men, 2,996 women).
47.7% of residents of San Leandro speak English at home.
20.3% of residents speak Spanish at home (53% speak English very well, 28% speak English well, 13% speak English not well, 7% don't speak English at all).
2.8% of residents speak other Indo-European language at home (62% speak English very well, 28% speak English well, 9% speak English not well, 1% don't speak English at all).
28.1% of residents speak Asian or Pacific Island language at home (42% speak English very well, 28% speak English well, 20% speak English not well, 10% don't speak English at all).
1.4% of residents speak other language at home (61% speak English very well, 23% speak English well, 14% speak English not well, 1% don't speak English at all).
Foreign born population: 38,494 (44.4%)
(62.9% of them are naturalized citizens)
Percentage of workers working in this county: 75.7% Number of people working at home: 7,441 (17.7% of all workers)
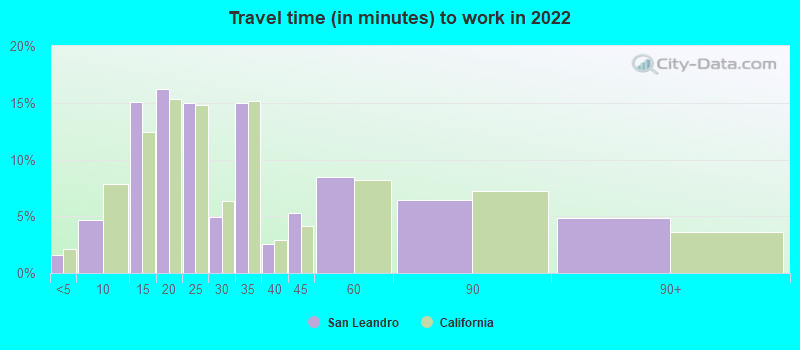
Travel time to work (commute)
Less than 5 minutes: 210
5 to 9 minutes: 1,525
10 to 14 minutes: 5,642
15 to 19 minutes: 2,593
20 to 24 minutes: 3,210
25 to 29 minutes: 1,753
30 to 34 minutes: 8,516
35 to 39 minutes: 628
40 to 44 minutes: 1,975
45 to 59 minutes: 3,496
60 to 89 minutes: 3,916
90 or more minutes: 1,109
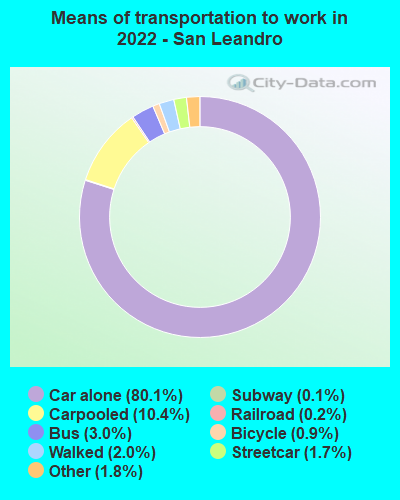
Means of transportation to work:
Drove a car alone: 27,395 (64.3%)
Carpooled: 3,710 (8.7%)
Bus: 852 (2.0%)
Subway or elevated rail: 457 (1.1%)
Long-distance train or commuter rail: 37 (0.1%)
Light rail, streetcar or trolley: 45 (0.1%)
Taxi: 638 (1.5%)
Bicycle: 329 (0.8%)
Walked: 682 (1.6%)
Worked at home: 7,078 (16.6%)
Unemployment by race in 2022
Unemployment rate for White non-Hispanic residents
4.1%Males
1.1%Females
Unemployment rate for Black residents
4.0%Males
5.6%Females
Unemployment rate for American Indian and Alaska Native residents
5.4%Males
16.8%Females
Unemployment rate for Asian residents
5.1%Males
1.1%Females
Unemployment rate for other race residents
5.3%Males
4.3%Females
Unemployment rate for two or more race residents
0.4%Males
2.0%Females
Unemployment rate for Hispanic or Latino residents
4.2%Males
3.8%Females
Year of entry for the foreign-born population in San Leandro, California
8,6202010 or later
7,7892000 to 2009
7,0971990 to 1999
7,4691980 to 1989
3,6831970 to 1979
3,130Before 1970
First ancestries reported:
American: 935 (1.7%)
Portuguese: 795 (1.4%)
Irish: 670 (1.2%)
English: 621 (1.1%)
German: 560 (1.0%)
Italian: 507 (0.9%)
European: 433 (0.8%)
African: 413 (0.7%)
Polish: 243 (0.4%)
Sudanese: 221 (0.4%)
Afghan: 197 (0.4%)
Scotch-Irish: 171 (0.3%)
French: 125 (0.2%)
Jamaican: 121 (0.2%)
Ethiopian: 98 (0.2%)
Northern European: 86 (0.2%)
Egyptian: 76 (0.1%)
Scottish: 75 (0.1%)
Norwegian: 75 (0.1%)
Cape Verdean: 74 (0.1%)
Kenyan: 66 (0.1%)
Dutch: 66 (0.1%)
Eastern European: 61 (0.1%)
Russian: 59 (0.1%)
Danish: 59 (0.1%)
French Canadian: 52 (0.09%)
Sierra Leonean: 49 (0.09%)
Croatian: 49 (0.09%)
Lithuanian: 48 (0.09%)
British: 41 (0.07%)
Belizean: 41 (0.07%)
Yugoslavian: 39 (0.07%)
Swedish: 39 (0.07%)
Maltese: 33 (0.06%)
Moroccan: 32 (0.06%)
Iranian: 32 (0.06%)
Nigerian: 29 (0.05%)
Guyanese: 27 (0.05%)
Greek: 26 (0.05%)
Canadian: 25 (0.05%)
Slovene: 25 (0.05%)
Finnish: 24 (0.04%)
Jordanian: 21 (0.04%)
Swiss: 18 (0.03%)
Trinidadian and Tobagonian: 17 (0.03%)
Czechoslovakian: 16 (0.03%)
Celtic: 14 (0.03%)
Brazilian: 13 (0.02%)
Arab: 12 (0.02%)
Australian: 12 (0.02%)
Czech: 11 (0.02%)
Scandinavian: 11 (0.02%)
Ukrainian: 11 (0.02%)
Serbian: 10 (0.02%)
Armenian: 8 (0.01%)
Romanian: 6 (0.01%)
Bulgarian: 6 (0.01%)
Most common places of birth for foreign-born residents (%):
China, excluding Hong Kong and Taiwan
San Leandro:
24.6% (8,323)
California:
6.6% (684,672)
Mexico
San Leandro:
19.5% (6,600)
California:
37.2% (3,881,193)
Philippines
San Leandro:
17.7% (5,989)
California:
7.8% (818,297)
Vietnam
San Leandro:
6.9% (2,335)
California:
4.9% (512,335)
Hong Kong
San Leandro:
4.4% (1,476)
California:
1.0% (105,215)
El Salvador
San Leandro:
3.0% (1,018)
California:
4.2% (440,287)
Korea
San Leandro:
1.7% (584)
California:
3.0% (315,248)
Place of birth for U.S.-born residents:
This state: 38,245
Other state: 8,506
Northeast: 1,665
Midwest: 2,108
South: 3,104
West: 1,629
91.4% of San Leandro residents lived in the same house 1 years ago. Out of people who lived in different houses, 38.2% lived in this county. Out of people who lived in different counties, 69.8% lived in California.
San Leandro:
91.4%
State average:
88.9%
Education attainment for males 25 years and older:
No schooling: 2,508
Nursery to 4th grade: 391
5th and 6th grade: 384
7th and 8th grade: 268
9th grade: 304
10th grade: 279
11th grade: 767
12th grade, no diploma: 1,069
High school graduate (or equivalency): 6,679
Less than 1 year of college: 1,885
Some college more than 1 year, no degree: 3,383
Associate degree: 2,093
Bachelor's degree: 7,005
Master's degree: 1,867
Professional school degree: 480
Doctorate degree: 898
Education attainment for females 25 years and older:
No schooling: 1,731
Nursery to 4th grade: 799
5th and 6th grade: 1,394
7th and 8th grade: 133
9th grade: 299
10th grade: 0
11th grade: 45
12th grade, no diploma: 1,714
High school graduate (or equivalency): 7,198
Less than 1 year of college: 1,911
Some college more than 1 year, no degree: 3,596
Associate degree: 2,617
Bachelor's degree: 7,940
Master's degree: 2,962
Professional school degree: 357
Doctorate degree: 269
Housing units in structures:
One, detached: 17,039
One, attached: 3,371
Two: 398
3 or 4: 1,316
5 to 9: 580
10 to 19: 1,607
20 to 49: 1,777
50 or more: 3,730
Mobile homes: 547
Median worth of mobile homes: $213,700
House/condo owner moved in on average 16 years ago