San Manuel, AZ (Arizona) Houses and Residents
| San Manuel: | $135,241 |
| Arizona: | $402,800 |
Mean price in 2022:
Detached houses: $146,953
Here: $146,953 State: $521,408 Mobile homes: $24,528
Here: $24,528 State: $141,516
Total population: 3,551 (All urban)
Houses: 1,813 (1,720 occupied: 1,383 owner occupied, 379 renter occupied)
| % of renters here: | 22% |
| State: | 33% |
Housing density: 87 houses/condos per square mile
Median price asked for vacant for-sale houses and condos in 2022 in this county: $311,283.
Median contract rent in 2022: $751 (lower quartile is $454, upper quartile is $820)
Median rent asked for vacant for-rent units in 2022: $1,548
Median gross rent in San Manuel, AZ in 2022: $957
Housing units in San Manuel with a mortgage: 587 (23 second mortgage, 0 home equity loan, 15 both second mortgage and home equity loan)
Houses without a mortgage: 0
Median household income for houses/condos with a mortgage: $66,876
Median household income for apartments without a mortgage: $32,118
Median monthly housing costs: $577
Compare current foreclosures near San Manuel, AZ:
| Photo | Address | Area | Beds / Baths | Price | Details |
|---|---|---|---|---|---|

|
#1
W 2nd Ave
San Manuel, AZ 85631
|
1,107 sq. feet
|
2 baths 3 beds |
show details | |

|
#2
E 5th St
San Manuel, AZ 85631
|
1,232 sq. feet
|
2 baths 3 beds |
show details | |

|
#3
W San Pedro
San Manuel, AZ 85631
|
1,053 sq. feet
|
1 baths 3 beds |
show details | |

|
#4
S Avenue A
San Manuel, AZ 85631
|
- sq. feet
|
- baths - beds |
show details | |

|
#5
W 4th Ave
San Manuel, AZ 85631
|
1,107 sq. feet
|
- baths - beds |
show details | |

|
#6
S. Avenue A
San Manuel, AZ 85631
|
- sq. feet
|
- baths - beds |
show details | |

|
#7
E Bartolo Rd
Winkelman, AZ 85192
|
1,088 sq. feet
|
2 baths 3 beds |
$219,000
|
show details |

|
#8
S Avenue B
San Manuel, AZ 85631
|
- sq. feet
|
- baths - beds |
show details | |

|
#9
S Avenue A
San Manuel, AZ 85631
|
- sq. feet
|
- baths - beds |
show details | |

|
#10
S Redington Rd
San Manuel, AZ 85631
|
- sq. feet
|
- baths - beds |
show details |
| Photo | Address | Area | Beds / Baths | Price | Details |
|---|---|---|---|---|---|

|
#11
1st St
Mammoth, AZ 85618
|
- sq. feet
|
1 baths 2 beds |
show details | |

|
#12
W Paseo Redondo
Oracle, AZ 85623
|
1,700 sq. feet
|
2 baths 3 beds |
show details | |

|
#13
West Chicalote Street
Oracle, AZ 85623
|
3,705 sq. feet
|
5 baths 4 beds |
show details | |

|
#14
E Cloud Nine Dr
Tucson, AZ 85739
|
- sq. feet
|
- baths - beds |
show details | |

|
#15
E Holiday Dr
Tucson, AZ 85739
|
1,582 sq. feet
|
- baths - beds |
show details | |

|
#16
S Rolling Hills Dr
Tucson, AZ 85739
|
- sq. feet
|
- baths - beds |
show details | |

|
#17
E Brassie Dr
Tucson, AZ 85739
|
3,717 sq. feet
|
- baths - beds |
show details | |

|
#18
N Verdugo Pl
Mammoth, AZ 85618
|
- sq. feet
|
- baths - beds |
show details | |

|
#19
W Jones Ave
Mammoth, AZ 85618
|
- sq. feet
|
- baths - beds |
show details | |

|
#20
W Chicalote St
Oracle, AZ 85623
|
- sq. feet
|
- baths - beds |
show details |
| Photo | Address | Area | Beds / Baths | Price | Details |
|---|---|---|---|---|---|

|
#21
N Verdugo Pl
Mammoth, AZ 85618
|
- sq. feet
|
- baths - beds |
show details | |

|
#22
S Vine Ave
Mammoth, AZ 85618
|
- sq. feet
|
- baths - beds |
show details | |

|
#23
W Chicalote St
Oracle, AZ 85623
|
- sq. feet
|
- baths - beds |
show details | |

|
#24
E American Ave
Oracle, AZ 85623
|
- sq. feet
|
- baths - beds |
show details | |

|
#25
S Rolfs Ave
Mammoth, AZ 85618
|
- sq. feet
|
- baths - beds |
show details | |

|
#26
E Woodpecker Ln
Tucson, AZ 85739
|
- sq. feet
|
- baths - beds |
show details | |

|
Check over 1 million property listings on Foreclosure.com!
|
browse all offers | |||


Median year apartment built: 1959
Household type by relationship:
Households: 3,786- Male householders: 985 (351 living alone), Female householders: 756 (170 living alone)
697 spouses (697 opposite-sex spouses), 254 unmarried partners, (254 opposite-sex unmarried partners), 774 children (733 natural, 0 adopted, 40 stepchildren), 107 grandchildren, 0 brothers or sisters, 59 parents, 0 foster children, 67 other relatives, 79 non-relatives
- In group quarters: 4
Size of family households: 658 2-persons, 256 3-persons, 110 4-persons, 50 5-persons, 51 6-persons, 2 7-or-more-persons.
Size of nonfamily households: 565 1-person, 97 2-persons.
274 married couples with children.
221 single-parent households (144 men, 77 women).
77.2% of residents of San Manuel speak English at home.
22.0% of residents speak Spanish at home (79% speak English very well, 14% speak English well, 7% speak English not well).
1.0% of residents speak other Indo-European language at home (100% speak English very well).
Foreign born population: 159 (4.2%)
(59.7% of them are naturalized citizens)
| Here: | 5.5 |
| State: | 6.0 |
| Here: | 5.2 |
| State: | 4.1 |

- Bedrooms in owner-occupied houses and condos in San Manuel, Arizona
- 0no bedroom
- 41 bedroom
- 3352 bedrooms
- 8643 bedrooms
- 1744 bedrooms
- 75+ bedrooms

- Bedrooms in renter-occupied apartments in San Manuel, Arizona
- 0no bedroom
- 461 bedroom
- 882 bedrooms
- 1853 bedrooms
- 614 bedrooms
- 05+ bedrooms

- Cars and other vehicles available in San Manuel in owner-occupied houses/condos
- 41no vehicle
- 4661 vehicle
- 4522 vehicles
- 1843 vehicles
- 1984 vehicles
- 415+ vehicles

- Cars and other vehicles available in San Manuel in renter-occupied apartments
- 0no vehicle
- 2221 vehicle
- 1152 vehicles
- 423 vehicles
- 04 vehicles
- 05+ vehicles

- Rooms in owner-occupied houses in San Manuel, Arizona
- 01 room
- 02 rooms
- 123 rooms
- 1264 rooms
- 5645 rooms
- 4496 rooms
- 1007 rooms
- 948 rooms
- 399+ rooms

- Rooms in renter-occupied apartments in San Manuel, Arizona
- 01 room
- 02 rooms
- 463 rooms
- 624 rooms
- 1295 rooms
- 1086 rooms
- 27 rooms
- 338 rooms
- 09+ rooms


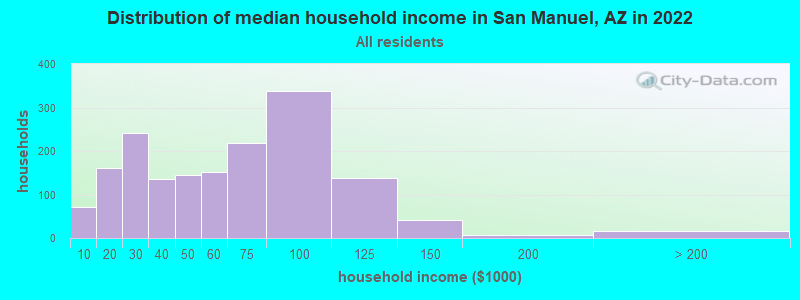
San Manuel, AZ household income distribution

- 72Less than $10,000
- 162$10,000 to $19,999
- 241$20,000 to $29,999
- 135$30,000 to $39,999
- 145$40,000 to $49,999
- 152$50,000 to $59,999
- 219$60,000 to $74,999
- 339$75,000 to $99,999
- 138$100,000 to $124,999
- 41$125,000 to $149,999
- 8$150,000 to $199,999
- 16$200,000 or more
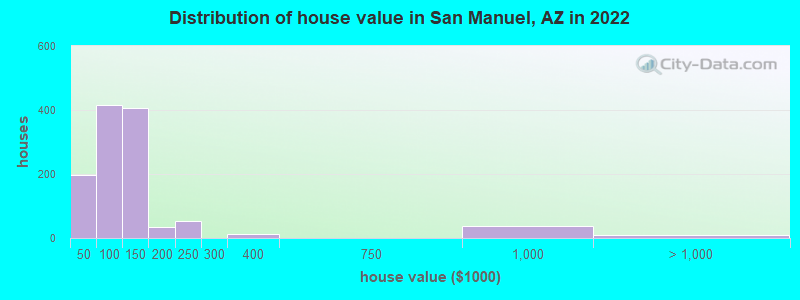
Home value of owner - occupied houses in 2022 in San Manuel, AZ
-
- 128Less than $10,000
- 21$10,000 to $14,999
- 46$40,000 to $49,999
- 43$50,000 to $59,999
- 142$60,000 to $69,999
- 51$70,000 to $79,999
- 89$80,000 to $89,999
- 44$90,000 to $99,999
- 299$100,000 to $124,999
- 105$125,000 to $149,999
- 22$150,000 to $174,999
- 12$175,000 to $199,999
- 51$200,000 to $249,999
- 13$300,000 to $399,999
- 35$750,000 to $999,999
- 8$1,000,000 to $1,499,999
Rent paid by renters in 2022 in San Manuel, AZ
-
- 141$300 to $349
- 31$400 to $449
- 6$450 to $499
- 16$500 to $549
- 6$550 to $599
- 2$600 to $649
- 63$650 to $699
- 24$750 to $799
- 5$900 to $999
- 41No cash rent

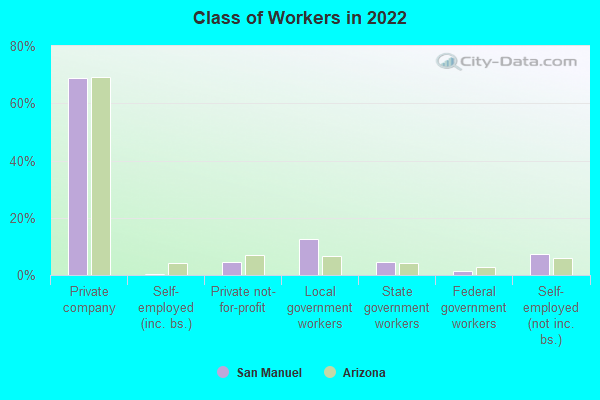
Percentage of workers working in this county: 54.2%
Number of people working at home: 22 (1.5% of all workers)
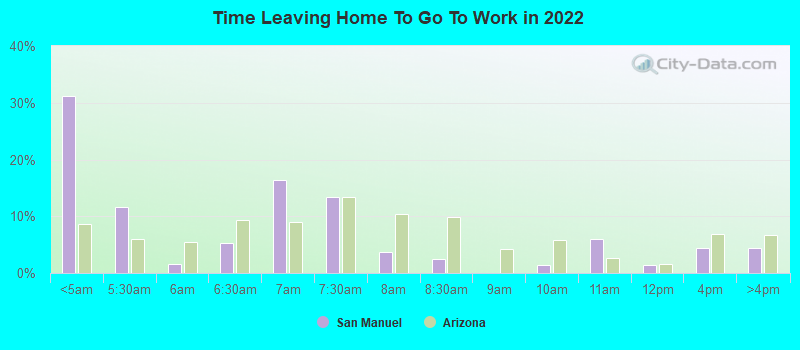
Travel time to work (commute)
- Less than 5 minutes: 13
- 5 to 9 minutes: 84
- 10 to 14 minutes: 105
- 15 to 19 minutes: 25
- 20 to 24 minutes: 31
- 25 to 29 minutes: 47
- 30 to 34 minutes: 109
- 35 to 39 minutes: 104
- 40 to 44 minutes: 87
- 45 to 59 minutes: 413
- 60 to 89 minutes: 293
- 90 or more minutes: 42
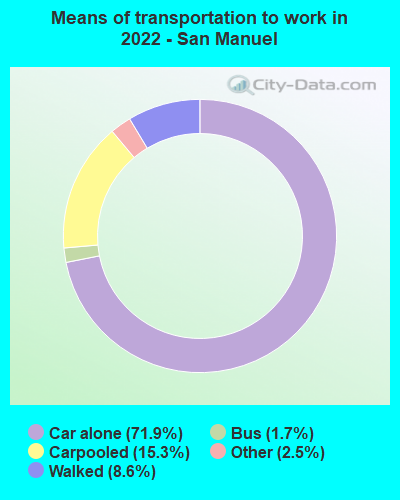
Means of transportation to work:
- Drove a car alone: 256 (56.8%)
- Carpooled: 54 (12.0%)
- Bus or trolley bus: 4 (0.9%)
- Taxi: 10 (2.2%)
- Walked: 29 (6.4%)
- Worked at home: 149 (33.0%)
- Unemployment by race in 2022
- Unemployment rate for White non-Hispanic residents
- 10.2%Females
- Unemployment rate for Hispanic or Latino residents
- 14.9%Males
- 10.2%Females

- Year of entry for the foreign-born population in San Manuel, Arizona
- 12010 or later
- 222000 to 2009
- 01990 to 1999
- 241980 to 1989
- 501970 to 1979
- 142Before 1970

First ancestries reported:
- American: 183 (8.5%)
- Irish: 136 (6.3%)
- German: 82 (3.8%)
- Polish: 32 (1.5%)
- English: 26 (1.2%)
- Scottish: 22 (1.0%)
- Italian: 19 (0.9%)
- Norwegian: 15 (0.7%)
- Scotch-Irish: 13 (0.6%)
- British: 9 (0.4%)
- Swedish: 9 (0.4%)
- African: 4 (0.2%)
- French: 3 (0.1%)
- French Canadian: 3 (0.1%)
- Nigerian: 1 (0.05%)
Most common places of birth for foreign-born residents (%):
| San Manuel: | 81.3% (113) |
| Arizona: | 53.4% (500,086) |
| San Manuel: | 13.7% (19) |
| Arizona: | 0.3% (2,667) |
Place of birth for U.S.-born residents:
- This state: 1,864
- Other state: 1,685
- Northeast: 180
- Midwest: 593
- South: 108
- West: 810
83.0% of San Manuel residents lived in the same house 1 years ago.
Out of people who lived in different houses, 41.2% lived in this county.
Out of people who lived in different counties, 63.2% lived in Arizona.
| San Manuel: | 83.0% |
| State average: | 86.0% |
Education attainment for males 25 years and older:
- No schooling: 0
- Nursery to 4th grade: 11
- 5th and 6th grade: 0
- 7th and 8th grade: 10
- 9th grade: 46
- 10th grade: 37
- 11th grade: 80
- 12th grade, no diploma: 14
- High school graduate (or equivalency): 623
- Less than 1 year of college: 229
- Some college more than 1 year, no degree: 300
- Associate degree: 77
- Bachelor's degree: 124
- Master's degree: 7
- Professional school degree: 0
- Doctorate degree: 0

Education attainment for females 25 years and older:
- No schooling: 0
- Nursery to 4th grade: 0
- 5th and 6th grade: 0
- 7th and 8th grade: 46
- 9th grade: 0
- 10th grade: 22
- 11th grade: 46
- 12th grade, no diploma: 35
- High school graduate (or equivalency): 486
- Less than 1 year of college: 193
- Some college more than 1 year, no degree: 212
- Associate degree: 124
- Bachelor's degree: 99
- Master's degree: 74
- Professional school degree: 0
- Doctorate degree: 0


Housing units in structures:
- One, detached: 1,569
- 3 or 4: 10
- Mobile homes: 233
Median worth of mobile homes: $12,891
Housing units lacking complete kitchen facilities in 2022: 0.6%
House/condo owner moved in on average 17 years ago
Renter moved in on average 4 years ago

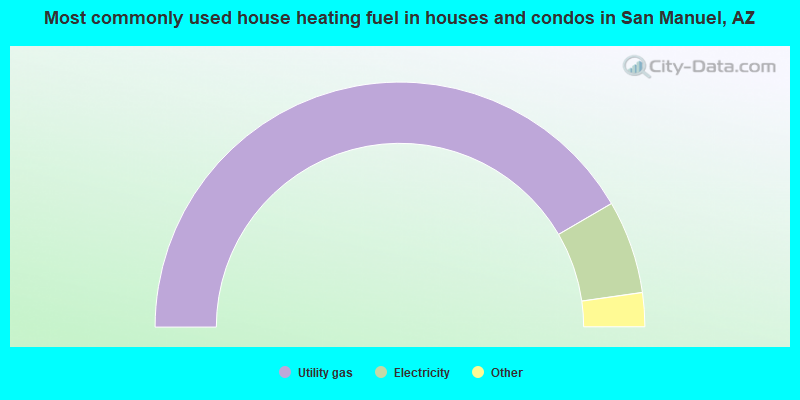
- 83.2%Utility gas
- 12.3%Electricity
- 2.4%Wood
- 1.2%No fuel used
- 0.9%Bottled, tank, or LP gas
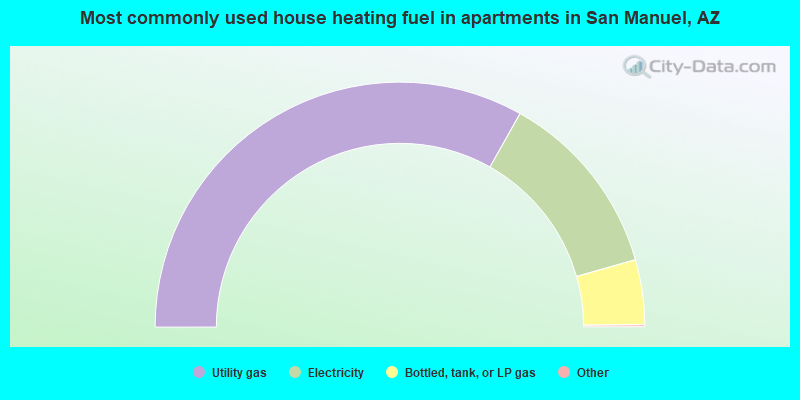
- 66.6%Utility gas
- 24.9%Electricity
- 8.6%Bottled, tank, or LP gas
Private vs. public school enrollment:
| Here: | 20.4% |
| Arizona: | 10.4% |
| Here: | 0.0% |
| Arizona: | 8.8% |
| Here: | 10.1% |
| Arizona: | 13.1% |


