Jump to a detailed profile or search site with Google Custom Search

San Marcos, CA (California) Houses and Residents

Estimated median house or condo value in 2022: $881,400 (it was $178,400 in 2000)
San Marcos:

$881,400
California:

$715,900
Lower value quartile - upper value quartile: $625,300 - $1,153,100

Mean price in 2022:

Detached houses: $972,653
Here:

$972,653
State:

$988,808

Townhouses or other attached units: $612,978
Here:

$612,978
State:

$838,546

In 3-to-4-unit structures: $660,776
Here:

$660,776
State:

$824,253

In 5-or-more-unit structures: $415,812
Here:

$415,812
State:

$730,996

Mobile homes: $258,980
Here:

$258,980
State:

$184,506

Total population: 92,929 (Urban population: 53,902, Rural population: 1,258 (all nonfarm))

Houses: 32,346 (31,301 occupied: 18,495 owner occupied, 12,806 renter occupied)

% of renters here:

41%
State:

44%

Housing density: 1,362 houses/condos per square mile

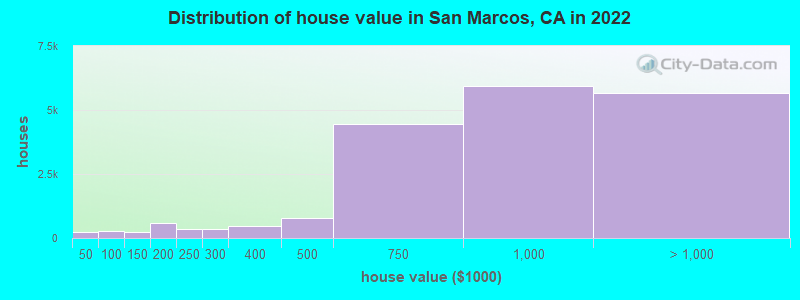
Median price asked for vacant for-sale houses and condos in 2022: $1,467,081.

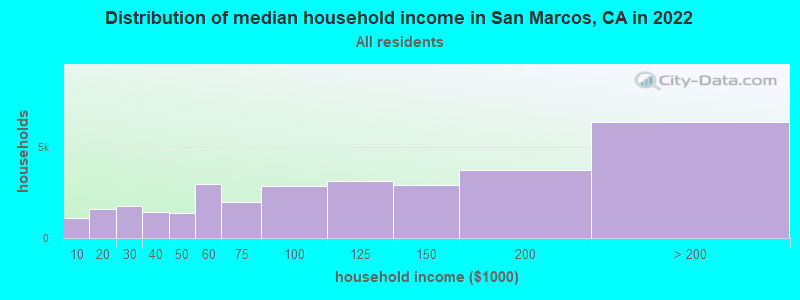
Median contract rent in 2022: $1,837 (lower quartile is $1,511, upper quartile is over $2,000)


Median rent asked for vacant for-rent units in 2022: $2,693


Median gross rent in San Marcos, CA in 2022: over $2,000

Housing units in San Marcos with a mortgage: 13,421 (1,517 second mortgage, 0 home equity loan, 1,093 both second mortgage and home equity loan)
Houses without a mortgage: 182

Median household income for houses/condos with a mortgage: $161,616

Median household income for apartments without a mortgage: $80,992

Median monthly housing costs: $2,279

Compare current foreclosures in San Marcos, CA:

Check out more offers in San Marcos, CA.
Powered by Foreclosure.com

Settings
X
Data:
Loading data...
Based on 2000-2022 data
Loading data...

123
Hide US histogram

San Marcos, California Age and Sex of Residents
Median year house/condo built: 1999

Median year apartment built: 1991

Household type by relationship:

Households: 94,855
  • Male householders: 16,338 (2,922 living alone), Female householders: 14,963 (3,449 living alone)
  • 17,312 spouses (16,939 opposite-sex spouses), 1,868 unmarried partners, (1,868 opposite-sex unmarried partners), 29,428 children (28,536 natural, 459 adopted, 433 stepchildren), 1,104 grandchildren, 1,225 brothers or sisters, 2,704 parents, 0 foster children, 2,181 other relatives, 4,473 non-relatives
  • In group quarters: 3,259

Size of family households: 7,103 2-persons, 5,493 3-persons, 6,188 4-persons, 2,674 5-persons, 427 6-persons, 673 7-or-more-persons.

Size of nonfamily households: 6,371 1-person, 1,528 2-persons, 794 3-persons, 50 6-persons.

16,554 married couples with children.
3,979 single-parent households (520 men, 3,459 women).

64.1% of residents of San Marcos speak English at home.
25.2% of residents speak Spanish at home (64% speak English very well, 15% speak English well, 15% speak English not well, 6% don't speak English at all).
3.8% of residents speak other Indo-European language at home (77% speak English very well, 18% speak English well, 3% speak English not well, 3% don't speak English at all).
5.9% of residents speak Asian or Pacific Island language at home (56% speak English very well, 24% speak English well, 18% speak English not well, 2% don't speak English at all).
0.8% of residents speak other language at home (59% speak English very well, 33% speak English well, 8% speak English not well).

Foreign born population: 20,738 (21.9%)
(54.3% of them are naturalized citizens)

Median number of rooms in houses and condos:
Here:

6.4
State:

6.0

Median number of rooms in apartments
Here:

4.2
State:

3.9

Owner-occupied Renter-occupied
Bedrooms in owner-occupied houses and condos in San Marcos, California
  • Bedrooms in owner-occupied houses and condos in San Marcos, California
  • 44no bedroom
  • 751 bedroom
  • 3,4662 bedrooms
  • 7,2113 bedrooms
  • 6,2834 bedrooms
  • 1,4165+ bedrooms
Bedrooms in renter-occupied apartments in San Marcos, California
  • Bedrooms in renter-occupied apartments in San Marcos, California
  • 943no bedroom
  • 1,9231 bedroom
  • 5,3312 bedrooms
  • 3,3183 bedrooms
  • 9244 bedrooms
  • 3675+ bedrooms
Owner-occupied Renter-occupied
Cars and other vehicles available in San Marcos in owner-occupied houses/condos
  • Cars and other vehicles available in San Marcos in owner-occupied houses/condos
  • 630no vehicle
  • 3,4651 vehicle
  • 9,7112 vehicles
  • 3,3643 vehicles
  • 9294 vehicles
  • 3965+ vehicles
Cars and other vehicles available in San Marcos in renter-occupied apartments
  • Cars and other vehicles available in San Marcos in renter-occupied apartments
  • 1,300no vehicle
  • 4,4001 vehicle
  • 4,6612 vehicles
  • 1,8943 vehicles
  • 4354 vehicles
  • 1165+ vehicles
Owner-occupied Renter-occupied
Rooms in owner-occupied houses in San Marcos, California
  • Rooms in owner-occupied houses in San Marcos, California
  • 441 room
  • 02 rooms
  • 5523 rooms
  • 3,1974 rooms
  • 3,2205 rooms
  • 2,5236 rooms
  • 3,4947 rooms
  • 2,4488 rooms
  • 3,0179+ rooms
Rooms in renter-occupied apartments in San Marcos, California
  • Rooms in renter-occupied apartments in San Marcos, California
  • 6821 room
  • 1,4002 rooms
  • 1,3293 rooms
  • 4,0584 rooms
  • 3,0065 rooms
  • 1,1326 rooms
  • 4457 rooms
  • 3568 rooms
  • 3989+ rooms
Year house built
Median 2022 house/condo value by year built
Median house/condo value by year householder moved into unit
Breakdown of mean house values by ages of householders
Owners and renters by unit type in San Marcos, CA
  • San Marcos, CA household income distribution

  • Distribution of median household income in San Marcos, CA in 2022
  • 1,085Less than $10,000
  • 1,600$10,000 to $19,999
  • 1,749$20,000 to $29,999
  • 1,429$30,000 to $39,999
  • 1,401$40,000 to $49,999
  • 2,978$50,000 to $59,999
  • 1,981$60,000 to $74,999
  • 2,877$75,000 to $99,999
  • 3,164$100,000 to $124,999
  • 2,902$125,000 to $149,999
  • 3,733$150,000 to $199,999
  • 6,402$200,000 or more
  • Home value of owner - occupied houses in 2022 in San Marcos, CA

  • Distribution of house value in San Marcos, CA in 2022
  • 15Less than $10,000
  • 34$10,000 to $14,999
  • 110$15,000 to $19,999
  • 17$20,000 to $24,999
  • 23$35,000 to $39,999
  • 26$40,000 to $49,999
  • 67$50,000 to $59,999
  • 36$60,000 to $69,999
  • 66$70,000 to $79,999
  • 34$80,000 to $89,999
  • 37$90,000 to $99,999
  • 147$100,000 to $124,999
  • 101$125,000 to $149,999
  • 245$150,000 to $174,999
  • 324$175,000 to $199,999
  • 360$200,000 to $249,999
  • 363$250,000 to $299,999
  • 464$300,000 to $399,999
  • 769$400,000 to $499,999
  • 4,434$500,000 to $749,999
  • 5,936$750,000 to $999,999
  • 4,463$1,000,000 to $1,499,999
  • 875$1,500,000 to $1,999,999
  • 320$2,000,000 or more
  • Rent paid by renters in 2022 in San Marcos, CA

  • Distribution of rent paid by renters in San Marcos, CA in 2022
  • 5Less than $100
  • 12$250 to $299
  • 63$300 to $349
  • 28$350 to $399
  • 5$400 to $449
  • 24$500 to $549
  • 35$550 to $599
  • 105$600 to $649
  • 127$650 to $699
  • 103$700 to $749
  • 225$750 to $799
  • 252$800 to $899
  • 179$900 to $999
  • 501$1,000 to $1,249
  • 1,036$1,250 to $1,499
  • 3,736$1,500 to $1,999
  • 2,101$2,000 to $2,499
  • 1,617$2,500 to $2,999
  • 588$3,000 to $3,499
  • 736$3,500 or more
  • 323No cash rent
Time Leaving Home To Go To Work in 2022

Percentage of workers working in this county: 96.7%
Number of people working at home: 9,234 (20.3% of all workers)

Travel time (in minutes) to work in 2022

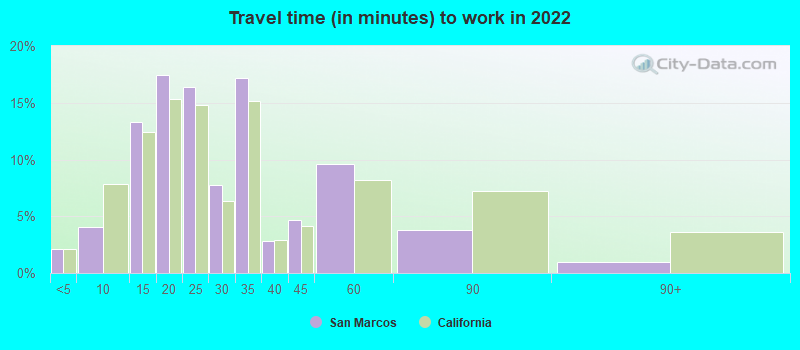
Travel time to work (commute)

  • Less than 5 minutes: 568
  • 5 to 9 minutes: 2,429
  • 10 to 14 minutes: 3,705
  • 15 to 19 minutes: 5,370
  • 20 to 24 minutes: 6,508
  • 25 to 29 minutes: 3,233
  • 30 to 34 minutes: 7,226
  • 35 to 39 minutes: 1,053
  • 40 to 44 minutes: 3,382
  • 45 to 59 minutes: 3,434
  • 60 to 89 minutes: 2,068
  • 90 or more minutes: 1,024
Means of transportation to work in 2022 - San Marcos

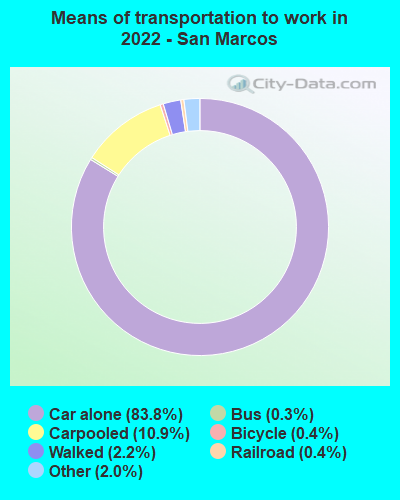
Means of transportation to work:

  • Drove a car alone: 25,386 (64.6%)
  • Carpooled: 3,441 (8.8%)
  • Bus: 71 (0.2%)
  • Long-distance train or commuter rail: 17 (0.0%)
  • Light rail, streetcar or trolley: 155 (0.4%)
  • Taxi: 625 (1.6%)
  • Bicycle: 132 (0.3%)
  • Walked: 745 (1.9%)
  • Worked at home: 9,234 (23.5%)
Class of Workers in 2022
  • Unemployment by race in 2022
  • Unemployment rate for White non-Hispanic residents
  • 2.9%Males
  • 4.7%Females
  • Unemployment rate for Black residents
  • 2.1%Males
  • 4.0%Females
  • Unemployment rate for American Indian and Alaska Native residents
  • 2.4%Females
  • Unemployment rate for Asian residents
  • 0.5%Males
  • 5.9%Females
  • Unemployment rate for other race residents
  • 3.5%Males
  • 2.5%Females
  • Unemployment rate for two or more race residents
  • 3.9%Males
  • 4.3%Females
  • Unemployment rate for Hispanic or Latino residents
  • 2.9%Males
  • 2.3%Females
Year of entry for the foreign-born population in San Marcos, California
  • Year of entry for the foreign-born population in San Marcos, California
  • 3,8452010 or later
  • 4,7622000 to 2009
  • 5,2881990 to 1999
  • 4,4521980 to 1989
  • 2,2691970 to 1979
  • 1,637Before 1970
Ancestries in San Marcos, CA

First ancestries reported:

  • English: 2,331 (4.5%)
  • Irish: 2,008 (3.8%)
  • German: 1,926 (3.7%)
  • American: 1,260 (2.4%)
  • Italian: 1,124 (2.1%)
  • European: 899 (1.7%)
  • Iranian: 826 (1.6%)
  • Polish: 766 (1.5%)
  • Scottish: 453 (0.9%)
  • Norwegian: 453 (0.9%)
  • Dutch: 296 (0.6%)
  • Russian: 293 (0.6%)
  • Egyptian: 279 (0.5%)
  • Romanian: 226 (0.4%)
  • Canadian: 212 (0.4%)
  • Serbian: 189 (0.4%)
  • Swedish: 176 (0.3%)
  • Lebanese: 160 (0.3%)
  • Scotch-Irish: 142 (0.3%)
  • French: 119 (0.2%)
  • French Canadian: 89 (0.2%)
  • Hungarian: 86 (0.2%)
  • Celtic: 86 (0.2%)
  • Brazilian: 83 (0.2%)
  • Croatian: 81 (0.2%)
  • Eastern European: 80 (0.2%)
  • British: 68 (0.1%)
  • Portuguese: 66 (0.1%)
  • Armenian: 58 (0.1%)
  • Afghan: 58 (0.1%)
  • Arab: 54 (0.1%)
  • Lithuanian: 53 (0.1%)
  • Scandinavian: 53 (0.1%)
  • Northern European: 47 (0.09%)
  • Jamaican: 45 (0.09%)
  • Czechoslovakian: 43 (0.08%)
  • Welsh: 37 (0.07%)
  • Ukrainian: 32 (0.06%)
  • Pennsylvania German: 31 (0.06%)
  • Danish: 28 (0.05%)
  • African: 28 (0.05%)
  • New Zealander: 22 (0.04%)
  • Syrian: 20 (0.04%)
  • Austrian: 20 (0.04%)
  • Greek: 20 (0.04%)
  • Belgian: 15 (0.03%)
  • Maltese: 11 (0.02%)
  • Slovak: 11 (0.02%)
  • Nigerian: 11 (0.02%)
  • Moroccan: 10 (0.02%)
  • Barbadian: 10 (0.02%)
  • Czech: 7 (0.01%)
  • Jordanian: 4 (0.01%)
  • Turkish: 4 (0.01%)

Most common places of birth for foreign-born residents (%):

Mexico
San Marcos:

50.3% (10,760)
California:

37.2% (3,881,193)

Philippines
San Marcos:

8.8% (1,882)
California:

7.8% (818,297)

India
San Marcos:

4.2% (893)
California:

5.2% (539,184)

Vietnam
San Marcos:

3.9% (837)
California:

4.9% (512,335)

Iran
San Marcos:

3.2% (694)
California:

2.0% (206,004)

China, excluding Hong Kong and Taiwan
San Marcos:

2.8% (603)
California:

6.6% (684,672)

Indonesia
San Marcos:

2.6% (554)
California:

0.4% (39,097)

Canada
San Marcos:

2.3% (486)
California:

1.2% (127,477)

Japan
San Marcos:

1.8% (381)
California:

1.0% (103,575)

Place of birth for U.S.-born residents:

  • This state: 56,001
  • Other state: 17,467
  • Northeast: 4,561
  • Midwest: 5,826
  • South: 3,031
  • West: 4,049

89.5% of San Marcos residents lived in the same house 1 years ago.
   Out of people who lived in different houses, 42.8% lived in this county.
   Out of people who lived in different counties, 56.5% lived in California.


San Marcos:

89.5%
State average:

88.9%

Education attainment for males 25 years and older:

  • No schooling: 1,392
  • Nursery to 4th grade: 30
  • 5th and 6th grade: 711
  • 7th and 8th grade: 201
  • 9th grade: 137
  • 10th grade: 290
  • 11th grade: 177
  • 12th grade, no diploma: 619
  • High school graduate (or equivalency): 6,220
  • Less than 1 year of college: 2,132
  • Some college more than 1 year, no degree: 3,670
  • Associate degree: 2,712
  • Bachelor's degree: 7,810
  • Master's degree: 2,840
  • Professional school degree: 915
  • Doctorate degree: 509
Educational Attainment for Males

Education attainment for females 25 years and older:

  • No schooling: 1,130
  • Nursery to 4th grade: 374
  • 5th and 6th grade: 841
  • 7th and 8th grade: 889
  • 9th grade: 217
  • 10th grade: 466
  • 11th grade: 310
  • 12th grade, no diploma: 383
  • High school graduate (or equivalency): 5,673
  • Less than 1 year of college: 3,043
  • Some college more than 1 year, no degree: 2,293
  • Associate degree: 2,674
  • Bachelor's degree: 8,747
  • Master's degree: 3,033
  • Professional school degree: 568
  • Doctorate degree: 299
Educational Attainment for Females
San Marcos marital status for males
San Marcos marital status for females

Housing units in structures:

  • One, detached: 15,013
  • One, attached: 3,584
  • Two: 406
  • 3 or 4: 1,386
  • 5 to 9: 1,512
  • 10 to 19: 1,176
  • 20 to 49: 1,338
  • 50 or more: 4,390
  • Mobile homes: 3,541

Median worth of mobile homes: $264,300

Housing units lacking complete plumbing facilities in 2022: 1.0%

Housing units lacking complete kitchen facilities in 2022: 1.8%

House/condo owner moved in on average 10 years ago

Renter moved in on average 3 years ago

Year householders moved into residence in San Marcos
Houses and condos Apartments
Most commonly used house heating fuel in houses and condos in San Marcos, CA
  • 74.1%Utility gas
  • 20.0%Electricity
  • 2.8%Solar energy
  • 1.6%Bottled, tank, or LP gas
  • 0.8%No fuel used
  • 0.6%Wood
Most commonly used house heating fuel in apartments in San Marcos, CA
  • 55.8%Utility gas
  • 37.3%Electricity
  • 4.3%No fuel used
  • 1.5%Bottled, tank, or LP gas
  • 0.5%Fuel oil, kerosene, etc.
  • 0.3%Other fuel
  • 0.3%Solar energy

Private vs. public school enrollment:

Students in private schools in grades 1 to 8 (elementary and middle school): 394
Here:

4.6%
California:

10.5%

Students in private schools in grades 9 to 12 (high school): 181
Here:

3.2%
California:

8.5%

Students in private undergraduate colleges: 597
Here:

7.0%
California:

15.9%
School Enrollment by Level of School for Male Students
School Enrollment by Level of School for Female Students
Age and Sex of Sensory-Disabled Noninstitutionalized Residents
Age and Sex of Physically-Disabled Noninstitutionalized Residents
Age and Sex of Mentally-Disabled Noninstitutionalized Residents
Age and Sex of Self-Care Disabled Noninstitutionalized Residents
Age and Sex of Go-Outside-Home Disabled Noninstitutionalized Residents
Age and Sex of Noninstitutionalized Residents with Employment Disability