Housing density: 3,353 houses/condos per square mile
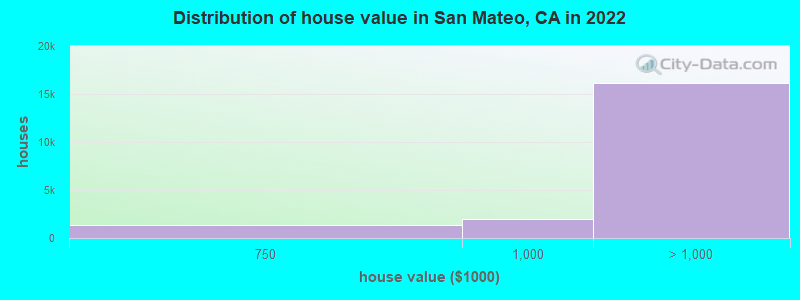
Median price asked for vacant for-sale houses and condos in 2022: $1,891,725.
Median contract rent in 2022: over $2,000 (lower quartile is over $2,000, upper quartile is over $2,000)
Median rent asked for vacant for-rent units in 2022: $2,424
Median gross rent in San Mateo, CA in 2022: over $2,000
Housing units in San Mateo with a mortgage: 14,247 (1,405 second mortgage, 0 home equity loan, 1,316 both second mortgage and home equity loan) Houses without a mortgage: 205
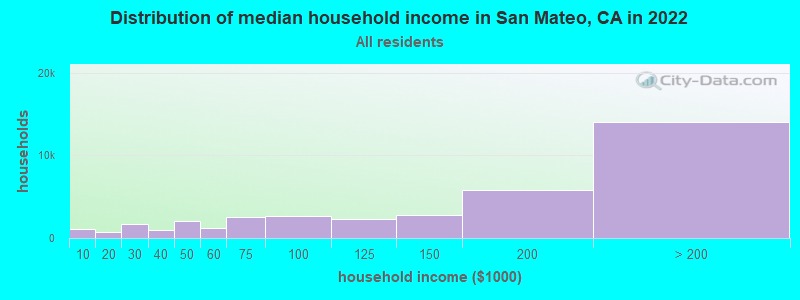
Median household income for houses/condos with a mortgage: $204,520
Median household income for apartments without a mortgage: $127,083
13,159 married couples with children.
4,581 single-parent households (1,544 men, 3,037 women).
54.8% of residents of San Mateo speak English at home.
15.4% of residents speak Spanish at home (65% speak English very well, 15% speak English well, 16% speak English not well, 4% don't speak English at all).
9.5% of residents speak other Indo-European language at home (69% speak English very well, 17% speak English well, 10% speak English not well, 4% don't speak English at all).
20.0% of residents speak Asian or Pacific Island language at home (64% speak English very well, 27% speak English well, 8% speak English not well, 1% don't speak English at all).
0.3% of residents speak other language at home (54% speak English very well, 46% don't speak English at all).
Foreign born population: 36,882 (36.5%)
(50.3% of them are naturalized citizens)
Percentage of workers working in this county: 77.9% Number of people working at home: 14,982 (27.5% of all workers)
Travel time to work (commute)
Less than 5 minutes: 551
5 to 9 minutes: 4,523
10 to 14 minutes: 5,210
15 to 19 minutes: 4,974
20 to 24 minutes: 5,779
25 to 29 minutes: 2,846
30 to 34 minutes: 4,460
35 to 39 minutes: 2,453
40 to 44 minutes: 2,565
45 to 59 minutes: 3,531
60 to 89 minutes: 2,050
90 or more minutes: 518
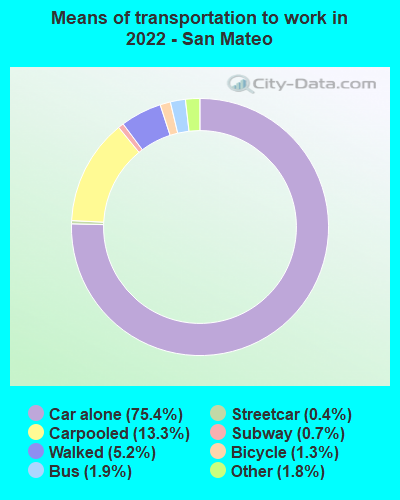
Means of transportation to work:
Drove a car alone: 32,038 (55.7%)
Carpooled: 5,669 (9.9%)
Bus: 788 (1.4%)
Subway or elevated rail: 176 (0.3%)
Long-distance train or commuter rail: 312 (0.5%)
Taxi: 748 (1.3%)
Bicycle: 556 (1.0%)
Walked: 2,225 (3.9%)
Worked at home: 14,982 (26.1%)
Unemployment by race in 2022
Unemployment rate for White non-Hispanic residents
3.3%Males
2.5%Females
Unemployment rate for Black residents
3.0%Males
Unemployment rate for American Indian and Alaska Native residents
14.4%Males
7.2%Females
Unemployment rate for Asian residents
0.5%Males
2.6%Females
Unemployment rate for other race residents
2.6%Males
10.9%Females
Unemployment rate for two or more race residents
1.5%Males
2.9%Females
Unemployment rate for Hispanic or Latino residents
2.5%Males
2.5%Females
Year of entry for the foreign-born population in San Mateo, California
13,7752010 or later
6,8102000 to 2009
4,7251990 to 1999
7,7551980 to 1989
3,9221970 to 1979
5,283Before 1970
First ancestries reported:
Irish: 2,015 (3.5%)
Italian: 1,874 (3.3%)
American: 1,749 (3.1%)
European: 1,375 (2.4%)
German: 1,271 (2.2%)
English: 1,026 (1.8%)
Russian: 655 (1.1%)
Iranian: 587 (1.0%)
Greek: 532 (0.9%)
Norwegian: 485 (0.8%)
French: 436 (0.8%)
Scottish: 416 (0.7%)
Polish: 370 (0.6%)
Brazilian: 321 (0.6%)
Northern European: 310 (0.5%)
Eastern European: 300 (0.5%)
Portuguese: 288 (0.5%)
Lebanese: 244 (0.4%)
Ukrainian: 228 (0.4%)
Nigerian: 197 (0.3%)
Armenian: 181 (0.3%)
British: 165 (0.3%)
Swedish: 165 (0.3%)
Croatian: 157 (0.3%)
Dutch: 148 (0.3%)
Romanian: 142 (0.2%)
Scotch-Irish: 138 (0.2%)
Afghan: 118 (0.2%)
Jordanian: 113 (0.2%)
Swiss: 110 (0.2%)
Turkish: 96 (0.2%)
Egyptian: 92 (0.2%)
Austrian: 88 (0.2%)
French Canadian: 87 (0.2%)
Hungarian: 85 (0.1%)
Canadian: 81 (0.1%)
Palestinian: 70 (0.1%)
Maltese: 70 (0.1%)
Welsh: 68 (0.1%)
Scandinavian: 63 (0.1%)
Slavic: 61 (0.1%)
Czech: 59 (0.1%)
Lithuanian: 48 (0.08%)
Israeli: 45 (0.08%)
Danish: 44 (0.08%)
Australian: 41 (0.07%)
Bulgarian: 28 (0.05%)
Sudanese: 23 (0.04%)
Estonian: 22 (0.04%)
Jamaican: 20 (0.03%)
Latvian: 19 (0.03%)
Macedonian: 18 (0.03%)
Haitian: 17 (0.03%)
Arab: 16 (0.03%)
Slovak: 15 (0.03%)
African: 14 (0.02%)
Moroccan: 14 (0.02%)
Yugoslavian: 13 (0.02%)
Syrian: 9 (0.02%)
West Indian: 9 (0.02%)
Guyanese: 8 (0.01%)
Serbian: 8 (0.01%)
Albanian: 8 (0.01%)
Belgian: 7 (0.01%)
Czechoslovakian: 6 (0.01%)
Finnish: 4 (0.01%)
Slovene: 3 (0.01%)
New Zealander: 3 (0.01%)
Most common places of birth for foreign-born residents (%):
China, excluding Hong Kong and Taiwan
San Mateo:
14.7% (5,485)
California:
6.6% (684,672)
Mexico
San Mateo:
12.9% (4,821)
California:
37.2% (3,881,193)
India
San Mateo:
8.3% (3,097)
California:
5.2% (539,184)
Philippines
San Mateo:
7.9% (2,930)
California:
7.8% (818,297)
Guatemala
San Mateo:
6.6% (2,467)
California:
2.8% (290,436)
El Salvador
San Mateo:
4.7% (1,746)
California:
4.2% (440,287)
Taiwan
San Mateo:
3.4% (1,283)
California:
1.7% (176,274)
Hong Kong
San Mateo:
2.9% (1,085)
California:
1.0% (105,215)
Peru
San Mateo:
2.8% (1,035)
California:
0.7% (74,025)
Canada
San Mateo:
2.3% (841)
California:
1.2% (127,477)
Korea
San Mateo:
2.1% (774)
California:
3.0% (315,248)
Iran
San Mateo:
1.6% (599)
California:
2.0% (206,004)
Japan
San Mateo:
1.6% (579)
California:
1.0% (103,575)
Place of birth for U.S.-born residents:
This state: 48,480
Other state: 14,538
Northeast: 4,119
Midwest: 3,890
South: 4,423
West: 2,106
84.0% of San Mateo residents lived in the same house 1 years ago. Out of people who lived in different houses, 30.3% lived in this county. Out of people who lived in different counties, 55.1% lived in California.
San Mateo:
84.0%
State average:
88.9%
Education attainment for males 25 years and older:
No schooling: 805
Nursery to 4th grade: 202
5th and 6th grade: 658
7th and 8th grade: 444
9th grade: 0
10th grade: 292
11th grade: 279
12th grade, no diploma: 538
High school graduate (or equivalency): 6,053
Less than 1 year of college: 822
Some college more than 1 year, no degree: 3,688
Associate degree: 2,136
Bachelor's degree: 10,803
Master's degree: 6,168
Professional school degree: 1,436
Doctorate degree: 2,320
Education attainment for females 25 years and older:
No schooling: 949
Nursery to 4th grade: 446
5th and 6th grade: 202
7th and 8th grade: 149
9th grade: 82
10th grade: 276
11th grade: 16
12th grade, no diploma: 635
High school graduate (or equivalency): 4,730
Less than 1 year of college: 2,385
Some college more than 1 year, no degree: 2,714
Associate degree: 2,408
Bachelor's degree: 11,459
Master's degree: 7,408
Professional school degree: 1,933
Doctorate degree: 1,238
Housing units in structures:
One, detached: 18,117
One, attached: 3,639
Two: 391
3 or 4: 1,481
5 to 9: 3,234
10 to 19: 2,652
20 to 49: 4,896
50 or more: 6,561
Housing units lacking complete plumbing facilities in 2022: 0.1%
Housing units lacking complete kitchen facilities in 2022: 1.6%
House/condo owner moved in on average 13 years ago