Housing density: 1,473 houses/condos per square mile
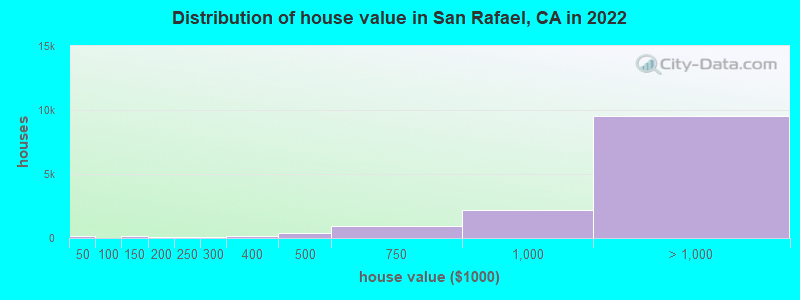
Median price asked for vacant for-sale houses and condos in 2022: $1,561,846.
Median contract rent in 2022: over $2,000 (lower quartile is $1,541, upper quartile is over $2,000)
Median rent asked for vacant for-rent units in 2022: $3,462
Median gross rent in San Rafael, CA in 2022: over $2,000
Housing units in San Rafael with a mortgage: 8,030 (1,509 second mortgage, 100 home equity loan, 1,244 both second mortgage and home equity loan) Houses without a mortgage: 205
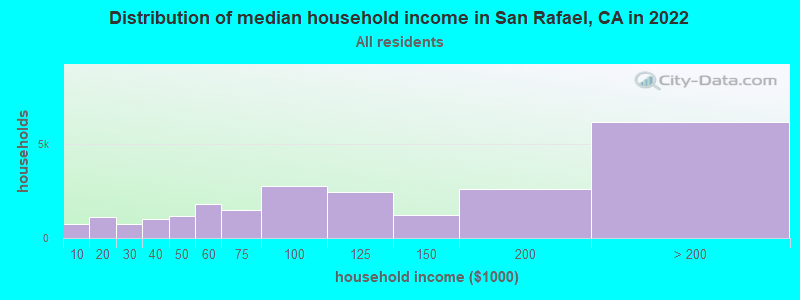
Median household income for houses/condos with a mortgage: $215,438
Median household income for apartments without a mortgage: $125,198
7,390 married couples with children.
2,124 single-parent households (724 men, 1,400 women).
65.2% of residents of San Rafael speak English at home.
24.2% of residents speak Spanish at home (41% speak English very well, 21% speak English well, 26% speak English not well, 12% don't speak English at all).
4.1% of residents speak other Indo-European language at home (78% speak English very well, 14% speak English well, 7% speak English not well, 1% don't speak English at all).
3.9% of residents speak Asian or Pacific Island language at home (52% speak English very well, 29% speak English well, 17% speak English not well, 2% don't speak English at all).
2.5% of residents speak other language at home (32% speak English very well, 62% speak English well, 6% speak English not well).
Foreign born population: 16,163 (27.0%)
(40.3% of them are naturalized citizens)
Percentage of workers working in this county: 83.1% Number of people working at home: 8,603 (28.5% of all workers)
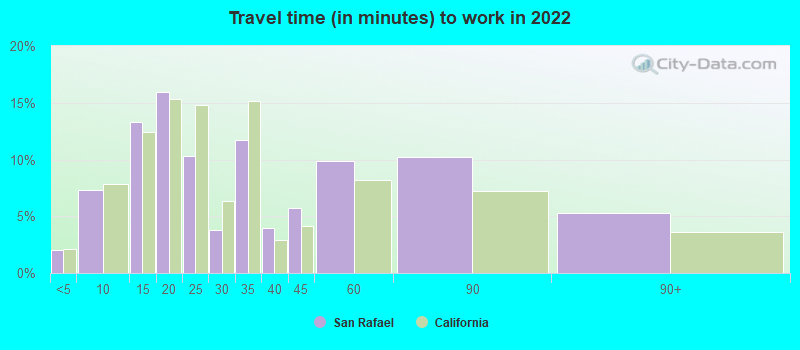
Travel time to work (commute)
Less than 5 minutes: 468
5 to 9 minutes: 2,060
10 to 14 minutes: 3,274
15 to 19 minutes: 4,701
20 to 24 minutes: 2,153
25 to 29 minutes: 855
30 to 34 minutes: 2,412
35 to 39 minutes: 663
40 to 44 minutes: 891
45 to 59 minutes: 1,138
60 to 89 minutes: 2,159
90 or more minutes: 666
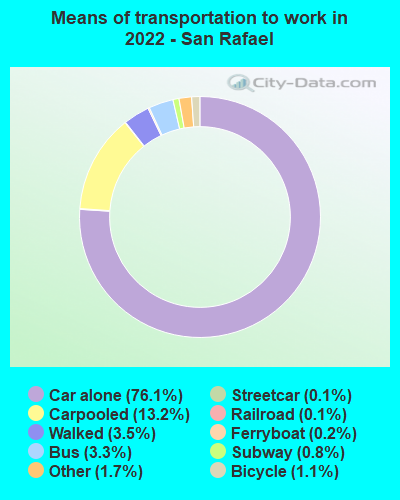
Means of transportation to work:
Drove a car alone: 23,338 (56.4%)
Carpooled: 3,872 (9.4%)
Bus: 1,361 (3.3%)
Subway or elevated rail: 33 (0.1%)
Long-distance train or commuter rail: 327 (0.8%)
Light rail, streetcar or trolley: 38 (0.1%)
Ferryboat: 61 (0.1%)
Taxi: 923 (2.2%)
Bicycle: 667 (1.6%)
Walked: 1,375 (3.3%)
Worked at home: 8,603 (20.8%)
Unemployment by race in 2022
Unemployment rate for White non-Hispanic residents
7.4%Males
3.7%Females
Unemployment rate for Asian residents
10.1%Males
1.4%Females
Unemployment rate for other race residents
4.9%Males
2.0%Females
Unemployment rate for two or more race residents
5.8%Males
4.6%Females
Unemployment rate for Hispanic or Latino residents
4.7%Males
2.7%Females
Year of entry for the foreign-born population in San Rafael, California
5,3462010 or later
4,1262000 to 2009
2,5181990 to 1999
3,9471980 to 1989
1,2561970 to 1979
2,154Before 1970
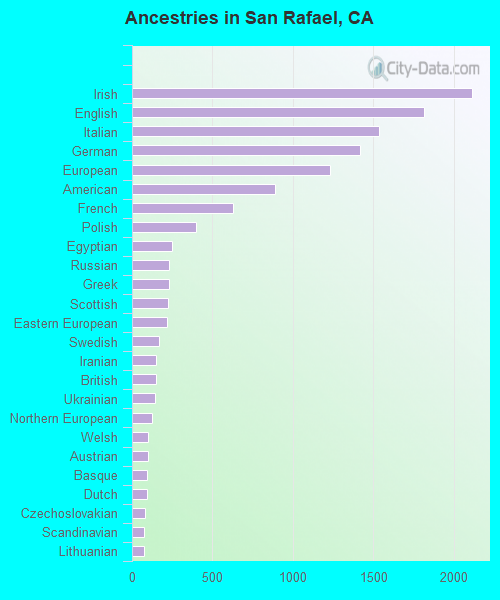
First ancestries reported:
Irish: 2,112 (7.2%)
English: 1,812 (6.2%)
Italian: 1,537 (5.3%)
German: 1,414 (4.8%)
European: 1,231 (4.2%)
American: 887 (3.0%)
French: 625 (2.1%)
Polish: 395 (1.4%)
Egyptian: 246 (0.8%)
Russian: 231 (0.8%)
Greek: 229 (0.8%)
Scottish: 221 (0.8%)
Eastern European: 220 (0.8%)
Swedish: 170 (0.6%)
Iranian: 151 (0.5%)
British: 146 (0.5%)
Ukrainian: 141 (0.5%)
Northern European: 122 (0.4%)
Welsh: 102 (0.3%)
Austrian: 98 (0.3%)
Basque: 94 (0.3%)
Dutch: 92 (0.3%)
Czechoslovakian: 78 (0.3%)
Scandinavian: 77 (0.3%)
Lithuanian: 76 (0.3%)
African: 74 (0.3%)
Lebanese: 69 (0.2%)
Romanian: 63 (0.2%)
Belgian: 59 (0.2%)
Canadian: 56 (0.2%)
Scotch-Irish: 54 (0.2%)
Norwegian: 51 (0.2%)
Portuguese: 46 (0.2%)
Hungarian: 39 (0.1%)
Danish: 34 (0.1%)
Croatian: 34 (0.1%)
Swiss: 33 (0.1%)
Soviet Union: 32 (0.1%)
French Canadian: 32 (0.1%)
Jordanian: 31 (0.1%)
Slovak: 29 (0.10%)
Guyanese: 23 (0.08%)
Finnish: 21 (0.07%)
Afghan: 18 (0.06%)
Ethiopian: 15 (0.05%)
Latvian: 14 (0.05%)
Palestinian: 14 (0.05%)
Arab: 13 (0.04%)
Brazilian: 13 (0.04%)
Serbian: 13 (0.04%)
Syrian: 11 (0.04%)
Czech: 10 (0.03%)
Jamaican: 10 (0.03%)
Turkish: 8 (0.03%)
Haitian: 6 (0.02%)
Slovene: 4 (0.01%)
Nigerian: 3 (0.01%)
Most common places of birth for foreign-born residents (%):
Guatemala
San Rafael:
26.1% (4,246)
California:
2.8% (290,436)
Mexico
San Rafael:
22.2% (3,612)
California:
37.2% (3,881,193)
El Salvador
San Rafael:
7.4% (1,208)
California:
4.2% (440,287)
China, excluding Hong Kong and Taiwan
San Rafael:
3.1% (504)
California:
6.6% (684,672)
Philippines
San Rafael:
3.0% (482)
California:
7.8% (818,297)
Germany
San Rafael:
2.6% (429)
California:
0.7% (73,304)
India
San Rafael:
2.6% (425)
California:
5.2% (539,184)
United Kingdom, excluding England and Scotland
San Rafael:
2.6% (419)
California:
0.6% (60,582)
Canada
San Rafael:
2.0% (326)
California:
1.2% (127,477)
Vietnam
San Rafael:
2.0% (323)
California:
4.9% (512,335)
Korea
San Rafael:
1.9% (311)
California:
3.0% (315,248)
Place of birth for U.S.-born residents:
This state: 28,402
Other state: 14,260
Northeast: 4,867
Midwest: 4,391
South: 2,911
West: 2,069
89.1% of San Rafael residents lived in the same house 1 years ago. Out of people who lived in different houses, 37.3% lived in this county. Out of people who lived in different counties, 74.2% lived in California.
San Rafael:
89.1%
State average:
88.9%
Education attainment for males 25 years and older:
No schooling: 585
Nursery to 4th grade: 509
5th and 6th grade: 922
7th and 8th grade: 548
9th grade: 421
10th grade: 171
11th grade: 302
12th grade, no diploma: 615
High school graduate (or equivalency): 3,959
Less than 1 year of college: 856
Some college more than 1 year, no degree: 1,698
Associate degree: 1,191
Bachelor's degree: 5,537
Master's degree: 2,462
Professional school degree: 1,378
Doctorate degree: 619
Education attainment for females 25 years and older:
No schooling: 405
Nursery to 4th grade: 168
5th and 6th grade: 848
7th and 8th grade: 216
9th grade: 187
10th grade: 74
11th grade: 116
12th grade, no diploma: 657
High school graduate (or equivalency): 2,187
Less than 1 year of college: 938
Some college more than 1 year, no degree: 2,804
Associate degree: 1,305
Bachelor's degree: 7,109
Master's degree: 3,735
Professional school degree: 1,011
Doctorate degree: 608
Housing units in structures:
One, detached: 11,831
One, attached: 2,008
Two: 1,024
3 or 4: 1,711
5 to 9: 2,040
10 to 19: 1,546
20 to 49: 1,672
50 or more: 2,276
Mobile homes: 238
Boats, RVs, vans, etc.: 97
Median worth of mobile homes: $242,710
Housing units lacking complete plumbing facilities in 2022: 0.5%
Housing units lacking complete kitchen facilities in 2022: 1.2%
House/condo owner moved in on average 14 years ago