Jump to a detailed profile or search site with Google Custom Search

San Ramon, CA (California) Houses and Residents

Estimated median house or condo value in 2022: $1,527,200 (it was $421,000 in 2000)
San Ramon:

$1,527,200
California:

$715,900
Lower value quartile - upper value quartile: $1,083,000 - $1,962,200

Mean price in 2022:

Detached houses: $1,539,011
Here:

$1,539,011
State:

$988,808

Townhouses or other attached units: $1,071,313
Here:

$1,071,313
State:

$838,546

In 2-unit structures: $839,998
Here:

$839,998
State:

$1,138,100

In 3-to-4-unit structures: $741,679
Here:

$741,679
State:

$824,253

In 5-or-more-unit structures: $804,614
Here:

$804,614
State:

$730,996

Total population: 75,332 (Urban population: 44,477, Rural population: 0)

Houses: 31,943 (31,210 occupied: 22,327 owner occupied, 8,883 renter occupied)

% of renters here:

28%
State:

44%

Housing density: 2,758 houses/condos per square mile

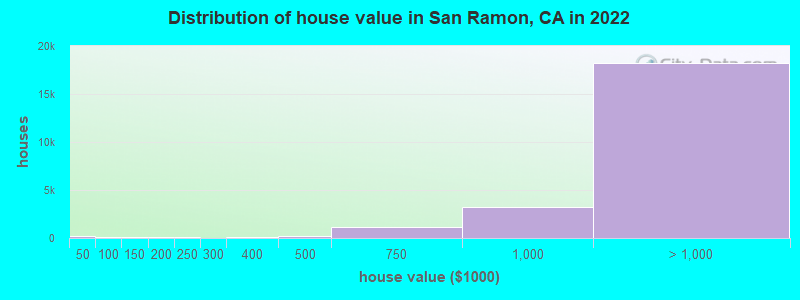
Median price asked for vacant for-sale houses and condos in 2022: $403,032.

Median contract rent in 2022: over $2,000 (lower quartile is over $2,000, upper quartile is over $2,000)


Median rent asked for vacant for-rent units in 2022: $2,574


Median gross rent in San Ramon, CA in 2022: over $2,000

Housing units in San Ramon with a mortgage: 18,388 (3,286 second mortgage, 239 home equity loan, 2,893 both second mortgage and home equity loan)
Houses without a mortgage: 217

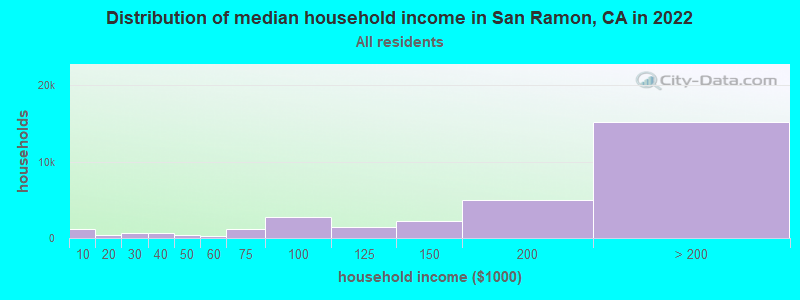
Median household income for houses/condos with a mortgage: $239,750

Median household income for apartments without a mortgage: $177,956

Median monthly housing costs: $3,498

Compare current foreclosures in San Ramon, CA:

Check out more offers in San Ramon, CA.
Powered by Foreclosure.com

Settings
X
Data:
Loading data...
Based on 2000-2022 data
Loading data...

123
Hide US histogram

San Ramon, California Age and Sex of Residents
Median year house/condo built: 1992

Median year apartment built: 1998

Household type by relationship:

Households: 85,959
  • Male householders: 18,900 (2,046 living alone), Female householders: 12,310 (2,661 living alone)
  • 21,742 spouses (21,456 opposite-sex spouses), 1,113 unmarried partners, (1,113 opposite-sex unmarried partners), 27,323 children (26,382 natural, 685 adopted, 256 stepchildren), 158 grandchildren, 419 brothers or sisters, 1,687 parents, 0 foster children, 206 other relatives, 1,917 non-relatives
  • In group quarters: 184

Size of family households: 10,055 2-persons, 6,094 3-persons, 7,054 4-persons, 1,263 5-persons, 341 6-persons, 263 7-or-more-persons.

Size of nonfamily households: 4,707 1-person, 966 2-persons, 130 3-persons, 83 4-persons, 254 5-persons.

19,423 married couples with children.
2,233 single-parent households (856 men, 1,377 women).

54.5% of residents of San Ramon speak English at home.
3.0% of residents speak Spanish at home (83% speak English very well, 12% speak English well, 4% speak English not well, 1% don't speak English at all).
14.2% of residents speak other Indo-European language at home (77% speak English very well, 17% speak English well, 5% speak English not well, 1% don't speak English at all).
27.1% of residents speak Asian or Pacific Island language at home (68% speak English very well, 21% speak English well, 8% speak English not well, 2% don't speak English at all).
2.1% of residents speak other language at home (71% speak English very well, 25% speak English well, 2% speak English not well, 2% don't speak English at all).

Foreign born population: 31,717 (36.9%)
(68.8% of them are naturalized citizens)

Median number of rooms in houses and condos:
Here:

6.7
State:

6.0

Median number of rooms in apartments
Here:

3.8
State:

3.9

Owner-occupied Renter-occupied
Bedrooms in owner-occupied houses and condos in San Ramon, California
  • Bedrooms in owner-occupied houses and condos in San Ramon, California
  • 110no bedroom
  • 5541 bedroom
  • 1,0482 bedrooms
  • 5,9523 bedrooms
  • 11,6584 bedrooms
  • 3,0055+ bedrooms
Bedrooms in renter-occupied apartments in San Ramon, California
  • Bedrooms in renter-occupied apartments in San Ramon, California
  • 1,032no bedroom
  • 2,6101 bedroom
  • 2,4462 bedrooms
  • 1,4383 bedrooms
  • 9084 bedrooms
  • 4495+ bedrooms
Owner-occupied Renter-occupied
Cars and other vehicles available in San Ramon in owner-occupied houses/condos
  • Cars and other vehicles available in San Ramon in owner-occupied houses/condos
  • 265no vehicle
  • 4,2591 vehicle
  • 12,0772 vehicles
  • 4,7733 vehicles
  • 5724 vehicles
  • 3815+ vehicles
Cars and other vehicles available in San Ramon in renter-occupied apartments
  • Cars and other vehicles available in San Ramon in renter-occupied apartments
  • 845no vehicle
  • 4,2641 vehicle
  • 3,1972 vehicles
  • 5013 vehicles
  • 434 vehicles
  • 335+ vehicles
Owner-occupied Renter-occupied
Rooms in owner-occupied houses in San Ramon, California
  • Rooms in owner-occupied houses in San Ramon, California
  • 01 room
  • 1162 rooms
  • 4963 rooms
  • 1,3904 rooms
  • 3,5915 rooms
  • 4,6966 rooms
  • 4,4557 rooms
  • 3,5758 rooms
  • 4,0089+ rooms
Rooms in renter-occupied apartments in San Ramon, California
  • Rooms in renter-occupied apartments in San Ramon, California
  • 9931 room
  • 1,2872 rooms
  • 1,5873 rooms
  • 1,9894 rooms
  • 4905 rooms
  • 9466 rooms
  • 7447 rooms
  • 4118 rooms
  • 4369+ rooms
Year house built
Median 2022 house/condo value by year built
Median house/condo value by year householder moved into unit
Breakdown of mean house values by ages of householders
Owners and renters by unit type in San Ramon, CA
  • San Ramon, CA household income distribution

  • Distribution of median household income in San Ramon, CA in 2022
  • 1,200Less than $10,000
  • 358$10,000 to $19,999
  • 593$20,000 to $29,999
  • 639$30,000 to $39,999
  • 366$40,000 to $49,999
  • 265$50,000 to $59,999
  • 1,181$60,000 to $74,999
  • 2,807$75,000 to $99,999
  • 1,429$100,000 to $124,999
  • 2,172$125,000 to $149,999
  • 4,996$150,000 to $199,999
  • 15,204$200,000 or more
  • Home value of owner - occupied houses in 2022 in San Ramon, CA

  • Distribution of house value in San Ramon, CA in 2022
  • 161Less than $10,000
  • 43$10,000 to $14,999
  • 24$50,000 to $59,999
  • 14$70,000 to $79,999
  • 58$80,000 to $89,999
  • 0$90,000 to $99,999
  • 93$100,000 to $124,999
  • 9$125,000 to $149,999
  • 48$150,000 to $174,999
  • 30$175,000 to $199,999
  • 64$200,000 to $249,999
  • 20$250,000 to $299,999
  • 128$300,000 to $399,999
  • 167$400,000 to $499,999
  • 1,150$500,000 to $749,999
  • 3,183$750,000 to $999,999
  • 9,439$1,000,000 to $1,499,999
  • 5,668$1,500,000 to $1,999,999
  • 3,154$2,000,000 or more
  • Rent paid by renters in 2022 in San Ramon, CA

  • Distribution of rent paid by renters in San Ramon, CA in 2022
  • 27Less than $100
  • 37$150 to $199
  • 27$200 to $249
  • 101$250 to $299
  • 37$450 to $499
  • 31$550 to $599
  • 17$750 to $799
  • 14$800 to $899
  • 72$900 to $999
  • 166$1,000 to $1,249
  • 263$1,250 to $1,499
  • 826$1,500 to $1,999
  • 1,906$2,000 to $2,499
  • 1,543$2,500 to $2,999
  • 825$3,000 to $3,499
  • 1,831$3,500 or more
  • 274No cash rent
Time Leaving Home To Go To Work in 2022

Percentage of workers working in this county: 63.5%
Number of people working at home: 14,539 (34.5% of all workers)

Travel time (in minutes) to work in 2022

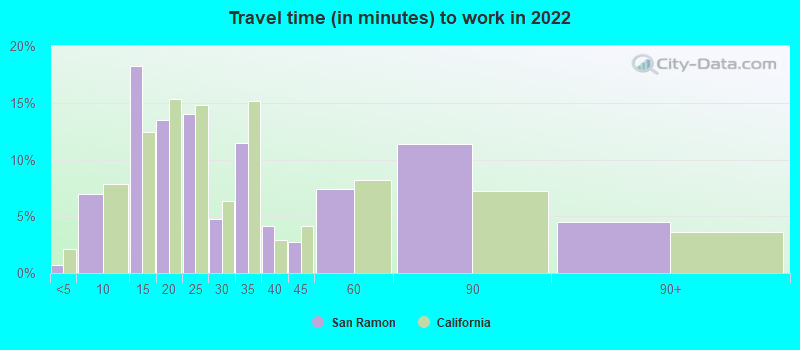
Travel time to work (commute)

  • Less than 5 minutes: 215
  • 5 to 9 minutes: 1,626
  • 10 to 14 minutes: 4,730
  • 15 to 19 minutes: 2,848
  • 20 to 24 minutes: 3,953
  • 25 to 29 minutes: 1,023
  • 30 to 34 minutes: 2,483
  • 35 to 39 minutes: 1,073
  • 40 to 44 minutes: 965
  • 45 to 59 minutes: 3,937
  • 60 to 89 minutes: 4,451
  • 90 or more minutes: 1,272
Means of transportation to work in 2022 - San Ramon

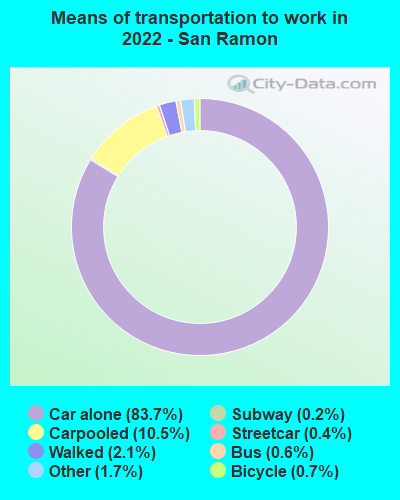
Means of transportation to work:

  • Drove a car alone: 24,692 (56.1%)
  • Carpooled: 3,457 (7.9%)
  • Bus: 152 (0.3%)
  • Subway or elevated rail: 86 (0.2%)
  • Long-distance train or commuter rail: 56 (0.1%)
  • Light rail, streetcar or trolley: 8 (0.0%)
  • Taxi: 545 (1.2%)
  • Bicycle: 140 (0.3%)
  • Walked: 886 (2.0%)
  • Worked at home: 14,539 (33.0%)
Class of Workers in 2022
  • Unemployment by race in 2022
  • Unemployment rate for White non-Hispanic residents
  • 10.9%Males
  • 1.2%Females
  • Unemployment rate for Black residents
  • 5.6%Males
  • 6.6%Females
  • Unemployment rate for American Indian and Alaska Native residents
  • 54.3%Females
  • Unemployment rate for Asian residents
  • 1.3%Males
  • 5.9%Females
  • Unemployment rate for other race residents
  • 1.9%Males
  • 1.5%Females
  • Unemployment rate for two or more race residents
  • 2.6%Males
  • 2.7%Females
  • Unemployment rate for Hispanic or Latino residents
  • 3.5%Males
  • 1.8%Females
Year of entry for the foreign-born population in San Ramon, California
  • Year of entry for the foreign-born population in San Ramon, California
  • 10,8312010 or later
  • 8,3862000 to 2009
  • 7,6041990 to 1999
  • 2,0101980 to 1989
  • 1,5271970 to 1979
  • 1,451Before 1970
Ancestries in San Ramon, CA

First ancestries reported:

  • Iranian: 1,685 (3.2%)
  • English: 1,466 (2.8%)
  • German: 1,292 (2.4%)
  • Scottish: 968 (1.8%)
  • Irish: 963 (1.8%)
  • Italian: 904 (1.7%)
  • European: 903 (1.7%)
  • American: 884 (1.7%)
  • French: 602 (1.1%)
  • Portuguese: 457 (0.9%)
  • Egyptian: 384 (0.7%)
  • Russian: 347 (0.7%)
  • Greek: 294 (0.6%)
  • Polish: 274 (0.5%)
  • Norwegian: 260 (0.5%)
  • British: 201 (0.4%)
  • Nigerian: 200 (0.4%)
  • Lebanese: 177 (0.3%)
  • Arab: 160 (0.3%)
  • Ukrainian: 123 (0.2%)
  • Northern European: 82 (0.2%)
  • Dutch: 80 (0.2%)
  • Swedish: 80 (0.2%)
  • Canadian: 78 (0.1%)
  • Turkish: 77 (0.1%)
  • Afghan: 77 (0.1%)
  • Eastern European: 71 (0.1%)
  • Danish: 71 (0.1%)
  • Finnish: 68 (0.1%)
  • Swiss: 59 (0.1%)
  • Armenian: 57 (0.1%)
  • Romanian: 57 (0.1%)
  • Moroccan: 56 (0.1%)
  • Scotch-Irish: 53 (0.1%)
  • Czechoslovakian: 48 (0.09%)
  • Czech: 46 (0.09%)
  • Bulgarian: 46 (0.09%)
  • Ethiopian: 46 (0.09%)
  • African: 43 (0.08%)
  • South African: 43 (0.08%)
  • Haitian: 36 (0.07%)
  • Assyrian: 33 (0.06%)
  • Lithuanian: 27 (0.05%)
  • Austrian: 24 (0.05%)
  • Hungarian: 23 (0.04%)
  • Slovak: 18 (0.03%)
  • Belgian: 18 (0.03%)
  • Welsh: 16 (0.03%)
  • Scandinavian: 14 (0.03%)
  • Icelander: 13 (0.02%)
  • Ghanaian: 11 (0.02%)
  • Australian: 11 (0.02%)
  • Slavic: 8 (0.02%)
  • Brazilian: 7 (0.01%)
  • Estonian: 7 (0.01%)
  • French Canadian: 6 (0.01%)
  • Bahamian: 4 (0.01%)
  • Jordanian: 3 (0.01%)

Most common places of birth for foreign-born residents (%):

India
San Ramon:

41.7% (13,267)
California:

5.2% (539,184)

China, excluding Hong Kong and Taiwan
San Ramon:

13.0% (4,146)
California:

6.6% (684,672)

Korea
San Ramon:

7.2% (2,278)
California:

3.0% (315,248)

Philippines
San Ramon:

4.9% (1,566)
California:

7.8% (818,297)

Iran
San Ramon:

3.6% (1,145)
California:

2.0% (206,004)

Hong Kong
San Ramon:

3.4% (1,087)
California:

1.0% (105,215)

Taiwan
San Ramon:

2.7% (844)
California:

1.7% (176,274)

Mexico
San Ramon:

2.0% (636)
California:

37.2% (3,881,193)

Vietnam
San Ramon:

2.0% (635)
California:

4.9% (512,335)

Pakistan
San Ramon:

1.8% (583)
California:

0.5% (49,399)

Egypt
San Ramon:

1.7% (554)
California:

0.4% (42,718)

Place of birth for U.S.-born residents:

  • This state: 40,950
  • Other state: 12,485
  • Northeast: 3,974
  • Midwest: 4,336
  • South: 2,765
  • West: 1,410

86.0% of San Ramon residents lived in the same house 1 years ago.
   Out of people who lived in different houses, 27.5% lived in this county.
   Out of people who lived in different counties, 79.3% lived in California.


San Ramon:

86.0%
State average:

88.9%

Education attainment for males 25 years and older:

  • No schooling: 721
  • Nursery to 4th grade: 0
  • 5th and 6th grade: 0
  • 7th and 8th grade: 0
  • 9th grade: 0
  • 10th grade: 0
  • 11th grade: 0
  • 12th grade, no diploma: 122
  • High school graduate (or equivalency): 2,285
  • Less than 1 year of college: 1,055
  • Some college more than 1 year, no degree: 1,665
  • Associate degree: 1,742
  • Bachelor's degree: 10,595
  • Master's degree: 7,151
  • Professional school degree: 1,648
  • Doctorate degree: 1,823
Educational Attainment for Males

Education attainment for females 25 years and older:

  • No schooling: 750
  • Nursery to 4th grade: 110
  • 5th and 6th grade: 231
  • 7th and 8th grade: 130
  • 9th grade: 0
  • 10th grade: 261
  • 11th grade: 95
  • 12th grade, no diploma: 118
  • High school graduate (or equivalency): 2,940
  • Less than 1 year of college: 939
  • Some college more than 1 year, no degree: 1,652
  • Associate degree: 1,745
  • Bachelor's degree: 11,658
  • Master's degree: 7,958
  • Professional school degree: 1,387
  • Doctorate degree: 666
Educational Attainment for Females
San Ramon marital status for males
San Ramon marital status for females

Housing units in structures:

  • One, detached: 20,891
  • One, attached: 4,391
  • 3 or 4: 838
  • 5 to 9: 1,974
  • 10 to 19: 1,693
  • 20 to 49: 466
  • 50 or more: 1,616
  • Boats, RVs, vans, etc.: 74
Housing units lacking complete plumbing facilities in 2022: 1.5%

Housing units lacking complete kitchen facilities in 2022: 1.7%

House/condo owner moved in on average 12 years ago

Renter moved in on average 0 years ago

Year householders moved into residence in San Ramon
Houses and condos Apartments
Most commonly used house heating fuel in houses and condos in San Ramon, CA
  • 78.1%Utility gas
  • 19.2%Electricity
  • 1.3%Bottled, tank, or LP gas
  • 1.1%Solar energy
  • 0.1%Wood
  • 0.1%No fuel used
Most commonly used house heating fuel in apartments in San Ramon, CA
  • 49.0%Electricity
  • 46.1%Utility gas
  • 2.3%No fuel used
  • 1.8%Bottled, tank, or LP gas
  • 0.4%Solar energy
  • 0.3%Coal or coke
  • 0.2%Fuel oil, kerosene, etc.

Private vs. public school enrollment:

Students in private schools in grades 1 to 8 (elementary and middle school): 617
Here:

6.5%
California:

10.5%

Students in private schools in grades 9 to 12 (high school): 137
Here:

2.3%
California:

8.5%

Students in private undergraduate colleges: 676
Here:

13.7%
California:

15.9%
School Enrollment by Level of School for Male Students
School Enrollment by Level of School for Female Students
Age and Sex of Sensory-Disabled Noninstitutionalized Residents
Age and Sex of Physically-Disabled Noninstitutionalized Residents
Age and Sex of Mentally-Disabled Noninstitutionalized Residents
Age and Sex of Self-Care Disabled Noninstitutionalized Residents
Age and Sex of Go-Outside-Home Disabled Noninstitutionalized Residents
Age and Sex of Noninstitutionalized Residents with Employment Disability