Sand Springs, OK (Oklahoma) Houses and Residents
| Sand Springs: | $195,307 |
| Oklahoma: | $191,700 |
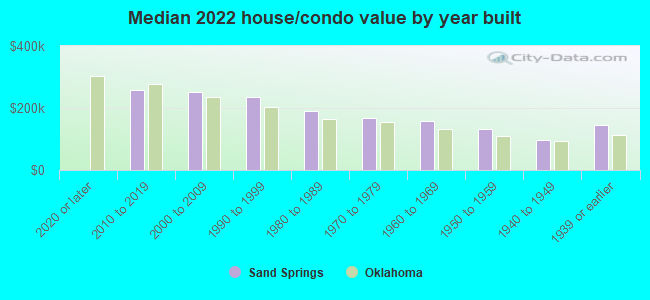
Mean price in 2022:
Detached houses: $236,585
Here: $236,585 State: $255,409 Townhouses or other attached units: $134,557
Here: $134,557 State: $206,466 Mobile homes: $117,780
Here: $117,780 State: $110,804 Occupied boats, RVs, vans, etc.: $106,790
Here: $106,790 State: $68,690
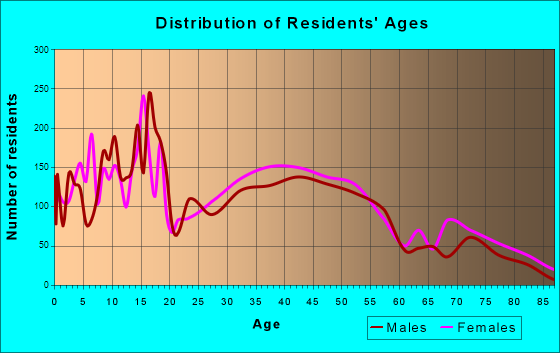
Total population: 19,553 (Urban population: 16,736, Rural population: 950 (all nonfarm))
Houses: 8,112 (7,553 occupied: 5,417 owner occupied, 2,272 renter occupied)
| % of renters here: | 30% |
| State: | 35% |
Housing density: 434 houses/condos per square mile
Median price asked for vacant for-sale houses and condos in 2022: $69,415.
Median contract rent in 2022: $795 (lower quartile is $601, upper quartile is $987)
Median rent asked for vacant for-rent units in 2022: $1,066
Median gross rent in Sand Springs, OK in 2022: $995
Housing units in Sand Springs with a mortgage: 3,585 (182 second mortgage, 19 home equity loan, 118 both second mortgage and home equity loan)
Houses without a mortgage: 55
Median household income for houses/condos with a mortgage: $88,495
Median household income for apartments without a mortgage: $63,151
Median monthly housing costs: $1,052
Compare current foreclosures in Sand Springs, OK:
| Photo | Address | Area | Beds / Baths | Price | Details |
|---|---|---|---|---|---|

|
#1
Mockingbird Ln
Sand Springs, OK 74063
|
1,608 sq. feet
|
1 baths 3 beds |
show details | |

|
#2
N Birch Ave
Sand Springs, OK 74063
|
1,436 sq. feet
|
1 baths 3 beds |
show details | |

|
#3
Robert E Lee Ter
Sand Springs, OK 74063
|
2,225 sq. feet
|
2 baths 3 beds |
show details | |

|
#4
W 12th St
Sand Springs, OK 74063
|
2,083 sq. feet
|
2 baths - beds |
show details | |

|
#5
N 194th West Ave
Sand Springs, OK 74063
|
1,680 sq. feet
|
2 baths 3 beds |
show details | |

|
#6
Antigua Dr
Sand Springs, OK 74063
|
1,808 sq. feet
|
2 baths - beds |
show details | |

|
#7
Goldenrod Ln
Sand Springs, OK 74063
|
1,557 sq. feet
|
2 baths 3 beds |
show details | |

|
#8
W 47th Pl
Sand Springs, OK 74063
|
912 sq. feet
|
1 baths - beds |
show details | |

|
#9
Osage Pass
Sand Springs, OK 74063
|
1,216 sq. feet
|
2 baths 4 beds |
show details | |

|
#10
Douglas Ave
Sand Springs, OK 74063
|
1,735 sq. feet
|
1 baths - beds |
show details |
| Photo | Address | Area | Beds / Baths | Price | Details |
|---|---|---|---|---|---|

|
#11
Washington Ave
Sand Springs, OK 74063
|
1,329 sq. feet
|
1 baths - beds |
show details | |

|
#12
Redbud Pl
Sand Springs, OK 74063
|
1,672 sq. feet
|
2 baths - beds |
show details | |

|
#13
W 54th St
Sand Springs, OK 74063
|
1,829 sq. feet
|
2 baths - beds |
show details | |

|
#14
W 46th Pl
Sand Springs, OK 74063
|
917 sq. feet
|
1 baths - beds |
show details | |

|
#15
S 155th West Ave
Sand Springs, OK 74063
|
1,440 sq. feet
|
1 baths - beds |
show details | |

|
#16
N Wilson Ave
Sand Springs, OK 74063
|
1,284 sq. feet
|
1 baths - beds |
show details | |

|
#17
Redbud Dr
Sand Springs, OK 74063
|
1,934 sq. feet
|
2 baths - beds |
show details | |

|
#18
E 40th St
Sand Springs, OK 74063
|
1,309 sq. feet
|
2 baths - beds |
show details | |

|
#19
Redbud Pl
Sand Springs, OK 74063
|
1,722 sq. feet
|
2 baths - beds |
show details | |

|
#20
S Linwood Dr
Sand Springs, OK 74063
|
1,424 sq. feet
|
2 baths - beds |
show details |
| Photo | Address | Area | Beds / Baths | Price | Details |
|---|---|---|---|---|---|

|
#21
S 263rd West Ave
Sand Springs, OK 74063
|
2,076 sq. feet
|
2 baths - beds |
show details | |

|
#22
Valley Dr
Sand Springs, OK 74063
|
1,368 sq. feet
|
1 baths - beds |
show details | |

|
#23
N Main St
Sand Springs, OK 74063
|
2,452 sq. feet
|
2 baths - beds |
show details | |

|
#24
S 148th West Ave
Sand Springs, OK 74063
|
1,545 sq. feet
|
2 baths - beds |
show details | |

|
#25
W 44th St
Sand Springs, OK 74063
|
1,566 sq. feet
|
1 baths - beds |
show details | |

|
#26
W 51st Pl
Sand Springs, OK 74063
|
2,102 sq. feet
|
2 baths - beds |
show details | |

|
#27
Ridge Dr
Sand Springs, OK 74063
|
1,102 sq. feet
|
1 baths - beds |
show details | |

|
#28
N Roosevelt Ave
Sand Springs, OK 74063
|
1,557 sq. feet
|
1 baths - beds |
show details | |

|
#29
S 169th West Ave
Sand Springs, OK 74063
|
1,820 sq. feet
|
1 baths - beds |
show details | |

|
#30
E 48th St
Sand Springs, OK 74063
|
- sq. feet
|
- baths - beds |
show details |
| Photo | Address | Area | Beds / Baths | Price | Details |
|---|---|---|---|---|---|

|
#31
W 26th St
Sand Springs, OK 74063
|
- sq. feet
|
- baths - beds |
show details | |

|
#32
N Greats Rd
Sand Springs, OK 74063
|
- sq. feet
|
- baths - beds |
show details | |

|
#33
E 10th St
Sand Springs, OK 74063
|
- sq. feet
|
- baths - beds |
show details | |

|
#34
Shell Creek Rd
Sand Springs, OK 74063
|
- sq. feet
|
- baths - beds |
show details | |

|
#35
N Franklin Ave
Sand Springs, OK 74063
|
- sq. feet
|
- baths - beds |
show details | |

|
#36
E Pecan St Apt B
Sand Springs, OK 74063
|
- sq. feet
|
- baths - beds |
show details | |

|
#37
Osage St
Sand Springs, OK 74063
|
- sq. feet
|
- baths - beds |
show details | |

|
#38
E Colony Cir
Sand Springs, OK 74063
|
- sq. feet
|
- baths - beds |
show details | |

|
#39
Anderson Ln
Sand Springs, OK 74063
|
- sq. feet
|
- baths - beds |
show details | |

|
#40
Redbud Pl
Sand Springs, OK 74063
|
- sq. feet
|
- baths - beds |
show details |
| Photo | Address | Area | Beds / Baths | Price | Details |
|---|---|---|---|---|---|

|
#41
W 58th St S
Sand Springs, OK 74063
|
- sq. feet
|
- baths - beds |
show details | |

|
#42
S Highway 97, # 253
Sand Springs, OK 74063
|
- sq. feet
|
- baths - beds |
show details | |

|
Check over 1 million property listings on Foreclosure.com!
|
browse all offers | |||


 | Oklahoma Fundraiser to help Rebuild homes (0 replies) |
| Sand Springs, safest areas? (5 replies) |
| where to find home with land near tulsa (3 replies) |
| Finding Tulsa-area Lake Homes on Realtor.com (6 replies) |
| How is the treatment of minorities in Tulsa? (7 replies) |
| Safe Low income housing in Tulsa, Help! (10 replies) |
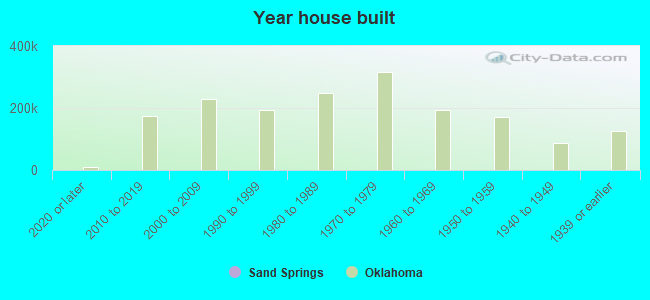
Median year apartment built: 1976
Household type by relationship:
Households: 20,176- Male householders: 3,660 (778 living alone), Female householders: 3,860 (1,223 living alone)
3,764 spouses (3,727 opposite-sex spouses), 326 unmarried partners, (315 opposite-sex unmarried partners), 6,706 children (6,143 natural, 142 adopted, 420 stepchildren), 512 grandchildren, 144 brothers or sisters, 200 parents, 0 foster children, 392 other relatives, 460 non-relatives
- In group quarters: 146
Size of family households: 2,298 2-persons, 1,164 3-persons, 1,089 4-persons, 509 5-persons, 164 6-persons, 117 7-or-more-persons.
Size of nonfamily households: 2,029 1-person, 235 2-persons, 28 3-persons.
3,514 married couples with children.
1,249 single-parent households (292 men, 957 women).
96.1% of residents of Sand Springs speak English at home.
2.8% of residents speak Spanish at home (63% speak English very well, 11% speak English well, 21% speak English not well, 5% don't speak English at all).
0.3% of residents speak other Indo-European language at home (97% speak English very well, 3% speak English well).
0.2% of residents speak Asian or Pacific Island language at home (79% speak English very well, 21% speak English well).
0.4% of residents speak other language at home (100% speak English very well).
Foreign born population: 397 (2.0%)
(51.4% of them are naturalized citizens)
| Here: | 6.2 |
| State: | 6.1 |
| Here: | 4.5 |
| State: | 4.5 |
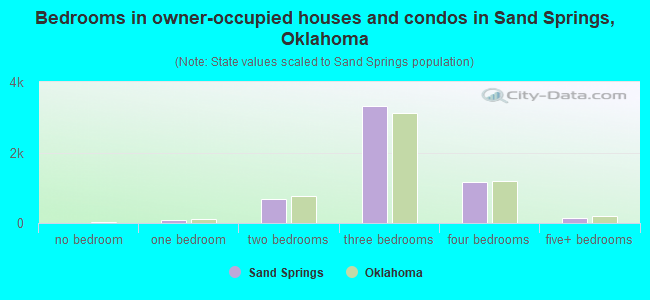
- Bedrooms in owner-occupied houses and condos in Sand Springs, Oklahoma
- 14no bedroom
- 881 bedroom
- 6882 bedrooms
- 3,3113 bedrooms
- 1,1654 bedrooms
- 1525+ bedrooms
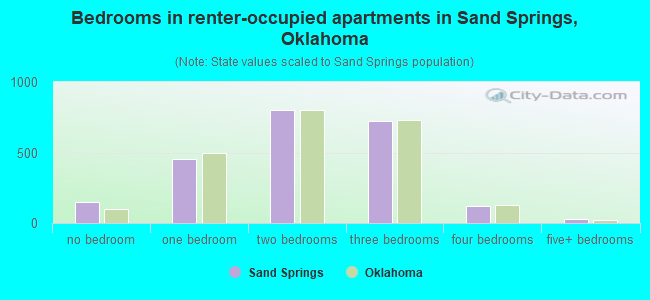
- Bedrooms in renter-occupied apartments in Sand Springs, Oklahoma
- 150no bedroom
- 4531 bedroom
- 8032 bedrooms
- 7223 bedrooms
- 1214 bedrooms
- 255+ bedrooms
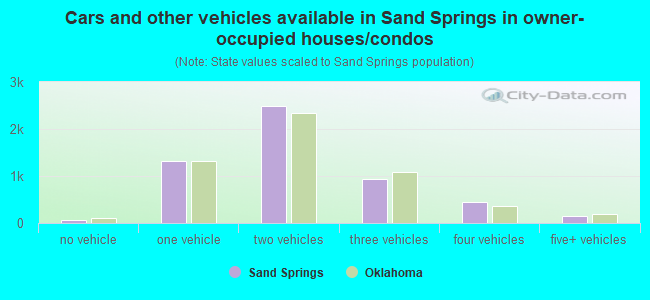
- Cars and other vehicles available in Sand Springs in owner-occupied houses/condos
- 74no vehicle
- 1,3181 vehicle
- 2,4902 vehicles
- 9393 vehicles
- 4444 vehicles
- 1525+ vehicles
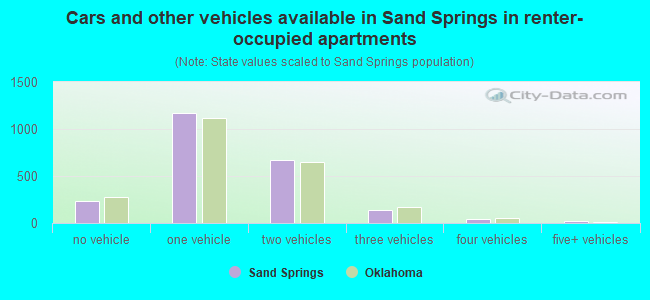
- Cars and other vehicles available in Sand Springs in renter-occupied apartments
- 237no vehicle
- 1,1701 vehicle
- 6652 vehicles
- 1363 vehicles
- 434 vehicles
- 225+ vehicles
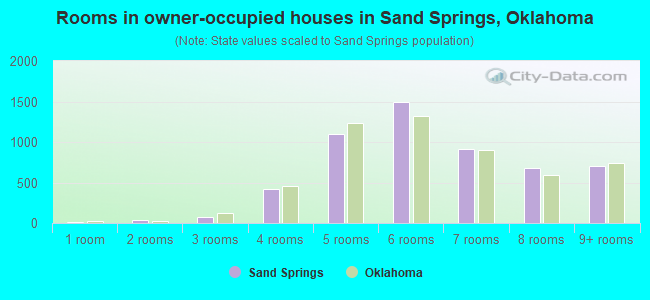
- Rooms in owner-occupied houses in Sand Springs, Oklahoma
- 141 room
- 412 rooms
- 743 rooms
- 4154 rooms
- 1,0955 rooms
- 1,4886 rooms
- 9097 rooms
- 6778 rooms
- 7049+ rooms
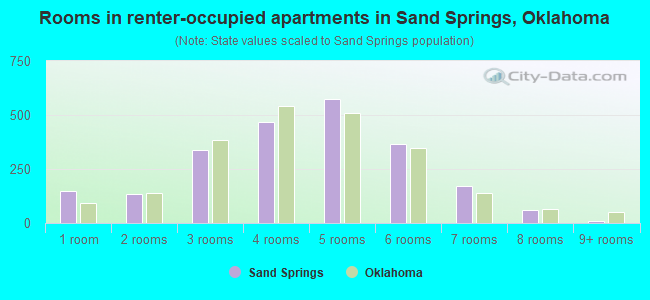
- Rooms in renter-occupied apartments in Sand Springs, Oklahoma
- 1501 room
- 1342 rooms
- 3403 rooms
- 4694 rooms
- 5765 rooms
- 3666 rooms
- 1727 rooms
- 588 rooms
- 99+ rooms
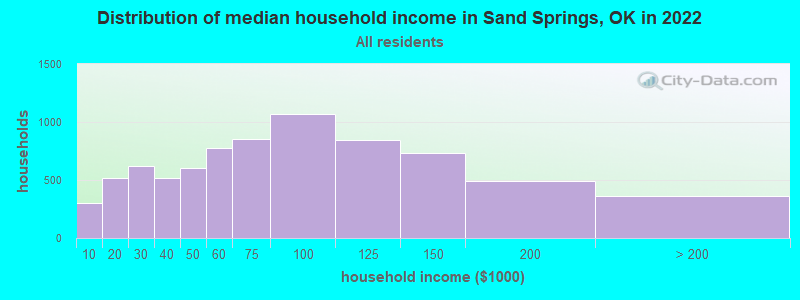
Sand Springs, OK household income distribution

- 303Less than $10,000
- 518$10,000 to $19,999
- 617$20,000 to $29,999
- 517$30,000 to $39,999
- 601$40,000 to $49,999
- 778$50,000 to $59,999
- 852$60,000 to $74,999
- 1,070$75,000 to $99,999
- 841$100,000 to $124,999
- 729$125,000 to $149,999
- 494$150,000 to $199,999
- 366$200,000 or more
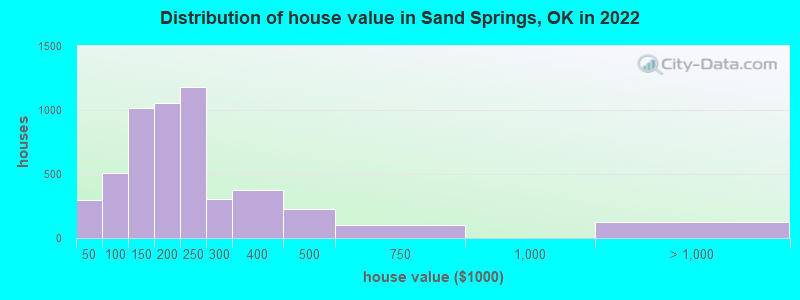
Home value of owner - occupied houses in 2022 in Sand Springs, OK
-
- 100Less than $10,000
- 31$10,000 to $14,999
- 16$15,000 to $19,999
- 30$20,000 to $24,999
- 21$25,000 to $29,999
- 27$30,000 to $34,999
- 13$35,000 to $39,999
- 54$40,000 to $49,999
- 63$50,000 to $59,999
- 31$60,000 to $69,999
- 109$70,000 to $79,999
- 106$80,000 to $89,999
- 138$90,000 to $99,999
- 575$100,000 to $124,999
- 436$125,000 to $149,999
- 627$150,000 to $174,999
- 428$175,000 to $199,999
- 1,177$200,000 to $249,999
- 307$250,000 to $299,999
- 378$300,000 to $399,999
- 223$400,000 to $499,999
- 101$500,000 to $749,999
- 116$1,000,000 to $1,499,999
- 9$2,000,000 or more
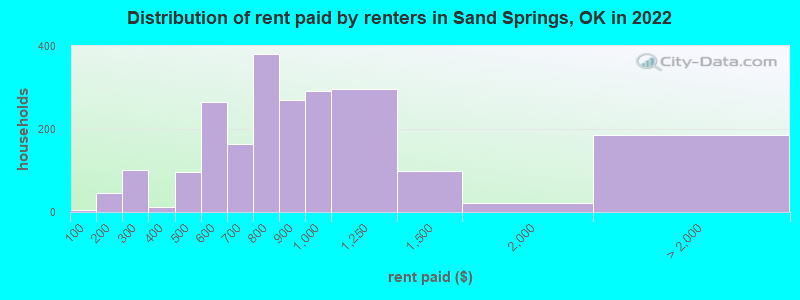
Rent paid by renters in 2022 in Sand Springs, OK
-
- 6Less than $100
- 8$100 to $149
- 38$150 to $199
- 81$200 to $249
- 19$250 to $299
- 7$300 to $349
- 4$350 to $399
- 20$400 to $449
- 75$450 to $499
- 114$500 to $549
- 150$550 to $599
- 79$600 to $649
- 83$650 to $699
- 159$700 to $749
- 221$750 to $799
- 269$800 to $899
- 291$900 to $999
- 297$1,000 to $1,249
- 98$1,250 to $1,499
- 21$1,500 to $1,999
- 32$2,000 to $2,499
- 152No cash rent
Percentage of workers working in this county: 86.0%
Number of people working at home: 588 (6.3% of all workers)
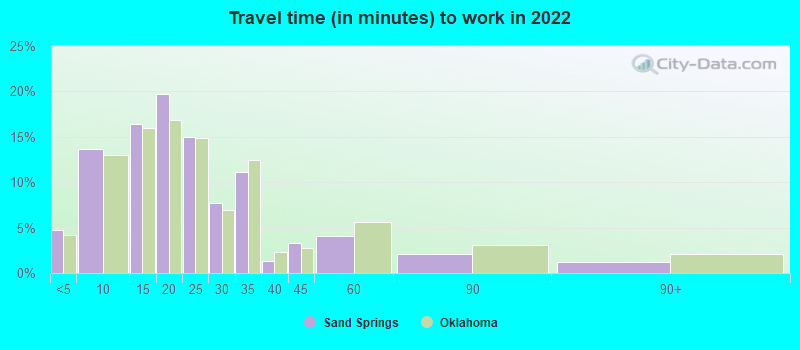
Travel time to work (commute)
- Less than 5 minutes: 340
- 5 to 9 minutes: 765
- 10 to 14 minutes: 1,288
- 15 to 19 minutes: 1,589
- 20 to 24 minutes: 2,016
- 25 to 29 minutes: 767
- 30 to 34 minutes: 1,310
- 35 to 39 minutes: 61
- 40 to 44 minutes: 101
- 45 to 59 minutes: 150
- 60 to 89 minutes: 67
- 90 or more minutes: 62
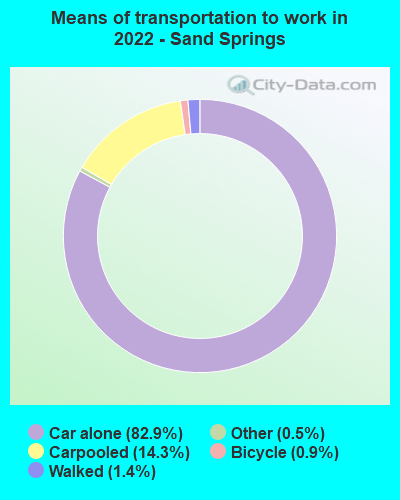
Means of transportation to work:
- Drove a car alone: 5,367 (75.7%)
- Carpooled: 955 (13.5%)
- Taxi: 30 (0.4%)
- Bicycle: 90 (1.3%)
- Walked: 96 (1.4%)
- Worked at home: 588 (8.3%)
- Unemployment by race in 2022
- Unemployment rate for White non-Hispanic residents
- 3.2%Males
- 2.6%Females
- Unemployment rate for Black residents
- 8.9%Males
- Unemployment rate for American Indian and Alaska Native residents
- 5.6%Males
- 4.2%Females
- Unemployment rate for two or more race residents
- 5.9%Males
- Unemployment rate for Hispanic or Latino residents
- 1.5%Males
- 2.6%Females
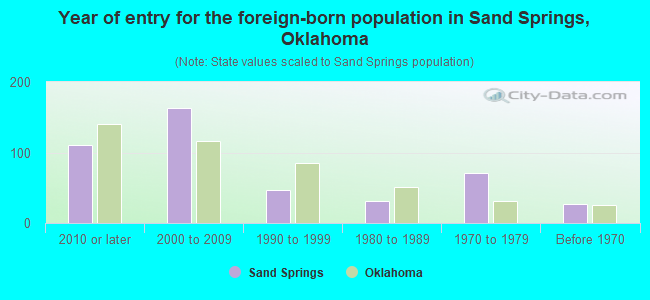
- Year of entry for the foreign-born population in Sand Springs, Oklahoma
- 1112010 or later
- 1632000 to 2009
- 471990 to 1999
- 311980 to 1989
- 711970 to 1979
- 27Before 1970
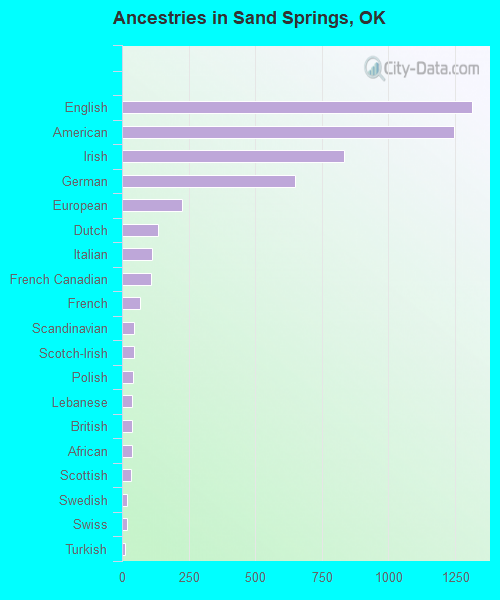
First ancestries reported:
- English: 1,312 (14.0%)
- American: 1,246 (13.3%)
- Irish: 834 (8.9%)
- German: 650 (6.9%)
- European: 225 (2.4%)
- Dutch: 135 (1.4%)
- Italian: 112 (1.2%)
- French Canadian: 107 (1.1%)
- French: 67 (0.7%)
- Scandinavian: 46 (0.5%)
- Scotch-Irish: 44 (0.5%)
- Polish: 41 (0.4%)
- Lebanese: 39 (0.4%)
- British: 37 (0.4%)
- African: 36 (0.4%)
- Scottish: 33 (0.4%)
- Swedish: 20 (0.2%)
- Swiss: 18 (0.2%)
- Turkish: 13 (0.1%)
- Canadian: 11 (0.1%)
- Cajun: 10 (0.1%)
- Norwegian: 10 (0.1%)
- Slavic: 10 (0.1%)
- Brazilian: 9 (0.10%)
- German Russian: 9 (0.10%)
- Dutch West Indian: 9 (0.10%)
- Eastern European: 6 (0.06%)
- Welsh: 5 (0.05%)
- Czech: 3 (0.03%)
Most common places of birth for foreign-born residents (%):
| Sand Springs: | 44.1% (167) |
| Oklahoma: | 42.4% (103,425) |
| Sand Springs: | 13.2% (50) |
| Oklahoma: | 4.2% (10,287) |
| Sand Springs: | 8.4% (32) |
| Oklahoma: | 0.0% (96) |
| Sand Springs: | 5.0% (19) |
| Oklahoma: | 2.3% (5,498) |
| Sand Springs: | 4.2% (16) |
| Oklahoma: | 0.1% (140) |
| Sand Springs: | 4.0% (15) |
| Oklahoma: | 2.3% (5,671) |
| Sand Springs: | 3.2% (12) |
| Oklahoma: | 1.7% (4,140) |
| Sand Springs: | 2.9% (11) |
| Oklahoma: | 1.0% (2,465) |
| Sand Springs: | 2.9% (11) |
| Oklahoma: | 0.2% (503) |
| Sand Springs: | 2.6% (10) |
| Oklahoma: | 1.6% (3,824) |
| Sand Springs: | 2.1% (8) |
| Oklahoma: | 0.2% (437) |
| Sand Springs: | 2.1% (8) |
| Oklahoma: | 2.0% (4,771) |
| Sand Springs: | 1.6% (6) |
| Oklahoma: | 0.1% (124) |
| Sand Springs: | 1.6% (6) |
| Oklahoma: | 0.8% (1,922) |
Place of birth for U.S.-born residents:
- This state: 13,624
- Other state: 5,899
- Northeast: 326
- Midwest: 1,778
- South: 2,054
- West: 1,774
91.3% of Sand Springs residents lived in the same house 1 years ago.
Out of people who lived in different houses, 37.4% lived in this county.
Out of people who lived in different counties, 79.8% lived in Oklahoma.
| Sand Springs: | 91.3% |
| State average: | 85.5% |
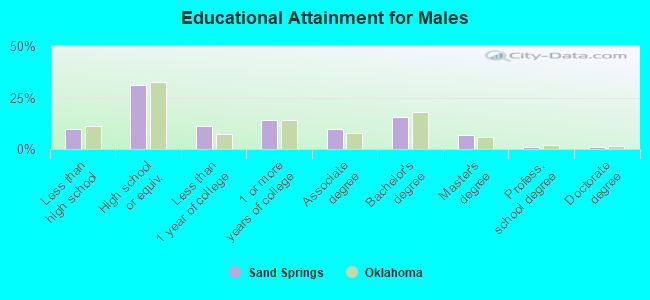
Education attainment for males 25 years and older:
- No schooling: 30
- Nursery to 4th grade: 0
- 5th and 6th grade: 35
- 7th and 8th grade: 35
- 9th grade: 62
- 10th grade: 79
- 11th grade: 244
- 12th grade, no diploma: 105
- High school graduate (or equivalency): 1,893
- Less than 1 year of college: 681
- Some college more than 1 year, no degree: 846
- Associate degree: 583
- Bachelor's degree: 930
- Master's degree: 414
- Professional school degree: 60
- Doctorate degree: 53
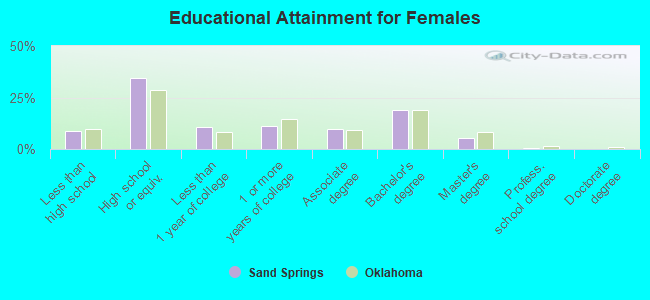
Education attainment for females 25 years and older:
- No schooling: 84
- Nursery to 4th grade: 19
- 5th and 6th grade: 19
- 7th and 8th grade: 44
- 9th grade: 58
- 10th grade: 112
- 11th grade: 148
- 12th grade, no diploma: 97
- High school graduate (or equivalency): 2,354
- Less than 1 year of college: 724
- Some college more than 1 year, no degree: 750
- Associate degree: 663
- Bachelor's degree: 1,303
- Master's degree: 377
- Professional school degree: 46
- Doctorate degree: 11
Housing units in structures:
- One, detached: 6,517
- One, attached: 230
- Two: 113
- 3 or 4: 233
- 5 to 9: 167
- 10 to 19: 289
- 20 to 49: 103
- 50 or more: 132
- Mobile homes: 241
- Boats, RVs, vans, etc.: 82
Median worth of mobile homes: $48,612
Housing units lacking complete kitchen facilities in 2022: 2.4%
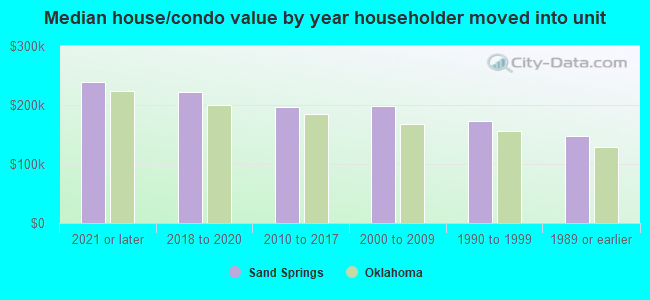
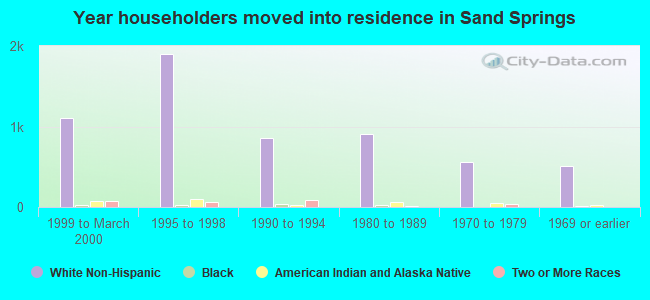
House/condo owner moved in on average 10 years ago
Renter moved in on average 4 years ago
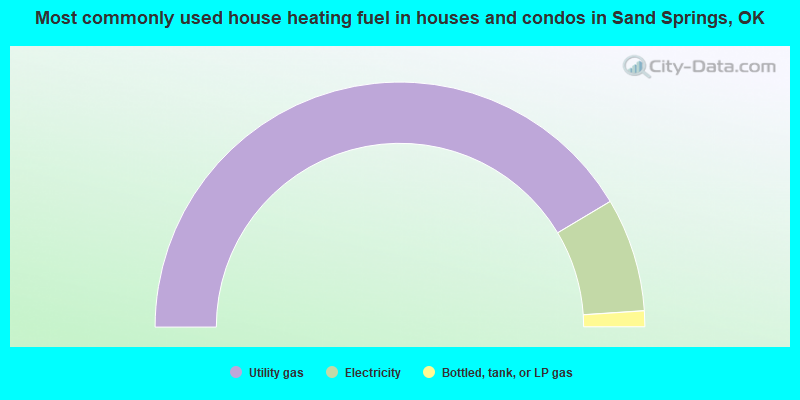
- 82.8%Utility gas
- 15.0%Electricity
- 2.1%Bottled, tank, or LP gas
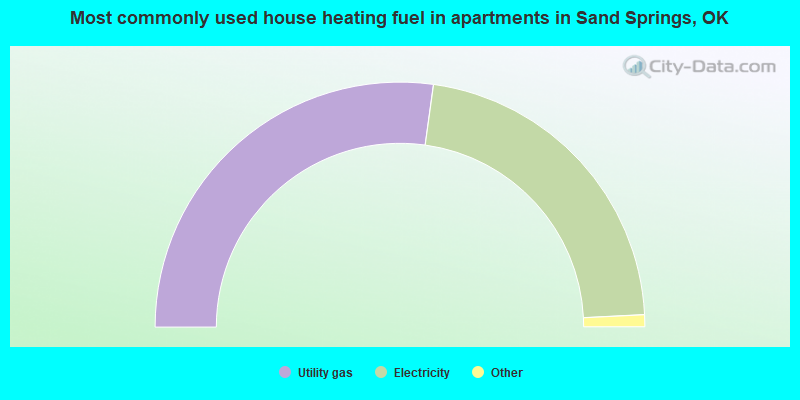
- 54.4%Utility gas
- 44.0%Electricity
- 1.0%Bottled, tank, or LP gas
- 0.3%Wood
- 0.3%No fuel used
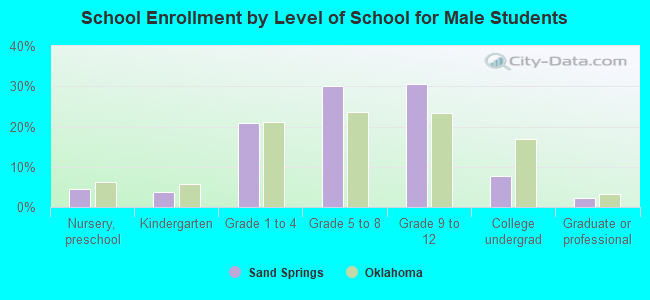
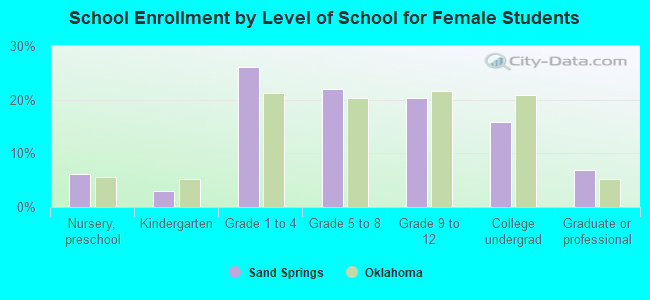
Private vs. public school enrollment:
| Here: | 16.5% |
| Oklahoma: | 11.7% |
| Here: | 14.0% |
| Oklahoma: | 11.7% |
| Here: | 13.9% |
| Oklahoma: | 19.3% |