Sandwich, MA (Massachusetts) Houses and Residents
| Sandwich: | $591,859 |
| Massachusetts: | $534,700 |
Mean price in 2022:
Detached houses: $583,573
Here: $583,573 State: $651,570 Townhouses or other attached units: $474,388
Here: $474,388 State: $617,749 In 2-unit structures: $591,619
Here: $591,619 State: $594,808 In 5-or-more-unit structures: $297,016
Here: $297,016 State: $555,768
Total population: 2,962 (Urban population: 2,910, Rural population: 128 (all nonfarm))
Houses: 2,013 (1,413 occupied: 1,132 owner occupied, 373 renter occupied)
| % of renters here: | 25% |
| State: | 38% |
Housing density: 562 houses/condos per square mile
Median price asked for vacant for-sale houses and condos in 2022: $568,438.
Median contract rent in 2022: $1,764 (lower quartile is $860, upper quartile is $1,982)
Median rent asked for vacant for-rent units in 2022: $2,409
Median gross rent in Sandwich, MA in 2022: $1,728
Housing units in Sandwich with a mortgage: 727 (129 second mortgage, 30 home equity loan, 72 both second mortgage and home equity loan)
Houses without a mortgage: 50
Median household income for houses/condos with a mortgage: $120,275
Median household income for apartments without a mortgage: $92,306
Median monthly housing costs: $1,794
Compare current foreclosures near Sandwich, MA:
| Photo | Address | Area | Beds / Baths | Price | Details |
|---|---|---|---|---|---|

|
#1
Old Fields Rd
Sandwich, MA 02563
|
1,932 sq. feet
|
2 baths 4 beds |
show details | |

|
#2
Dillingham Ave
Sandwich, MA 02563
|
1,008 sq. feet
|
1 baths 2 beds |
show details | |

|
#3
Tupper Ave
Sandwich, MA 02563
|
1,344 sq. feet
|
2 baths 3 beds |
show details | |

|
#4
Shawme Ave
Sandwich, MA 02563
|
- sq. feet
|
- baths - beds |
show details | |

|
#5
Leveridge Ln Apt 37
Sandwich, MA 02563
|
- sq. feet
|
- baths - beds |
show details | |

|
#6
W Falmouth Hwy
Falmouth, MA 02540
|
1,224 sq. feet
|
2 baths 4 beds |
$665,000
|
show details |

|
#7
Tananger Rd
Plymouth, MA 02360
|
1,836 sq. feet
|
3 baths 3 beds |
show details | |

|
#8
Swifts Beach Road A/k/a 84 Swift S Beach Road
Wareham, MA 02571
|
- sq. feet
|
1 baths 3 beds |
show details | |

|
#9
State Rd
Plymouth, MA 02360
|
1,836 sq. feet
|
2 baths 2 beds |
show details | |

|
#10
Terry Ln E
Wareham, MA 02571
|
1,412 sq. feet
|
1 baths 4 beds |
show details |
| Photo | Address | Area | Beds / Baths | Price | Details |
|---|---|---|---|---|---|

|
#11
Gosnold St
Hyannis, MA 02601
|
2,184 sq. feet
|
3 baths 4 beds |
show details | |

|
#12
Point Rd
Marion, MA 02738
|
660 sq. feet
|
1 baths 2 beds |
show details | |

|
#13
Orchid Ln
West Yarmouth, MA 02673
|
888 sq. feet
|
1 baths 2 beds |
show details | |

|
#14
Downey St
Plymouth, MA 02360
|
1,632 sq. feet
|
2 baths 3 beds |
show details | |

|
#15
Holly Cir # 16a
Buzzards Bay, MA 02532
|
1,451 sq. feet
|
1 baths 3 beds |
show details | |

|
#16
Quaker Run Rd
Mashpee, MA 02649
|
3,010 sq. feet
|
3 baths 4 beds |
show details | |

|
#17
Remington Ln
Plymouth, MA 02360
|
1,758 sq. feet
|
3 baths 3 beds |
show details | |

|
#18
Amos Hill Rd
Plymouth, MA 02360
|
2,075 sq. feet
|
2 baths 3 beds |
show details | |

|
#19
Pine Grove Ave
Hyannis, MA 02601
|
720 sq. feet
|
1 baths 2 beds |
show details | |

|
#20
Bailey Dr
East Falmouth, MA 02536
|
1,328 sq. feet
|
2 baths 3 beds |
show details |
| Photo | Address | Area | Beds / Baths | Price | Details |
|---|---|---|---|---|---|

|
#21
14th Ave
Wareham, MA 02571
|
936 sq. feet
|
1 baths 2 beds |
show details | |

|
#22
10th Ave
Wareham, MA 02571
|
1,216 sq. feet
|
1 baths 3 beds |
show details | |

|
#23
7th Ave
Wareham, MA 02571
|
1,175 sq. feet
|
1 baths 3 beds |
show details | |

|
#24
Sunset Ter
Hyannis, MA 02601
|
1,783 sq. feet
|
1 baths 3 beds |
show details | |

|
#25
Crofton Ln
East Falmouth, MA 02536
|
1,642 sq. feet
|
2 baths 4 beds |
show details | |

|
#26
King Fisher Ln
Plymouth, MA 02360
|
3,781 sq. feet
|
3 baths 4 beds |
show details | |

|
#27
Mitchells Way
Hyannis, MA 02601
|
1,040 sq. feet
|
1 baths 4 beds |
show details | |

|
#28
Braxton Rd
East Falmouth, MA 02536
|
1,184 sq. feet
|
1 baths 3 beds |
show details | |

|
#29
W Hyannisport Cir
Hyannis, MA 02601
|
2,386 sq. feet
|
2 baths 4 beds |
show details | |

|
#30
Pitchers Way
Hyannis, MA 02601
|
1,816 sq. feet
|
2 baths 2 beds |
show details |
| Photo | Address | Area | Beds / Baths | Price | Details |
|---|---|---|---|---|---|

|
#31
Oakmont Rd
Yarmouth Port, MA 02675
|
2,141 sq. feet
|
2 baths 3 beds |
show details | |

|
#32
Mulberry St
Hyannis, MA 02601
|
950 sq. feet
|
1 baths 3 beds |
show details | |

|
#33
Edgewater Dr E
East Falmouth, MA 02536
|
4,295 sq. feet
|
5 baths 3 beds |
show details | |

|
#34
Charlotte Furnace Rd
West Wareham, MA 02576
|
1,100 sq. feet
|
1 baths 3 beds |
show details | |

|
#35
Sophie Ln
East Falmouth, MA 02536
|
1,344 sq. feet
|
2 baths 4 beds |
show details | |

|
#36
Murphy Rd
Hyannis, MA 02601
|
1,074 sq. feet
|
1 baths 3 beds |
show details | |

|
#37
Tall Pines Rd
Plymouth, MA 02360
|
1,606 sq. feet
|
1 baths 3 beds |
show details | |

|
#38
Sailfish Dr
East Falmouth, MA 02536
|
1,539 sq. feet
|
2 baths 4 beds |
show details | |

|
#39
Fawcett Ln
Hyannis, MA 02601
|
1,004 sq. feet
|
1 baths 3 beds |
show details | |

|
#40
Rudder Rd
Hyannis, MA 02601
|
1,436 sq. feet
|
1 baths 3 beds |
show details |
| Photo | Address | Area | Beds / Baths | Price | Details |
|---|---|---|---|---|---|

|
#41
Naushon Rd
West Wareham, MA 02576
|
1,176 sq. feet
|
1 baths 3 beds |
show details | |

|
#42
Esta Rd
Plymouth, MA 02360
|
850 sq. feet
|
1 baths 2 beds |
show details | |

|
#43
Acacia Rd
Plymouth, MA 02360
|
1,408 sq. feet
|
1 baths 3 beds |
show details | |

|
#44
Pond St
Centerville, MA 02632
|
980 sq. feet
|
1 baths 2 beds |
show details | |

|
#45
Geggatt Rd
East Falmouth, MA 02536
|
2,418 sq. feet
|
4 baths 4 beds |
show details | |

|
#46
Kennedy Pkwy
Plymouth, MA 02360
|
2,042 sq. feet
|
2 baths 4 beds |
show details | |

|
#47
Sachem Dr
Centerville, MA 02632
|
2,064 sq. feet
|
3 baths 4 beds |
show details | |

|
#48
Conners Rd
Centerville, MA 02632
|
2,240 sq. feet
|
3 baths 4 beds |
show details | |

|
#49
S Main St
Centerville, MA 02632
|
2,511 sq. feet
|
2 baths 5 beds |
show details | |

|
Check over 1 million property listings on Foreclosure.com!
|
browse all offers | |||

Latest news about housing in Sandwich, MA collected exclusively by city-data.com from local newspapers, TV, and radio stations

 | How Much Massachusetts Households Make Per Year: Census Data (37 replies) |
| Summer home in Cape Cod to rent out for eventual retirement (31 replies) |
| What Are the Cheapest and Most Expensive Single Family Home For Sale In Your Town? (50 replies) |
| Tree House Brewing Cape Cod (42 replies) |
| Where to stay on cape cod (and is it worth going in April)? (71 replies) |
| okay, i'm just floored (83 replies) |

Median year apartment built: 1939
Household type by relationship:
Households: 2,986- Male householders: 599 (110 living alone), Female householders: 822 (316 living alone)
685 spouses (676 opposite-sex spouses), 119 unmarried partners, (108 opposite-sex unmarried partners), 584 children (481 natural, 24 adopted, 79 stepchildren), 37 grandchildren, 0 brothers or sisters, 50 parents, 0 foster children, 40 other relatives, 31 non-relatives
- In group quarters: 14
Size of family households: 685 2-persons, 116 3-persons, 44 4-persons, 65 5-persons, 12 6-persons.
Size of nonfamily households: 456 1-person, 105 2-persons, 12 3-persons.
199 married couples with children.
98 single-parent households (29 men, 69 women).
94.7% of residents of Sandwich speak English at home.
4.4% of residents speak Spanish at home (88% speak English very well, 12% speak English well).
1.0% of residents speak other Indo-European language at home (100% speak English very well).
0.3% of residents speak Asian or Pacific Island language at home (100% speak English very well).
Foreign born population: 114 (3.8%)
(98.2% of them are naturalized citizens)
| Here: | 6.3 |
| State: | 6.5 |
| Here: | 5.7 |
| State: | 4.0 |

- Bedrooms in owner-occupied houses and condos in Sandwich, Massachusetts
- 9no bedroom
- 231 bedroom
- 3512 bedrooms
- 4643 bedrooms
- 2184 bedrooms
- 695+ bedrooms

- Bedrooms in renter-occupied apartments in Sandwich, Massachusetts
- 16no bedroom
- 461 bedroom
- 862 bedrooms
- 2023 bedrooms
- 244 bedrooms
- 05+ bedrooms

- Cars and other vehicles available in Sandwich in owner-occupied houses/condos
- 15no vehicle
- 3571 vehicle
- 5252 vehicles
- 1743 vehicles
- 424 vehicles
- 195+ vehicles

- Cars and other vehicles available in Sandwich in renter-occupied apartments
- 43no vehicle
- 1031 vehicle
- 572 vehicles
- 1703 vehicles
- 04 vehicles
- 05+ vehicles

- Rooms in owner-occupied houses in Sandwich, Massachusetts
- 91 room
- 02 rooms
- 243 rooms
- 1024 rooms
- 2345 rooms
- 2566 rooms
- 1897 rooms
- 1688 rooms
- 1519+ rooms

- Rooms in renter-occupied apartments in Sandwich, Massachusetts
- 161 room
- 102 rooms
- 663 rooms
- 304 rooms
- 345 rooms
- 1726 rooms
- 07 rooms
- 358 rooms
- 109+ rooms


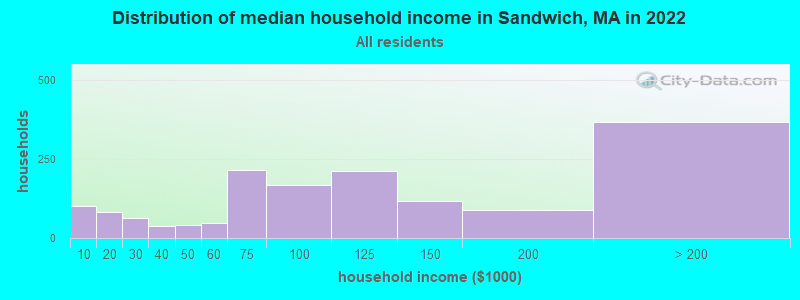
Sandwich, MA household income distribution

- 100Less than $10,000
- 83$10,000 to $19,999
- 63$20,000 to $29,999
- 39$30,000 to $39,999
- 42$40,000 to $49,999
- 47$50,000 to $59,999
- 216$60,000 to $74,999
- 168$75,000 to $99,999
- 213$100,000 to $124,999
- 116$125,000 to $149,999
- 89$150,000 to $199,999
- 367$200,000 or more
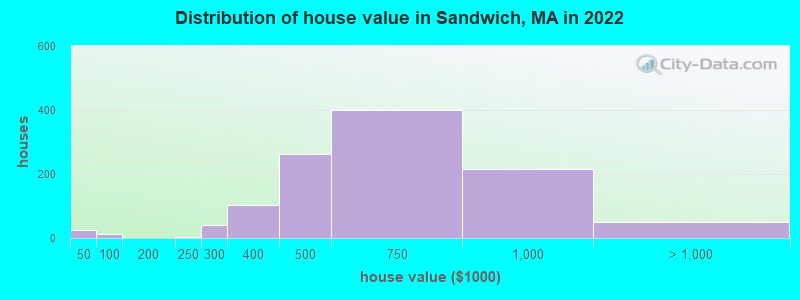
Home value of owner - occupied houses in 2022 in Sandwich, MA
-
- 4Less than $10,000
- 20$35,000 to $39,999
- 14$50,000 to $59,999
- 3$200,000 to $249,999
- 41$250,000 to $299,999
- 103$300,000 to $399,999
- 262$400,000 to $499,999
- 400$500,000 to $749,999
- 215$750,000 to $999,999
- 49$1,000,000 to $1,499,999
Rent paid by renters in 2022 in Sandwich, MA
-
- 7$200 to $249
- 11$300 to $349
- 18$350 to $399
- 14$550 to $599
- 17$600 to $649
- 14$900 to $999
- 13$1,000 to $1,249
- 6$1,250 to $1,499
- 179$1,500 to $1,999
- 50$2,000 to $2,499
- 24$3,500 or more
- 8No cash rent


Percentage of workers working in this county: 88.1%
Number of people working at home: 318 (21.7% of all workers)
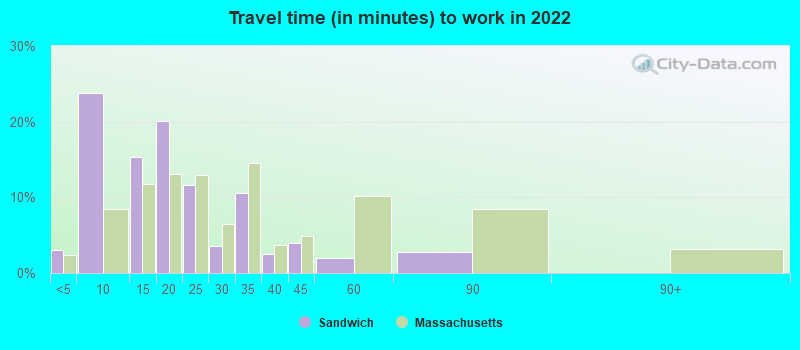
Travel time to work (commute)
- Less than 5 minutes: 78
- 5 to 9 minutes: 312
- 10 to 14 minutes: 51
- 15 to 19 minutes: 56
- 20 to 24 minutes: 223
- 25 to 29 minutes: 90
- 30 to 34 minutes: 137
- 35 to 39 minutes: 0
- 40 to 44 minutes: 9
- 45 to 59 minutes: 129
- 60 to 89 minutes: 36
- 90 or more minutes: 37
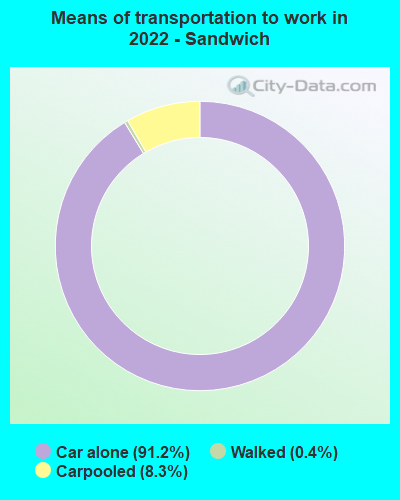
Means of transportation to work:
- Drove a car alone: 1,470 (75.5%)
- Carpooled: 132 (6.8%)
- Walked: 4 (0.2%)
- Worked at home: 318 (16.3%)

- Unemployment by race in 2022
- Unemployment rate for White non-Hispanic residents
- 3.8%Males
- 3.2%Females

- Year of entry for the foreign-born population in Sandwich, Massachusetts
- 02010 or later
- 602000 to 2009
- 141990 to 1999
- 281980 to 1989
- 521970 to 1979
- 78Before 1970

First ancestries reported:
- Irish: 273 (23.5%)
- English: 159 (13.7%)
- American: 102 (8.8%)
- Italian: 69 (5.9%)
- German: 56 (4.8%)
- Scotch-Irish: 37 (3.2%)
- Polish: 32 (2.7%)
- Swedish: 27 (2.3%)
- French: 25 (2.1%)
- Scottish: 22 (1.9%)
- Northern European: 21 (1.8%)
- French Canadian: 20 (1.7%)
- Portuguese: 13 (1.1%)
- European: 12 (1.0%)
- Russian: 9 (0.8%)
- Lebanese: 8 (0.7%)
- Czechoslovakian: 5 (0.4%)
- Dutch: 4 (0.3%)
- Welsh: 4 (0.3%)
- Eastern European: 3 (0.3%)
Most common places of birth for foreign-born residents (%):
| Sandwich: | 66.9% (81) |
| Massachusetts: | 0.6% (7,301) |
| Sandwich: | 10.7% (13) |
| Massachusetts: | 2.3% (28,158) |
| Sandwich: | 6.6% (8) |
| Massachusetts: | 0.2% (2,282) |
| Sandwich: | 5.8% (7) |
| Massachusetts: | 0.6% (7,064) |
| Sandwich: | 5.8% (7) |
| Massachusetts: | 1.0% (12,529) |
| Sandwich: | 3.3% (4) |
| Massachusetts: | 0.4% (4,735) |
Place of birth for U.S.-born residents:
- This state: 1,847
- Other state: 933
- Northeast: 599
- Midwest: 136
- South: 145
- West: 49
94.4% of Sandwich residents lived in the same house 1 years ago.
Out of people who lived in different houses, 37.8% lived in this county.
Out of people who lived in different counties, 75.8% lived in Massachusetts.
| Sandwich: | 94.4% |
| State average: | 87.7% |
Education attainment for males 25 years and older:
- No schooling: 0
- Nursery to 4th grade: 8
- 5th and 6th grade: 0
- 7th and 8th grade: 0
- 9th grade: 0
- 10th grade: 10
- 11th grade: 9
- 12th grade, no diploma: 0
- High school graduate (or equivalency): 240
- Less than 1 year of college: 70
- Some college more than 1 year, no degree: 63
- Associate degree: 101
- Bachelor's degree: 384
- Master's degree: 189
- Professional school degree: 38
- Doctorate degree: 16

Education attainment for females 25 years and older:
- No schooling: 11
- Nursery to 4th grade: 0
- 5th and 6th grade: 0
- 7th and 8th grade: 0
- 9th grade: 0
- 10th grade: 0
- 11th grade: 10
- 12th grade, no diploma: 12
- High school graduate (or equivalency): 150
- Less than 1 year of college: 30
- Some college more than 1 year, no degree: 96
- Associate degree: 163
- Bachelor's degree: 525
- Master's degree: 263
- Professional school degree: 28
- Doctorate degree: 52


Housing units in structures:
- One, detached: 1,609
- One, attached: 59
- Two: 29
- 3 or 4: 31
- 5 to 9: 146
- 10 to 19: 18
- 20 to 49: 101
- 50 or more: 18
Housing units lacking complete kitchen facilities in 2022: 1.2%
House/condo owner moved in on average 10 years ago
Renter moved in on average 5 years ago

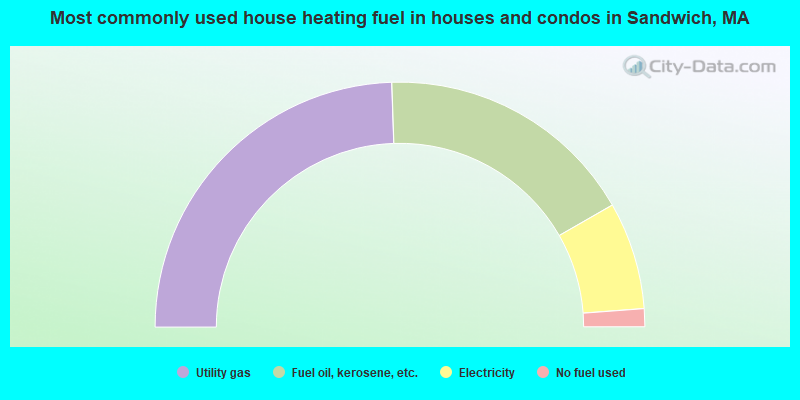
- 49.0%Utility gas
- 34.5%Fuel oil, kerosene, etc.
- 14.2%Electricity
- 2.4%No fuel used
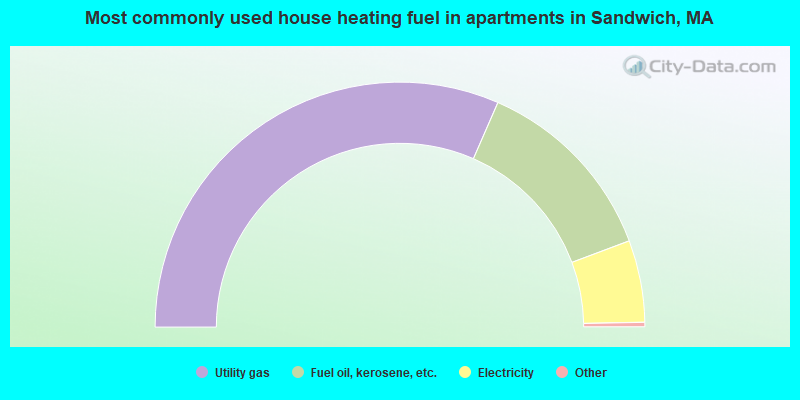
- 63.5%Utility gas
- 25.6%Fuel oil, kerosene, etc.
- 10.9%Electricity
Private vs. public school enrollment:
| Here: | 0.0% |
| Massachusetts: | 10.3% |
| Here: | 38.4% |
| Massachusetts: | 12.3% |
| Here: | 56.0% |
| Massachusetts: | 51.2% |


