Jump to a detailed profile or search site with Google Custom Search

Santa Barbara, CA (California) Houses and Residents

Estimated median house or condo value in 2022: $1,666,000 (it was $469,300 in 2000)
Santa Barbara:

$1,666,000
California:

$715,900
Lower value quartile - upper value quartile: $1,025,300 - $2,000,001

Mean price in 2022:

Detached houses: $1,965,633
Here:

$1,965,633
State:

$988,808

Townhouses or other attached units: $1,111,912
Here:

$1,111,912
State:

$838,546

In 2-unit structures: $423,372
Here:

$423,372
State:

$1,138,100

In 3-to-4-unit structures: $1,447,376
Here:

$1,447,376
State:

$824,253

In 5-or-more-unit structures: $492,360
Here:

$492,360
State:

$730,996

Mobile homes: $48,003
Here:

$48,003
State:

$184,506

Total population: 91,196 (All urban)

Houses: 39,008 (36,602 occupied: 13,634 owner occupied, 22,968 renter occupied)

% of renters here:

63%
State:

44%

Housing density: 2,056 houses/condos per square mile

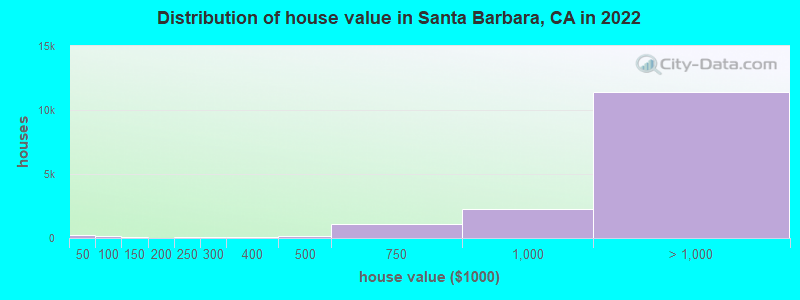
Median price asked for vacant for-sale houses and condos in 2022: $1,558,763.

Median contract rent in 2022: over $2,000 (lower quartile is $1,669, upper quartile is over $2,000)


Median rent asked for vacant for-rent units in 2022: $3,672


Median gross rent in Santa Barbara, CA in 2022: over $2,000

Housing units in Santa Barbara with a mortgage: 7,834 (1,055 second mortgage, 0 home equity loan, 893 both second mortgage and home equity loan)
Houses without a mortgage: 227

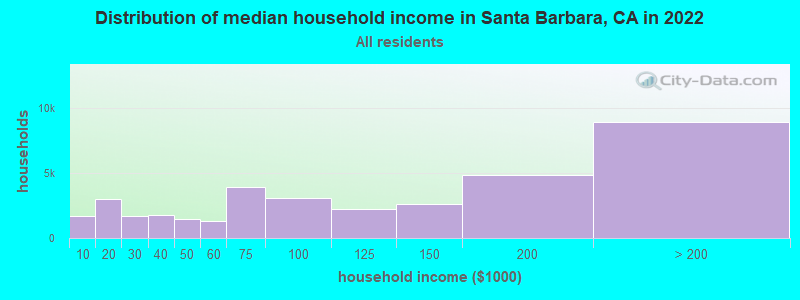
Median household income for houses/condos with a mortgage: $186,476

Median household income for apartments without a mortgage: $114,279

Median monthly housing costs: $2,310

Compare current foreclosures in Santa Barbara, CA:

Check out more offers in Santa Barbara, CA.
Powered by Foreclosure.com

Settings
X
Data:
Loading data...
Based on 2000-2022 data
Loading data...

123
Hide US histogram

Santa Barbara, California Age and Sex of Residents
Median year house/condo built: 1959

Median year apartment built: 1972

Household type by relationship:

Households: 87,519
  • Male householders: 18,268 (5,058 living alone), Female householders: 18,334 (6,386 living alone)
  • 13,507 spouses (13,109 opposite-sex spouses), 3,642 unmarried partners, (3,480 opposite-sex unmarried partners), 17,745 children (17,517 natural, 0 adopted, 228 stepchildren), 1,607 grandchildren, 1,499 brothers or sisters, 1,156 parents, 57 foster children, 2,749 other relatives, 6,992 non-relatives
  • In group quarters: 1,963

Size of family households: 8,411 2-persons, 3,995 3-persons, 3,329 4-persons, 1,441 5-persons, 1,138 6-persons, 269 7-or-more-persons.

Size of nonfamily households: 11,444 1-person, 4,765 2-persons, 1,068 3-persons, 662 4-persons, 80 5-persons.

7,445 married couples with children.
3,863 single-parent households (1,211 men, 2,652 women).

68.0% of residents of Santa Barbara speak English at home.
25.8% of residents speak Spanish at home (58% speak English very well, 14% speak English well, 21% speak English not well, 7% don't speak English at all).
3.7% of residents speak other Indo-European language at home (81% speak English very well, 18% speak English well).
2.1% of residents speak Asian or Pacific Island language at home (51% speak English very well, 32% speak English well, 13% speak English not well, 4% don't speak English at all).
0.3% of residents speak other language at home (73% speak English very well, 5% speak English well, 21% speak English not well).

Foreign born population: 17,825 (20.4%)
(41.5% of them are naturalized citizens)

Median number of rooms in houses and condos:
Here:

6.2
State:

6.0

Median number of rooms in apartments
Here:

3.8
State:

3.9

Owner-occupied Renter-occupied
Bedrooms in owner-occupied houses and condos in Santa Barbara, California
  • Bedrooms in owner-occupied houses and condos in Santa Barbara, California
  • 101no bedroom
  • 1141 bedroom
  • 3,6352 bedrooms
  • 6,4373 bedrooms
  • 2,5574 bedrooms
  • 7905+ bedrooms
Bedrooms in renter-occupied apartments in Santa Barbara, California
  • Bedrooms in renter-occupied apartments in Santa Barbara, California
  • 2,657no bedroom
  • 6,5831 bedroom
  • 8,7482 bedrooms
  • 3,9163 bedrooms
  • 9234 bedrooms
  • 1415+ bedrooms
Owner-occupied Renter-occupied
Cars and other vehicles available in Santa Barbara in owner-occupied houses/condos
  • Cars and other vehicles available in Santa Barbara in owner-occupied houses/condos
  • 387no vehicle
  • 3,3721 vehicle
  • 5,9092 vehicles
  • 2,2583 vehicles
  • 1,4214 vehicles
  • 2875+ vehicles
Cars and other vehicles available in Santa Barbara in renter-occupied apartments
  • Cars and other vehicles available in Santa Barbara in renter-occupied apartments
  • 2,303no vehicle
  • 10,4151 vehicle
  • 6,2032 vehicles
  • 3,1803 vehicles
  • 4714 vehicles
  • 3965+ vehicles
Owner-occupied Renter-occupied
Rooms in owner-occupied houses in Santa Barbara, California
  • Rooms in owner-occupied houses in Santa Barbara, California
  • 631 room
  • 382 rooms
  • 4953 rooms
  • 1,1284 rooms
  • 2,5295 rooms
  • 3,5526 rooms
  • 2,1687 rooms
  • 1,5488 rooms
  • 2,1139+ rooms
Rooms in renter-occupied apartments in Santa Barbara, California
  • Rooms in renter-occupied apartments in Santa Barbara, California
  • 2,1461 room
  • 2,4022 rooms
  • 5,2873 rooms
  • 6,5294 rooms
  • 2,9925 rooms
  • 1,5846 rooms
  • 9967 rooms
  • 2858 rooms
  • 7479+ rooms
Year house built
Median 2022 house/condo value by year built
Median house/condo value by year householder moved into unit
Breakdown of mean house values by ages of householders
Owners and renters by unit type in Santa Barbara, CA
  • Santa Barbara, CA household income distribution

  • Distribution of median household income in Santa Barbara, CA in 2022
  • 1,661Less than $10,000
  • 3,011$10,000 to $19,999
  • 1,689$20,000 to $29,999
  • 1,752$30,000 to $39,999
  • 1,482$40,000 to $49,999
  • 1,324$50,000 to $59,999
  • 3,955$60,000 to $74,999
  • 3,107$75,000 to $99,999
  • 2,208$100,000 to $124,999
  • 2,623$125,000 to $149,999
  • 4,860$150,000 to $199,999
  • 8,930$200,000 or more
  • Home value of owner - occupied houses in 2022 in Santa Barbara, CA

  • Distribution of house value in Santa Barbara, CA in 2022
  • 155Less than $10,000
  • 35$10,000 to $14,999
  • 22$15,000 to $19,999
  • 31$20,000 to $24,999
  • 16$35,000 to $39,999
  • 12$50,000 to $59,999
  • 55$60,000 to $69,999
  • 14$70,000 to $79,999
  • 68$80,000 to $89,999
  • 28$100,000 to $124,999
  • 29$125,000 to $149,999
  • 12$150,000 to $174,999
  • 20$175,000 to $199,999
  • 76$200,000 to $249,999
  • 90$250,000 to $299,999
  • 78$300,000 to $399,999
  • 141$400,000 to $499,999
  • 1,117$500,000 to $749,999
  • 2,254$750,000 to $999,999
  • 3,644$1,000,000 to $1,499,999
  • 2,892$1,500,000 to $1,999,999
  • 4,881$2,000,000 or more
  • Rent paid by renters in 2022 in Santa Barbara, CA

  • Distribution of rent paid by renters in Santa Barbara, CA in 2022
  • 108Less than $100
  • 13$100 to $149
  • 37$150 to $199
  • 172$200 to $249
  • 198$250 to $299
  • 250$300 to $349
  • 95$350 to $399
  • 25$400 to $449
  • 78$450 to $499
  • 29$500 to $549
  • 205$550 to $599
  • 218$600 to $649
  • 20$650 to $699
  • 54$700 to $749
  • 103$750 to $799
  • 210$800 to $899
  • 345$900 to $999
  • 1,143$1,000 to $1,249
  • 1,516$1,250 to $1,499
  • 5,141$1,500 to $1,999
  • 4,310$2,000 to $2,499
  • 2,833$2,500 to $2,999
  • 2,475$3,000 to $3,499
  • 2,923$3,500 or more
  • 442No cash rent
Time Leaving Home To Go To Work in 2022

Percentage of workers working in this county: 96.7%
Number of people working at home: 7,883 (17.7% of all workers)

Travel time (in minutes) to work in 2022

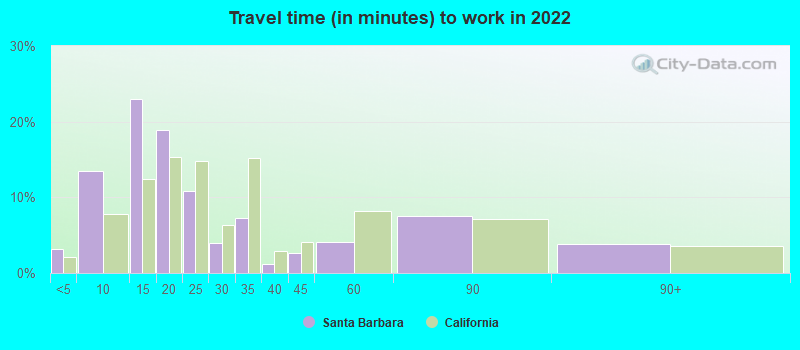
Travel time to work (commute)

  • Less than 5 minutes: 1,042
  • 5 to 9 minutes: 6,848
  • 10 to 14 minutes: 10,906
  • 15 to 19 minutes: 9,245
  • 20 to 24 minutes: 3,080
  • 25 to 29 minutes: 1,411
  • 30 to 34 minutes: 1,382
  • 35 to 39 minutes: 288
  • 40 to 44 minutes: 366
  • 45 to 59 minutes: 519
  • 60 to 89 minutes: 582
  • 90 or more minutes: 965
Means of transportation to work in 2022 - Santa Barbara

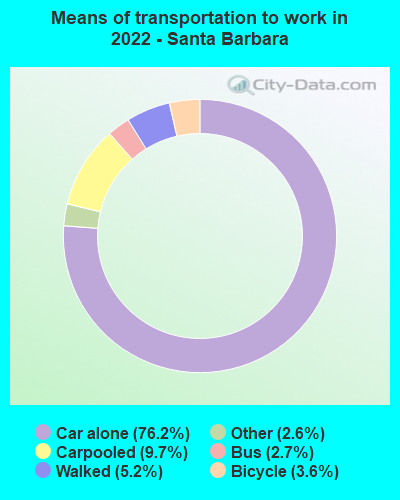
Means of transportation to work:

  • Drove a car alone: 43,038 (66.9%)
  • Carpooled: 5,462 (8.5%)
  • Bus: 1,506 (2.3%)
  • Taxi: 1,479 (2.3%)
  • Bicycle: 2,026 (3.1%)
  • Walked: 2,947 (4.6%)
  • Worked at home: 7,883 (12.3%)
Class of Workers in 2022
  • Unemployment by race in 2022
  • Unemployment rate for White non-Hispanic residents
  • 2.5%Males
  • 2.9%Females
  • Unemployment rate for Black residents
  • 14.4%Males
  • 13.2%Females
  • Unemployment rate for American Indian and Alaska Native residents
  • 1.0%Males
  • 9.0%Females
  • Unemployment rate for Asian residents
  • 8.7%Males
  • 0.6%Females
  • Unemployment rate for other race residents
  • 2.4%Males
  • 3.4%Females
  • Unemployment rate for two or more race residents
  • 3.9%Males
  • 9.4%Females
  • Unemployment rate for Hispanic or Latino residents
  • 7.2%Males
  • 6.1%Females
Year of entry for the foreign-born population in Santa Barbara, California
  • Year of entry for the foreign-born population in Santa Barbara, California
  • 3,4272010 or later
  • 4,0682000 to 2009
  • 4,0921990 to 1999
  • 7,1911980 to 1989
  • 3,0701970 to 1979
  • 3,970Before 1970
Ancestries in Santa Barbara, CA

First ancestries reported:

  • English: 2,451 (5.4%)
  • Irish: 1,963 (4.4%)
  • Italian: 1,787 (4.0%)
  • German: 1,566 (3.5%)
  • American: 1,481 (3.3%)
  • European: 1,441 (3.2%)
  • Scottish: 675 (1.5%)
  • Iranian: 564 (1.3%)
  • British: 390 (0.9%)
  • Norwegian: 388 (0.9%)
  • Polish: 364 (0.8%)
  • Russian: 360 (0.8%)
  • Scotch-Irish: 337 (0.7%)
  • French: 289 (0.6%)
  • Swedish: 255 (0.6%)
  • Hungarian: 196 (0.4%)
  • Northern European: 191 (0.4%)
  • Eastern European: 189 (0.4%)
  • Dutch: 162 (0.4%)
  • Scandinavian: 158 (0.4%)
  • Canadian: 157 (0.3%)
  • Danish: 149 (0.3%)
  • Czech: 139 (0.3%)
  • Brazilian: 128 (0.3%)
  • Greek: 122 (0.3%)
  • Israeli: 121 (0.3%)
  • Ukrainian: 120 (0.3%)
  • Welsh: 107 (0.2%)
  • Swiss: 103 (0.2%)
  • French Canadian: 83 (0.2%)
  • Arab: 74 (0.2%)
  • Afghan: 73 (0.2%)
  • South African: 64 (0.1%)
  • Egyptian: 62 (0.1%)
  • Belgian: 56 (0.1%)
  • Bulgarian: 54 (0.1%)
  • Croatian: 35 (0.08%)
  • Ethiopian: 34 (0.08%)
  • Portuguese: 33 (0.07%)
  • Turkish: 33 (0.07%)
  • Finnish: 30 (0.07%)
  • Armenian: 30 (0.07%)
  • Haitian: 30 (0.07%)
  • Basque: 28 (0.06%)
  • Austrian: 28 (0.06%)
  • Lebanese: 21 (0.05%)
  • Czechoslovakian: 20 (0.04%)
  • Australian: 18 (0.04%)
  • Lithuanian: 17 (0.04%)
  • Syrian: 14 (0.03%)
  • Celtic: 9 (0.02%)
  • African: 8 (0.02%)
  • Yugoslavian: 8 (0.02%)
  • Macedonian: 5 (0.01%)

Most common places of birth for foreign-born residents (%):

Mexico
Santa Barbara:

52.3% (9,749)
California:

37.2% (3,881,193)

Guatemala
Santa Barbara:

6.5% (1,214)
California:

2.8% (290,436)

Iran
Santa Barbara:

2.5% (463)
California:

2.0% (206,004)

Canada
Santa Barbara:

2.5% (462)
California:

1.2% (127,477)

England
Santa Barbara:

2.2% (418)
California:

0.6% (57,953)

Vietnam
Santa Barbara:

1.9% (361)
California:

4.9% (512,335)

Germany
Santa Barbara:

1.9% (351)
California:

0.7% (73,304)

China, excluding Hong Kong and Taiwan
Santa Barbara:

1.9% (349)
California:

6.6% (684,672)

France
Santa Barbara:

1.8% (344)
California:

0.4% (40,224)

El Salvador
Santa Barbara:

1.8% (336)
California:

4.2% (440,287)

India
Santa Barbara:

1.8% (336)
California:

5.2% (539,184)

Place of birth for U.S.-born residents:

  • This state: 45,469
  • Other state: 23,174
  • Northeast: 6,786
  • Midwest: 6,057
  • South: 6,091
  • West: 4,240

84.0% of Santa Barbara residents lived in the same house 1 years ago.
   Out of people who lived in different houses, 41.7% lived in this county.
   Out of people who lived in different counties, 52.9% lived in California.


Santa Barbara:

84.0%
State average:

88.9%

Education attainment for males 25 years and older:

  • No schooling: 1,091
  • Nursery to 4th grade: 194
  • 5th and 6th grade: 262
  • 7th and 8th grade: 364
  • 9th grade: 0
  • 10th grade: 126
  • 11th grade: 434
  • 12th grade, no diploma: 396
  • High school graduate (or equivalency): 3,604
  • Less than 1 year of college: 1,624
  • Some college more than 1 year, no degree: 4,105
  • Associate degree: 2,015
  • Bachelor's degree: 8,447
  • Master's degree: 4,201
  • Professional school degree: 2,373
  • Doctorate degree: 1,662
Educational Attainment for Males

Education attainment for females 25 years and older:

  • No schooling: 1,314
  • Nursery to 4th grade: 144
  • 5th and 6th grade: 505
  • 7th and 8th grade: 165
  • 9th grade: 252
  • 10th grade: 87
  • 11th grade: 0
  • 12th grade, no diploma: 648
  • High school graduate (or equivalency): 3,138
  • Less than 1 year of college: 2,133
  • Some college more than 1 year, no degree: 4,609
  • Associate degree: 3,193
  • Bachelor's degree: 9,189
  • Master's degree: 4,915
  • Professional school degree: 1,413
  • Doctorate degree: 969
Educational Attainment for Females
Santa Barbara marital status for males
Santa Barbara marital status for females

Housing units in structures:

  • One, detached: 18,847
  • One, attached: 3,802
  • Two: 2,047
  • 3 or 4: 2,776
  • 5 to 9: 3,629
  • 10 to 19: 2,726
  • 20 to 49: 2,523
  • 50 or more: 2,311
  • Mobile homes: 347
Housing units lacking complete plumbing facilities in 2022: 0.9%

Housing units lacking complete kitchen facilities in 2022: 1.9%

House/condo owner moved in on average 19 years ago

Renter moved in on average 4 years ago

Year householders moved into residence in Santa Barbara
Houses and condos Apartments
Most commonly used house heating fuel in houses and condos in Santa Barbara, CA
  • 82.9%Utility gas
  • 13.2%Electricity
  • 1.7%No fuel used
  • 1.0%Solar energy
  • 0.6%Bottled, tank, or LP gas
  • 0.5%Other fuel
  • 0.2%Wood
Most commonly used house heating fuel in apartments in Santa Barbara, CA
  • 54.3%Utility gas
  • 33.8%Electricity
  • 8.6%No fuel used
  • 2.6%Bottled, tank, or LP gas
  • 0.7%Solar energy

Private vs. public school enrollment:

Students in private schools in grades 1 to 8 (elementary and middle school): 506
Here:

8.5%
California:

10.5%

Students in private schools in grades 9 to 12 (high school): 217
Here:

5.0%
California:

8.5%

Students in private undergraduate colleges: 836
Here:

10.6%
California:

15.9%
School Enrollment by Level of School for Male Students
School Enrollment by Level of School for Female Students
Age and Sex of Sensory-Disabled Noninstitutionalized Residents
Age and Sex of Physically-Disabled Noninstitutionalized Residents
Age and Sex of Mentally-Disabled Noninstitutionalized Residents
Age and Sex of Self-Care Disabled Noninstitutionalized Residents
Age and Sex of Go-Outside-Home Disabled Noninstitutionalized Residents
Age and Sex of Noninstitutionalized Residents with Employment Disability