Santa Clara, CA (California) Houses and Residents
| Santa Clara: | $1,573,700 |
| California: | $715,900 |
Mean price in 2022:
Detached houses: $1,730,005
Here: $1,730,005 State: $988,808 Townhouses or other attached units: $1,461,640
Here: $1,461,640 State: $838,546 In 2-unit structures: $1,374,973
Here: $1,374,973 State: $1,138,100 In 3-to-4-unit structures: $1,196,152
Here: $1,196,152 State: $824,253 In 5-or-more-unit structures: $1,049,188
Here: $1,049,188 State: $730,996
Total population: 122,192 (Urban population: 102,097, Rural population: 7 (all nonfarm))
Houses: 52,146 (49,598 occupied: 20,490 owner occupied, 29,108 renter occupied)
| % of renters here: | 59% |
| State: | 44% |
Housing density: 2,836 houses/condos per square mile
Median price asked for vacant for-sale houses and condos in 2022: $2,313,293.
Median contract rent in 2022: over $2,000 (lower quartile is over $2,000, upper quartile is over $2,000)
Median rent asked for vacant for-rent units in 2022: $2,878
Median gross rent in Santa Clara, CA in 2022: over $2,000
Housing units in Santa Clara with a mortgage: 13,859 (1,689 second mortgage, 57 home equity loan, 1,508 both second mortgage and home equity loan)
Houses without a mortgage: 368
Median household income for houses/condos with a mortgage: $250,001
Median household income for apartments without a mortgage: $127,645
Median monthly housing costs: $2,851
Compare current foreclosures in Santa Clara, CA:
| Photo | Address | Area | Beds / Baths | Price | Details |
|---|---|---|---|---|---|

|
#1
Bowers Ave
Santa Clara, CA 95051
|
1,315 sq. feet
|
2 baths 4 beds |
show details | |

|
#2
Monterey Ave
Santa Clara, CA 95051
|
1,078 sq. feet
|
2 baths 3 beds |
show details | |

|
#3
Bellwood Dr
Santa Clara, CA 95054
|
2,010 sq. feet
|
2 baths 5 beds |
show details | |

|
#4
Calle De Escuela
Santa Clara, CA 95054
|
1,108 sq. feet
|
1 baths 2 beds |
show details | |

|
#5
Leith Ave
Santa Clara, CA 95054
|
1,625 sq. feet
|
2 baths 3 beds |
show details | |

|
#6
Saint Lawrence Dr
Santa Clara, CA 95051
|
1,571 sq. feet
|
2 baths 3 beds |
show details | |

|
#7
Benton St
Santa Clara, CA 95051
|
1,564 sq. feet
|
2 baths 4 beds |
show details | |

|
#8
Flannery St
Santa Clara, CA 95051
|
1,396 sq. feet
|
2 baths 4 beds |
show details | |

|
#9
Cabrillo Ave
Santa Clara, CA 95050
|
1,368 sq. feet
|
2 baths 3 beds |
show details | |

|
#10
Monroe St # 907
Santa Clara, CA 95050
|
853 sq. feet
|
1 baths 2 beds |
show details |
| Photo | Address | Area | Beds / Baths | Price | Details |
|---|---|---|---|---|---|

|
#11
Leith Ave
Santa Clara, CA 95054
|
1,008 sq. feet
|
1 baths 3 beds |
show details | |

|
#12
Bowers Ave
Santa Clara, CA 95051
|
1,158 sq. feet
|
2 baths 4 beds |
show details | |

|
#13
Michele Jean Way
Santa Clara, CA 95050
|
1,872 sq. feet
|
2 baths 2 beds |
show details | |

|
#14
Bellwood Dr
Santa Clara, CA 95054
|
2,010 sq. feet
|
2 baths 5 beds |
show details | |

|
#15
Francis Ave
Santa Clara, CA 95051
|
1,383 sq. feet
|
2 baths 4 beds |
show details | |

|
#16
Pomeroy Ave
Santa Clara, CA 95051
|
1,564 sq. feet
|
2 baths 4 beds |
show details | |

|
#17
Avenida De Las Flores
Santa Clara, CA 95054
|
1,140 sq. feet
|
2 baths 3 beds |
show details | |

|
#18
Fan Palm Ct
Santa Clara, CA 95050
|
1,256 sq. feet
|
1 baths 2 beds |
show details | |

|
#19
Armour Dr
Santa Clara, CA 95054
|
1,095 sq. feet
|
2 baths 3 beds |
show details | |

|
#20
Montgomery Dr # 513
Santa Clara, CA 95054
|
- sq. feet
|
- baths - beds |
show details |
| Photo | Address | Area | Beds / Baths | Price | Details |
|---|---|---|---|---|---|

|
#21
Clair Ct # 8
Santa Clara, CA 95051
|
- sq. feet
|
- baths - beds |
show details | |

|
#22
Rivermark Plz # 424
Santa Clara, CA 95054
|
- sq. feet
|
- baths - beds |
show details | |

|
#23
Homestead Rd Apt 7
Santa Clara, CA 95051
|
- sq. feet
|
- baths - beds |
show details | |

|
#24
Lick Mill Blvd Apt 113
Santa Clara, CA 95054
|
- sq. feet
|
- baths - beds |
show details | |

|
#25
Camino Dr
Santa Clara, CA 95050
|
- sq. feet
|
- baths - beds |
show details | |

|
#26
Halford Ave Apt 33
Santa Clara, CA 95051
|
- sq. feet
|
- baths - beds |
show details | |

|
#27
Aldo Ave Ste 11
Santa Clara, CA 95054
|
- sq. feet
|
- baths - beds |
show details | |

|
#28
Humbolt Avenue
Santa Clara, CA 95051
|
- sq. feet
|
- baths - beds |
show details | |

|
#29
Harrison St
Santa Clara, CA 95050
|
- sq. feet
|
- baths - beds |
show details | |

|
#30
Flora Vista Ave Apt 253
Santa Clara, CA 95051
|
- sq. feet
|
- baths - beds |
show details |
| Photo | Address | Area | Beds / Baths | Price | Details |
|---|---|---|---|---|---|

|
#31
Bowers Ave # 1
Santa Clara, CA 95051
|
- sq. feet
|
- baths - beds |
show details | |

|
#32
Monroe St Apt 1
Santa Clara, CA 95050
|
- sq. feet
|
- baths - beds |
show details | |

|
#33
Buckingham Dr Unit 65
Santa Clara, CA 95051
|
- sq. feet
|
- baths - beds |
show details | |

|
#34
Brookdale Dr Apt 3
Santa Clara, CA 95051
|
- sq. feet
|
- baths - beds |
show details | |

|
#35
N Winchester Blvd Apt 3-3g
Santa Clara, CA 95050
|
- sq. feet
|
- baths - beds |
show details | |

|
#36
Cabrillo Ave Apt 1
Santa Clara, CA 95051
|
- sq. feet
|
- baths - beds |
show details | |

|
#37
Humbolt Ave
Santa Clara, CA 95051
|
- sq. feet
|
- baths - beds |
show details | |

|
#38
Pierce St
Santa Clara, CA 95050
|
- sq. feet
|
- baths - beds |
show details | |

|
#39
El Camino Real # 112
Santa Clara, CA 95051
|
- sq. feet
|
- baths - beds |
show details | |

|
Check over 1 million property listings on Foreclosure.com!
|
browse all offers | |||


Median year apartment built: 1978
Household type by relationship:
Households: 126,920- Male householders: 31,252 (6,191 living alone), Female householders: 18,346 (5,642 living alone)
25,986 spouses (25,846 opposite-sex spouses), 4,127 unmarried partners, (4,087 opposite-sex unmarried partners), 28,362 children (27,876 natural, 135 adopted, 351 stepchildren), 1,171 grandchildren, 1,898 brothers or sisters, 2,891 parents, 111 foster children, 3,644 other relatives, 5,519 non-relatives
- In group quarters: 3,613
Size of family households: 13,307 2-persons, 9,571 3-persons, 6,624 4-persons, 1,757 5-persons, 503 6-persons, 278 7-or-more-persons.
Size of nonfamily households: 11,833 1-person, 5,000 2-persons, 482 3-persons, 198 4-persons, 45 6-persons.
16,572 married couples with children.
3,295 single-parent households (1,138 men, 2,157 women).
43.9% of residents of Santa Clara speak English at home.
8.5% of residents speak Spanish at home (76% speak English very well, 10% speak English well, 13% speak English not well, 2% don't speak English at all).
14.9% of residents speak other Indo-European language at home (82% speak English very well, 14% speak English well, 4% speak English not well).
31.2% of residents speak Asian or Pacific Island language at home (64% speak English very well, 24% speak English well, 10% speak English not well, 2% don't speak English at all).
1.5% of residents speak other language at home (94% speak English very well, 6% speak English well).
Foreign born population: 59,249 (46.7%)
(39.0% of them are naturalized citizens)
| Here: | 5.8 |
| State: | 6.0 |
| Here: | 3.5 |
| State: | 3.9 |

- Bedrooms in owner-occupied houses and condos in Santa Clara, California
- 208no bedroom
- 4331 bedroom
- 3,2572 bedrooms
- 9,7073 bedrooms
- 5,4754 bedrooms
- 1,4105+ bedrooms

- Bedrooms in renter-occupied apartments in Santa Clara, California
- 2,529no bedroom
- 8,8751 bedroom
- 13,7602 bedrooms
- 2,8453 bedrooms
- 9464 bedrooms
- 1535+ bedrooms

- Cars and other vehicles available in Santa Clara in owner-occupied houses/condos
- 1,106no vehicle
- 6,2181 vehicle
- 7,9732 vehicles
- 3,4303 vehicles
- 9274 vehicles
- 8365+ vehicles

- Cars and other vehicles available in Santa Clara in renter-occupied apartments
- 2,531no vehicle
- 13,2201 vehicle
- 10,9492 vehicles
- 1,0613 vehicles
- 6414 vehicles
- 7065+ vehicles

- Rooms in owner-occupied houses in Santa Clara, California
- 2081 room
- 432 rooms
- 8103 rooms
- 2,8834 rooms
- 4,3965 rooms
- 5,6476 rooms
- 3,1427 rooms
- 1,5858 rooms
- 1,7769+ rooms

- Rooms in renter-occupied apartments in Santa Clara, California
- 2,2361 room
- 3,8902 rooms
- 8,6253 rooms
- 8,0674 rooms
- 3,5175 rooms
- 1,2136 rooms
- 1,1547 rooms
- 3008 rooms
- 1069+ rooms


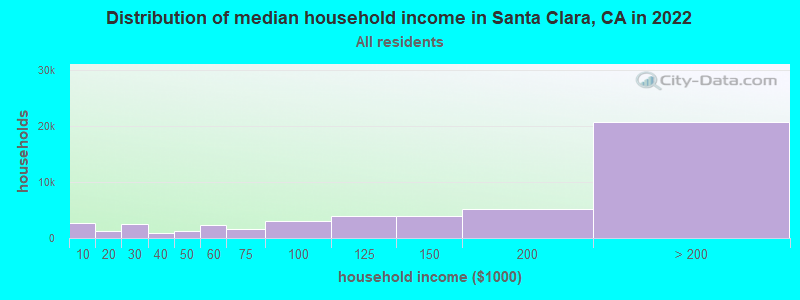
Santa Clara, CA household income distribution

- 2,702Less than $10,000
- 1,323$10,000 to $19,999
- 2,546$20,000 to $29,999
- 935$30,000 to $39,999
- 1,255$40,000 to $49,999
- 2,374$50,000 to $59,999
- 1,535$60,000 to $74,999
- 2,985$75,000 to $99,999
- 3,979$100,000 to $124,999
- 3,950$125,000 to $149,999
- 5,239$150,000 to $199,999
- 20,775$200,000 or more
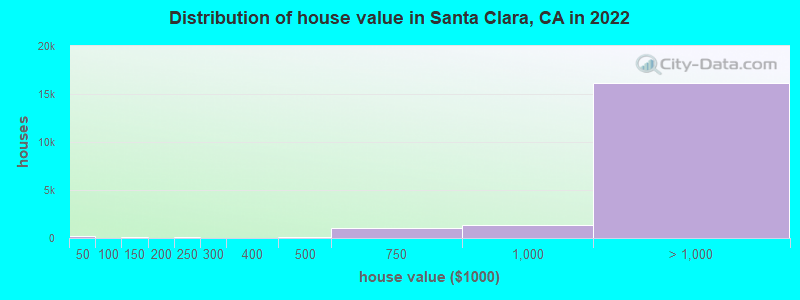
Home value of owner - occupied houses in 2022 in Santa Clara, CA
-
- 134Less than $10,000
- 37$10,000 to $14,999
- 28$15,000 to $19,999
- 42$30,000 to $34,999
- 9$50,000 to $59,999
- 126$100,000 to $124,999
- 24$125,000 to $149,999
- 33$175,000 to $199,999
- 106$200,000 to $249,999
- 5$250,000 to $299,999
- 41$300,000 to $399,999
- 141$400,000 to $499,999
- 1,079$500,000 to $749,999
- 1,356$750,000 to $999,999
- 5,993$1,000,000 to $1,499,999
- 6,367$1,500,000 to $1,999,999
- 3,819$2,000,000 or more
Rent paid by renters in 2022 in Santa Clara, CA
-
- 44Less than $100
- 24$250 to $299
- 85$300 to $349
- 95$350 to $399
- 8$400 to $449
- 7$450 to $499
- 33$550 to $599
- 182$600 to $649
- 53$700 to $749
- 101$750 to $799
- 107$800 to $899
- 270$900 to $999
- 370$1,000 to $1,249
- 1,081$1,250 to $1,499
- 3,500$1,500 to $1,999
- 5,553$2,000 to $2,499
- 6,747$2,500 to $2,999
- 4,775$3,000 to $3,499
- 4,812$3,500 or more
- 382No cash rent

Percentage of workers working in this county: 91.2%
Number of people working at home: 19,734 (28.3% of all workers)
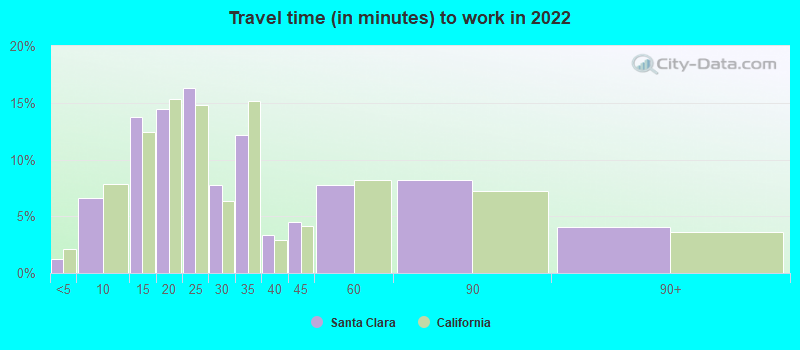
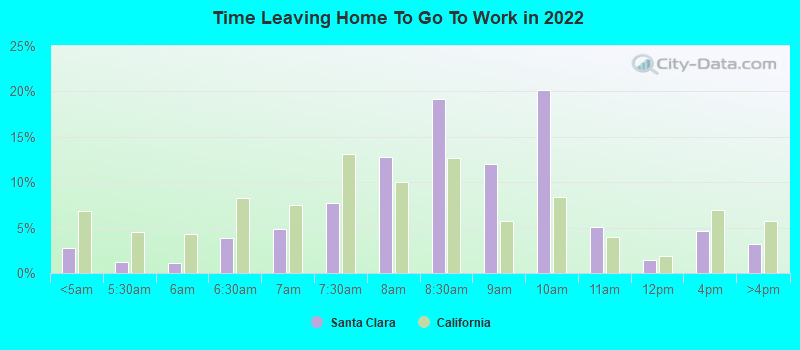
Travel time to work (commute)
- Less than 5 minutes: 573
- 5 to 9 minutes: 4,754
- 10 to 14 minutes: 9,126
- 15 to 19 minutes: 10,680
- 20 to 24 minutes: 9,971
- 25 to 29 minutes: 2,896
- 30 to 34 minutes: 4,923
- 35 to 39 minutes: 1,131
- 40 to 44 minutes: 1,431
- 45 to 59 minutes: 3,186
- 60 to 89 minutes: 1,306
- 90 or more minutes: 129
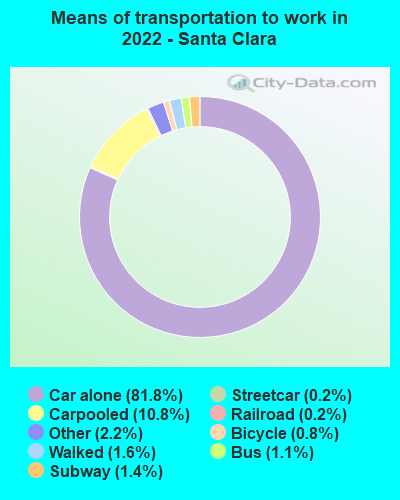
Means of transportation to work:
- Drove a car alone: 61,629 (64.8%)
- Carpooled: 8,106 (8.5%)
- Bus: 819 (0.9%)
- Subway or elevated rail: 116 (0.1%)
- Long-distance train or commuter rail: 1,030 (1.1%)
- Light rail, streetcar or trolley: 186 (0.2%)
- Taxi: 1,660 (1.7%)
- Bicycle: 609 (0.6%)
- Walked: 1,227 (1.3%)
- Worked at home: 19,734 (20.7%)
- Unemployment by race in 2022
- Unemployment rate for White non-Hispanic residents
- 5.1%Males
- 7.9%Females
- Unemployment rate for Black residents
- 13.6%Males
- 8.1%Females
- Unemployment rate for American Indian and Alaska Native residents
- 5.2%Males
- Unemployment rate for Asian residents
- 2.2%Males
- 3.9%Females
- Unemployment rate for other race residents
- 1.5%Males
- 13.8%Females
- Unemployment rate for two or more race residents
- 12.0%Males
- 16.5%Females
- Unemployment rate for Hispanic or Latino residents
- 7.6%Males
- 9.8%Females

- Year of entry for the foreign-born population in Santa Clara, California
- 30,8692010 or later
- 12,1322000 to 2009
- 7,0491990 to 1999
- 8,6111980 to 1989
- 4,0911970 to 1979
- 2,932Before 1970

First ancestries reported:
- Irish: 1,625 (2.0%)
- American: 1,562 (2.0%)
- Portuguese: 1,499 (1.9%)
- English: 1,389 (1.7%)
- German: 1,242 (1.6%)
- Italian: 1,002 (1.3%)
- European: 926 (1.2%)
- Iranian: 917 (1.2%)
- Russian: 628 (0.8%)
- Polish: 543 (0.7%)
- Scottish: 469 (0.6%)
- Dutch: 412 (0.5%)
- Ukrainian: 268 (0.3%)
- Turkish: 268 (0.3%)
- Palestinian: 258 (0.3%)
- French: 246 (0.3%)
- Lebanese: 242 (0.3%)
- Greek: 240 (0.3%)
- Somali: 235 (0.3%)
- Ethiopian: 227 (0.3%)
- Croatian: 225 (0.3%)
- Nigerian: 219 (0.3%)
- Brazilian: 208 (0.3%)
- Norwegian: 205 (0.3%)
- Swedish: 191 (0.2%)
- British: 172 (0.2%)
- Egyptian: 169 (0.2%)
- Canadian: 151 (0.2%)
- Northern European: 136 (0.2%)
- Yugoslavian: 133 (0.2%)
- Syrian: 125 (0.2%)
- African: 117 (0.1%)
- Swiss: 115 (0.1%)
- Hungarian: 108 (0.1%)
- Lithuanian: 106 (0.1%)
- Eastern European: 101 (0.1%)
- Moroccan: 94 (0.1%)
- Kenyan: 83 (0.1%)
- Arab: 79 (0.10%)
- Welsh: 56 (0.07%)
- Slavic: 55 (0.07%)
- Scandinavian: 54 (0.07%)
- French Canadian: 50 (0.06%)
- Israeli: 47 (0.06%)
- Australian: 44 (0.06%)
- Danish: 39 (0.05%)
- Scotch-Irish: 30 (0.04%)
- Austrian: 29 (0.04%)
- Serbian: 28 (0.04%)
- Bulgarian: 27 (0.03%)
- Armenian: 22 (0.03%)
- Romanian: 20 (0.03%)
- Trinidadian and Tobagonian: 20 (0.03%)
- Slovak: 16 (0.02%)
- Afghan: 16 (0.02%)
- Haitian: 16 (0.02%)
- Finnish: 15 (0.02%)
- Jamaican: 12 (0.02%)
- Belgian: 10 (0.01%)
- Assyrian: 9 (0.01%)
- Latvian: 9 (0.01%)
- Czech: 5 (0.01%)
- Jordanian: 5 (0.01%)
Most common places of birth for foreign-born residents (%):
| Santa Clara: | 32.9% (19,049) |
| California: | 5.2% (539,184) |
| Santa Clara: | 15.4% (8,938) |
| California: | 6.6% (684,672) |
| Santa Clara: | 7.4% (4,275) |
| California: | 7.8% (818,297) |
| Santa Clara: | 5.7% (3,315) |
| California: | 37.2% (3,881,193) |
| Santa Clara: | 4.3% (2,485) |
| California: | 4.9% (512,335) |
| Santa Clara: | 4.1% (2,377) |
| California: | 3.0% (315,248) |
| Santa Clara: | 3.6% (2,072) |
| California: | 1.7% (176,274) |
| Santa Clara: | 1.9% (1,096) |
| California: | 2.0% (206,004) |
Place of birth for U.S.-born residents:
- This state: 50,566
- Other state: 15,491
- Northeast: 4,637
- Midwest: 4,090
- South: 3,443
- West: 3,321
76.2% of Santa Clara residents lived in the same house 1 years ago.
Out of people who lived in different houses, 39.3% lived in this county.
Out of people who lived in different counties, 54.2% lived in California.
| Santa Clara: | 76.2% |
| State average: | 88.9% |
Education attainment for males 25 years and older:
- No schooling: 864
- Nursery to 4th grade: 236
- 5th and 6th grade: 254
- 7th and 8th grade: 312
- 9th grade: 230
- 10th grade: 421
- 11th grade: 529
- 12th grade, no diploma: 228
- High school graduate (or equivalency): 4,455
- Less than 1 year of college: 1,417
- Some college more than 1 year, no degree: 3,031
- Associate degree: 2,455
- Bachelor's degree: 14,314
- Master's degree: 14,572
- Professional school degree: 1,561
- Doctorate degree: 3,012

Education attainment for females 25 years and older:
- No schooling: 1,171
- Nursery to 4th grade: 134
- 5th and 6th grade: 591
- 7th and 8th grade: 165
- 9th grade: 155
- 10th grade: 163
- 11th grade: 239
- 12th grade, no diploma: 478
- High school graduate (or equivalency): 5,654
- Less than 1 year of college: 1,328
- Some college more than 1 year, no degree: 3,327
- Associate degree: 4,358
- Bachelor's degree: 12,724
- Master's degree: 12,703
- Professional school degree: 1,083
- Doctorate degree: 1,388


Housing units in structures:
- One, detached: 18,534
- One, attached: 6,328
- Two: 251
- 3 or 4: 3,467
- 5 to 9: 3,550
- 10 to 19: 3,963
- 20 to 49: 4,597
- 50 or more: 11,187
- Mobile homes: 269
Housing units lacking complete kitchen facilities in 2022: 1.0%
House/condo owner moved in on average 15 years ago
Renter moved in on average 0 years ago

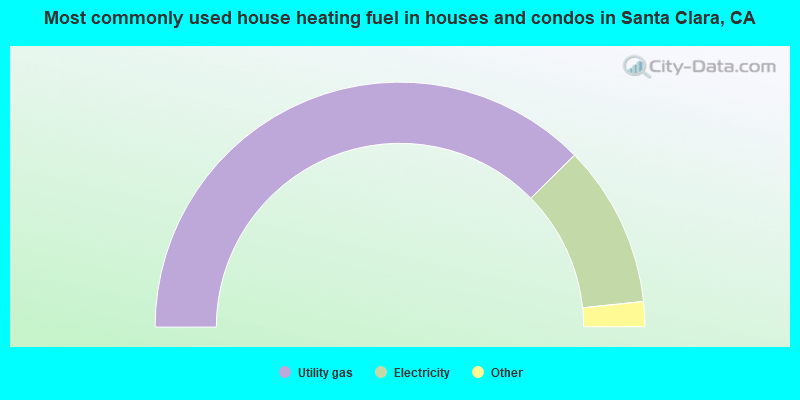
- 75.2%Utility gas
- 21.4%Electricity
- 2.2%Bottled, tank, or LP gas
- 0.8%No fuel used
- 0.2%Solar energy
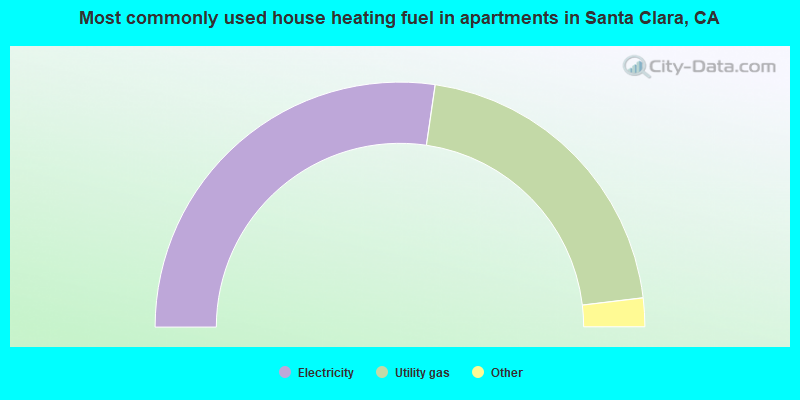
- 54.6%Electricity
- 41.6%Utility gas
- 2.3%No fuel used
- 1.5%Bottled, tank, or LP gas
Private vs. public school enrollment:
| Here: | 14.6% |
| California: | 10.5% |
| Here: | 18.3% |
| California: | 8.5% |
| Here: | 37.5% |
| California: | 15.9% |


