Santa Clara, TX (Texas) Houses and Residents
| Santa Clara: | $320,411 |
| Texas: | $275,400 |
Mean price in 2022:
Detached houses: $377,411
Here: $377,411 State: $369,058 Mobile homes: $166,400
Here: $166,400 State: $124,413
Total population: 722 (Urban population: 0, Rural population: 1,057 (61 farm, 996 nonfarm))
Houses: 289 (277 occupied: 263 owner occupied, 23 renter occupied)
| % of renters here: | 8% |
| State: | 38% |
Housing density: 139 houses/condos per square mile
Median price asked for vacant for-sale houses and condos in 2022 in this county: $266,650.
Median contract rent in 2022: $1,056 (lower quartile is $864, upper quartile is $1,004)
Median gross rent in Santa Clara, TX in 2022: $1,177
Housing units in Santa Clara with a mortgage: 155 (1 second mortgage, 0 home equity loan, 2 both second mortgage and home equity loan)
Houses without a mortgage: 0
Median household income for houses/condos with a mortgage: $80,688
Median household income for apartments without a mortgage: $83,460
Median monthly housing costs: $1,205
Compare current foreclosures near Santa Clara, TX:
| Photo | Address | Area | Beds / Baths | Price | Details |
|---|---|---|---|---|---|

|
#1
Morningside Pl
Schertz, TX 78154
|
2,109 sq. feet
|
2 baths 3 beds |
$369,900
|
show details |

|
#2
Sunrise Pass
San Antonio, TX 78244
|
912 sq. feet
|
1 baths 3 beds |
$32,500
|
show details |

|
#3
Tractor Pass
Schertz, TX 78154
|
1,873 sq. feet
|
2 baths 3 beds |
$315,000
|
show details |

|
#4
Wind Crown
San Antonio, TX 78239
|
- sq. feet
|
2 baths 3 beds |
$285,000
|
show details |

|
#5
Ayers Dr
Seguin, TX 78155
|
- sq. feet
|
2 baths 4 beds |
show details | |

|
#6
Richland Pl
San Antonio, TX 78244
|
1,955 sq. feet
|
2 baths 3 beds |
show details | |

|
#7
Wetmore Knl
San Antonio, TX 78247
|
1,441 sq. feet
|
2 baths 3 beds |
show details | |

|
#8
Lyro Fields
Converse, TX 78109
|
2,451 sq. feet
|
2 baths 3 beds |
show details | |

|
#9
Interstate 35
San Antonio, TX 78208
|
- sq. feet
|
2 baths 2 beds |
show details | |

|
#10
Catalina Sunrise Dr
San Antonio, TX 78244
|
1,484 sq. feet
|
2 baths 4 beds |
show details |
| Photo | Address | Area | Beds / Baths | Price | Details |
|---|---|---|---|---|---|

|
#11
Bloomdale
San Antonio, TX 78218
|
1,720 sq. feet
|
2 baths 4 beds |
show details | |

|
#12
Archer Blvd
New Braunfels, TX 78132
|
2,224 sq. feet
|
2 baths 4 beds |
show details | |

|
#13
Little Brandywine Crk
San Antonio, TX 78233
|
1,444 sq. feet
|
2 baths 4 beds |
show details | |

|
#14
Pebble Walk
San Antonio, TX 78217
|
1,973 sq. feet
|
2 baths 3 beds |
show details | |

|
#15
Highland Grass
Converse, TX 78109
|
2,278 sq. feet
|
2 baths 4 beds |
show details | |

|
#16
Heidi St
San Antonio, TX 78247
|
1,480 sq. feet
|
2 baths 3 beds |
show details | |

|
#17
Wood Sorrel
San Antonio, TX 78247
|
2,334 sq. feet
|
2 baths 4 beds |
show details | |

|
#18
Legend Point Dr
San Antonio, TX 78244
|
4,170 sq. feet
|
3 baths 5 beds |
show details | |

|
#19
Tallulah Dr
San Antonio, TX 78218
|
1,436 sq. feet
|
2 baths 3 beds |
show details | |

|
#20
Forest Xing
San Antonio, TX 78233
|
1,356 sq. feet
|
2 baths 3 beds |
show details |
| Photo | Address | Area | Beds / Baths | Price | Details |
|---|---|---|---|---|---|

|
#21
Hialeah Ave
San Antonio, TX 78218
|
1,550 sq. feet
|
2 baths 3 beds |
show details | |

|
#22
Diamondback Trl
New Braunfels, TX 78130
|
1,334 sq. feet
|
2 baths 3 beds |
show details | |

|
#23
Watering Point Dr
San Antonio, TX 78247
|
1,551 sq. feet
|
2 baths 3 beds |
show details | |

|
#24
Eagle Valley St
Cibolo, TX 78108
|
- sq. feet
|
3 baths 4 beds |
show details | |

|
#25
Nell Deane Blvd
Schertz, TX 78154
|
1,156 sq. feet
|
2 baths 3 beds |
show details | |

|
#26
Kody Creek
San Antonio, TX 78263
|
3,344 sq. feet
|
4 baths 4 beds |
show details | |

|
#27
Indigo Crk
San Antonio, TX 78239
|
2,651 sq. feet
|
3 baths 4 beds |
show details | |

|
#28
Pumpkin Ridge
New Braunfels, TX 78130
|
2,212 sq. feet
|
2 baths 4 beds |
show details | |

|
#29
Stormy Autumn
San Antonio, TX 78247
|
2,231 sq. feet
|
3 baths 3 beds |
show details | |

|
#30
Briarbend St
San Antonio, TX 78247
|
1,335 sq. feet
|
2 baths 3 beds |
show details |
| Photo | Address | Area | Beds / Baths | Price | Details |
|---|---|---|---|---|---|

|
#31
Eclipse St
San Antonio, TX 78219
|
1,568 sq. feet
|
2 baths 3 beds |
show details | |

|
#32
Shady Lake Dr
San Antonio, TX 78244
|
1,309 sq. feet
|
2 baths 3 beds |
show details | |

|
#33
Lori Lynn Dr
Schertz, TX 78154
|
1,121 sq. feet
|
2 baths 3 beds |
show details | |

|
#34
Antrim Dr
San Antonio, TX 78218
|
1,509 sq. feet
|
1 baths 3 beds |
show details | |

|
#35
Charleston Ln
Cibolo, TX 78108
|
1,988 sq. feet
|
2 baths 3 beds |
show details | |

|
#36
Misty Mdw
Converse, TX 78109
|
1,064 sq. feet
|
1 baths 3 beds |
show details | |

|
#37
Lone Oak St
Seguin, TX 78155
|
1,994 sq. feet
|
2 baths 3 beds |
show details | |

|
#38
Nubuck Br
Converse, TX 78109
|
1,845 sq. feet
|
2 baths 4 beds |
show details | |

|
#39
Village Grn
San Antonio, TX 78218
|
912 sq. feet
|
1 baths 2 beds |
show details | |

|
#40
Jackson Smt
Converse, TX 78109
|
1,428 sq. feet
|
2 baths 3 beds |
show details |
| Photo | Address | Area | Beds / Baths | Price | Details |
|---|---|---|---|---|---|

|
#41
Orchard Acres
San Antonio, TX 78261
|
2,102 sq. feet
|
2 baths 3 beds |
show details | |

|
#42
Ceremony Cv
San Antonio, TX 78239
|
2,085 sq. feet
|
2 baths 4 beds |
show details | |

|
#43
E Queens Crown St
San Antonio, TX 78233
|
- sq. feet
|
2 baths 3 beds |
show details | |

|
#44
Spearwood
San Antonio, TX 78233
|
1,975 sq. feet
|
2 baths 3 beds |
show details | |

|
#45
Fern Hl
San Antonio, TX 78259
|
3,635 sq. feet
|
2 baths 3 beds |
show details | |

|
#46
Tallulah Dr
San Antonio, TX 78218
|
1,475 sq. feet
|
1 baths 3 beds |
show details | |

|
#47
Misty Ridge Dr
Converse, TX 78109
|
2,353 sq. feet
|
2 baths 4 beds |
show details | |

|
#48
Seldon Trl
San Antonio, TX 78244
|
2,603 sq. feet
|
2 baths 4 beds |
show details | |

|
#49
Longing Trl
San Antonio, TX 78244
|
2,850 sq. feet
|
2 baths 4 beds |
show details | |

|
Check over 1 million property listings on Foreclosure.com!
|
browse all offers | |||


 | How do people afford $800k - $1.2 million homes? (241 replies) |
| Property Tax Question 2022 (108 replies) |
| Houston's economic diversity Thread .. (1246 replies) |
| Coronavirus in DFW - News & Discussion (3109 replies) |
| Oracle moving HQ to Austin (38 replies) |
| Toyota Employees- How is Texas? (171 replies) |

Median year apartment built: 2007
Household type by relationship:
Households: 749- Male householders: 148 (43 living alone), Female householders: 125 (19 living alone)
191 spouses (191 opposite-sex spouses), 12 unmarried partners, (12 opposite-sex unmarried partners), 147 children (147 natural, 0 adopted, 0 stepchildren), 29 grandchildren, 21 brothers or sisters, 11 parents, 0 foster children, 42 other relatives, 21 non-relatives
Size of family households: 109 2-persons, 36 3-persons, 39 4-persons, 27 5-persons, 1 7-or-more-persons.
Size of nonfamily households: 68 1-person, 3 2-persons.
66 married couples with children.
5 single-parent households (3 men, 2 women).
85.9% of residents of Santa Clara speak English at home.
12.8% of residents speak Spanish at home (90% speak English very well, 8% speak English well, 2% speak English not well).
1.4% of residents speak other Indo-European language at home (70% speak English very well, 30% speak English not well).
Foreign born population: 49 (6.5%)
(49.0% of them are naturalized citizens)
| Here: | 5.9 |
| State: | 6.3 |
| Here: | 2.7 |
| State: | 4.0 |

- Bedrooms in owner-occupied houses and condos in Santa Clara, Texas
- 0no bedroom
- 31 bedroom
- 232 bedrooms
- 1743 bedrooms
- 554 bedrooms
- 85+ bedrooms

- Bedrooms in renter-occupied apartments in Santa Clara, Texas
- 0no bedroom
- 111 bedroom
- 72 bedrooms
- 33 bedrooms
- 24 bedrooms
- 05+ bedrooms

- Cars and other vehicles available in Santa Clara in owner-occupied houses/condos
- 17no vehicle
- 551 vehicle
- 1002 vehicles
- 663 vehicles
- 244 vehicles
- 15+ vehicles

- Cars and other vehicles available in Santa Clara in renter-occupied apartments
- 14no vehicle
- 61 vehicle
- 32 vehicles
- 03 vehicles
- 04 vehicles
- 05+ vehicles

- Rooms in owner-occupied houses in Santa Clara, Texas
- 01 room
- 02 rooms
- 63 rooms
- 174 rooms
- 685 rooms
- 866 rooms
- 317 rooms
- 218 rooms
- 359+ rooms

- Rooms in renter-occupied apartments in Santa Clara, Texas
- 01 room
- 102 rooms
- 73 rooms
- 14 rooms
- 05 rooms
- 36 rooms
- 27 rooms
- 08 rooms
- 09+ rooms


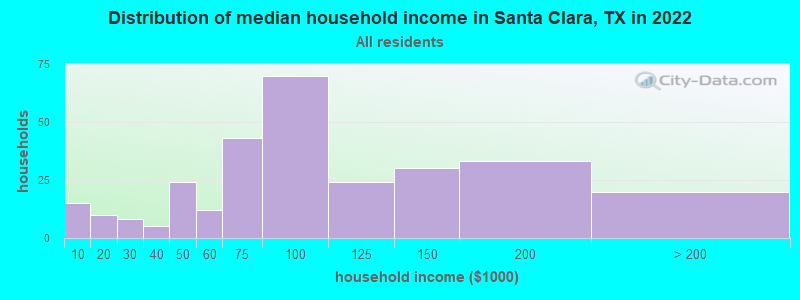
Santa Clara, TX household income distribution

- 15Less than $10,000
- 10$10,000 to $19,999
- 8$20,000 to $29,999
- 5$30,000 to $39,999
- 24$40,000 to $49,999
- 12$50,000 to $59,999
- 43$60,000 to $74,999
- 70$75,000 to $99,999
- 24$100,000 to $124,999
- 30$125,000 to $149,999
- 33$150,000 to $199,999
- 20$200,000 or more
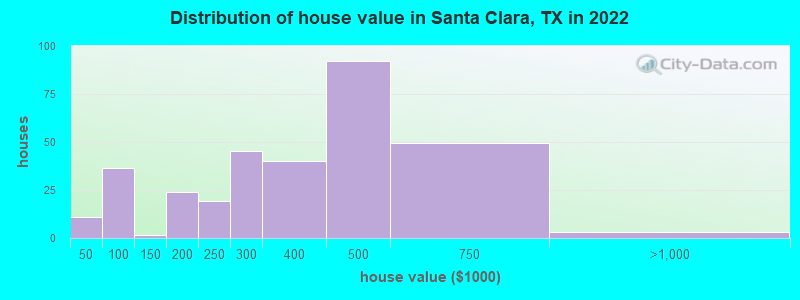
Home value of owner - occupied houses in 2022 in Santa Clara, TX
-
- 3Less than $10,000
- 3$10,000 to $14,999
- 3$20,000 to $24,999
- 25$50,000 to $59,999
- 5$70,000 to $79,999
- 5$80,000 to $89,999
- 1$100,000 to $124,999
- 16$150,000 to $174,999
- 7$175,000 to $199,999
- 19$200,000 to $249,999
- 45$250,000 to $299,999
- 40$300,000 to $399,999
- 92$400,000 to $499,999
- 49$500,000 to $749,999
- 3$750,000 to $999,999
Rent paid by renters in 2022 in Santa Clara, TX
-
- 0$350 to $399
- 7$750 to $799
- 6$800 to $899
- 3$1,000 to $1,249
- 4No cash rent


Percentage of workers working in this county: 47.1%
Number of people working at home: 83 (22.3% of all workers)
Travel time to work (commute)
- Less than 5 minutes: 0
- 5 to 9 minutes: 12
- 10 to 14 minutes: 16
- 15 to 19 minutes: 24
- 20 to 24 minutes: 64
- 25 to 29 minutes: 4
- 30 to 34 minutes: 67
- 35 to 39 minutes: 3
- 40 to 44 minutes: 14
- 45 to 59 minutes: 50
- 60 to 89 minutes: 30
- 90 or more minutes: 3
Means of transportation to work:
- Drove a car alone: 452 (84.8%)
- Carpooled: 49 (9.2%)
- Walked: 4 (0.8%)
- Worked at home: 28 (5.3%)

- Unemployment by race in 2022
- Unemployment rate for White non-Hispanic residents
- 7.2%Males

- Year of entry for the foreign-born population in Santa Clara, Texas
- 172010 or later
- 102000 to 2009
- 101990 to 1999
- 01980 to 1989
- 351970 to 1979
- 29Before 1970

First ancestries reported:
- German: 109 (27.3%)
- American: 53 (13.3%)
- English: 35 (8.8%)
- Irish: 12 (3.0%)
- Welsh: 9 (2.3%)
- French: 8 (2.0%)
- Scottish: 8 (2.0%)
- Canadian: 5 (1.3%)
- Polish: 4 (1.0%)
- European: 3 (0.8%)
- Russian: 2 (0.5%)
- Scotch-Irish: 2 (0.5%)
Most common places of birth for foreign-born residents (%):
| Santa Clara: | 37.8% (17) |
| Texas: | 1.2% (61,555) |
| Santa Clara: | 28.9% (13) |
| Texas: | 48.4% (2,411,723) |
| Santa Clara: | 13.3% (6) |
| Texas: | 1.1% (55,371) |
| Santa Clara: | 11.1% (5) |
| Texas: | 0.0% (1,305) |
| Santa Clara: | 6.7% (3) |
| Texas: | 0.8% (37,989) |
Place of birth for U.S.-born residents:
- This state: 501
- Other state: 165
- Northeast: 55
- Midwest: 36
- South: 43
- West: 34
85.8% of Santa Clara residents lived in the same house 1 years ago.
Out of people who lived in different houses, 12.8% lived in this county.
Out of people who lived in different counties, 89.5% lived in Texas.
| Santa Clara: | 85.8% |
| State average: | 85.7% |
Education attainment for males 25 years and older:
- No schooling: 6
- Nursery to 4th grade: 0
- 5th and 6th grade: 0
- 7th and 8th grade: 1
- 9th grade: 1
- 10th grade: 3
- 11th grade: 4
- 12th grade, no diploma: 9
- High school graduate (or equivalency): 98
- Less than 1 year of college: 28
- Some college more than 1 year, no degree: 31
- Associate degree: 27
- Bachelor's degree: 64
- Master's degree: 0
- Professional school degree: 4
- Doctorate degree: 3

Education attainment for females 25 years and older:
- No schooling: 5
- Nursery to 4th grade: 0
- 5th and 6th grade: 2
- 7th and 8th grade: 8
- 9th grade: 0
- 10th grade: 2
- 11th grade: 1
- 12th grade, no diploma: 0
- High school graduate (or equivalency): 90
- Less than 1 year of college: 34
- Some college more than 1 year, no degree: 37
- Associate degree: 26
- Bachelor's degree: 61
- Master's degree: 8
- Professional school degree: 2
- Doctorate degree: 1


Housing units in structures:
- One, detached: 204
- One, attached: 2
- Two: 5
- Mobile homes: 75
- Boats, RVs, vans, etc.: 2
House/condo owner moved in on average 14 years ago
Renter moved in on average 7 years ago

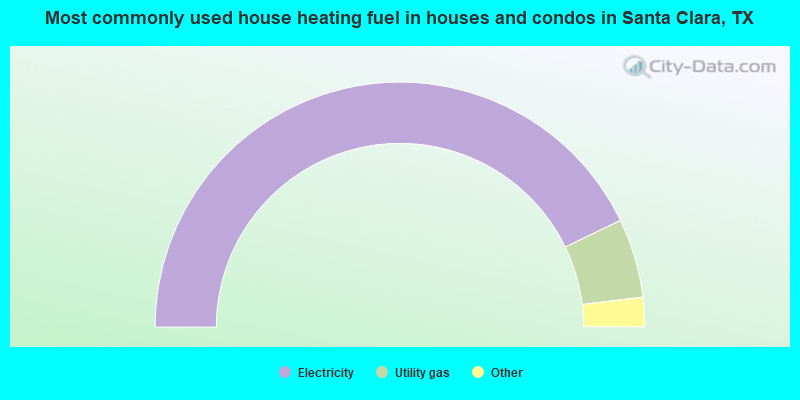
- 86.2%Electricity
- 10.5%Utility gas
- 2.1%Bottled, tank, or LP gas
- 1.3%Wood
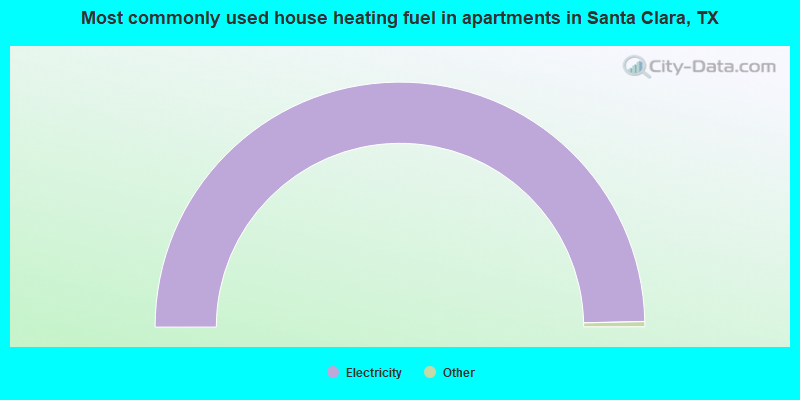
- 100.0%Electricity
Private vs. public school enrollment:
| Here: | 37.5% |
| Texas: | 8.8% |
| Here: | 6.2% |
| Texas: | 8.0% |
| Here: | 3.8% |
| Texas: | 16.2% |


