Housing density: 1,582 houses/condos per square mile
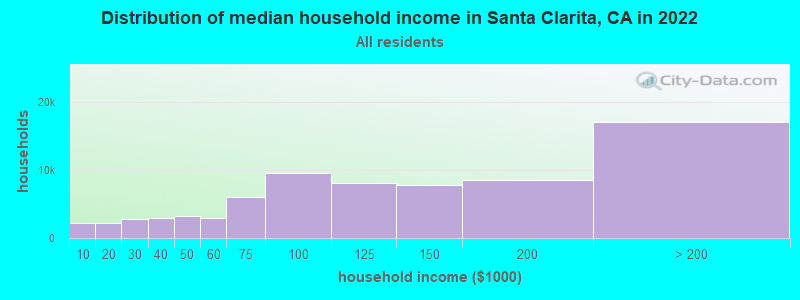
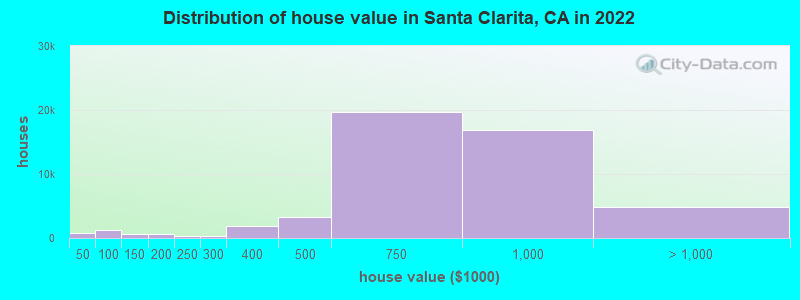
Median price asked for vacant for-sale houses and condos in 2022: $927,525.
Median contract rent in 2022: over $2,000 (lower quartile is $1,639, upper quartile is over $2,000)
Median rent asked for vacant for-rent units in 2022: $2,374
Median gross rent in Santa Clarita, CA in 2022: over $2,000
Housing units in Santa Clarita with a mortgage: 39,224 (3,573 second mortgage, 187 home equity loan, 2,746 both second mortgage and home equity loan) Houses without a mortgage: 286
Median household income for houses/condos with a mortgage: $139,022
Median household income for apartments without a mortgage: $83,345
Median monthly housing costs: $2,452
Compare current foreclosures in Santa Clarita, CA:
35,297 married couples with children.
11,826 single-parent households (4,505 men, 7,321 women).
64.3% of residents of Santa Clarita speak English at home.
22.3% of residents speak Spanish at home (67% speak English very well, 19% speak English well, 10% speak English not well, 4% don't speak English at all).
5.4% of residents speak other Indo-European language at home (77% speak English very well, 15% speak English well, 7% speak English not well, 1% don't speak English at all).
6.5% of residents speak Asian or Pacific Island language at home (66% speak English very well, 24% speak English well, 10% speak English not well).
1.4% of residents speak other language at home (79% speak English very well, 18% speak English well, 4% speak English not well).
Foreign born population: 45,805 (20.7%)
(66.6% of them are naturalized citizens)
Percentage of workers working in this county: 96.1% Number of people working at home: 19,274 (17.2% of all workers)
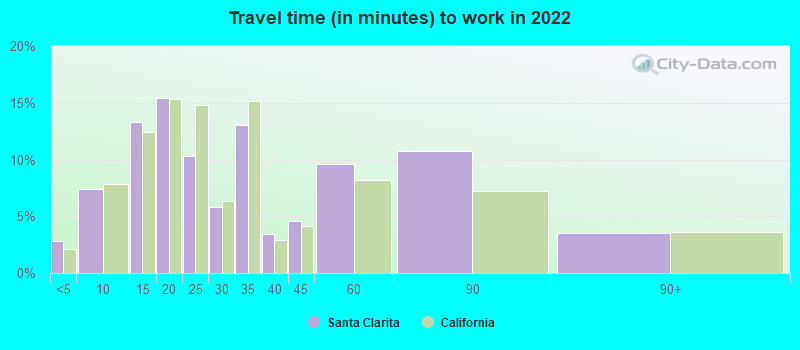
Travel time to work (commute)
Less than 5 minutes: 1,973
5 to 9 minutes: 6,189
10 to 14 minutes: 10,533
15 to 19 minutes: 12,615
20 to 24 minutes: 10,060
25 to 29 minutes: 4,926
30 to 34 minutes: 11,149
35 to 39 minutes: 4,157
40 to 44 minutes: 4,536
45 to 59 minutes: 12,364
60 to 89 minutes: 9,499
90 or more minutes: 4,464
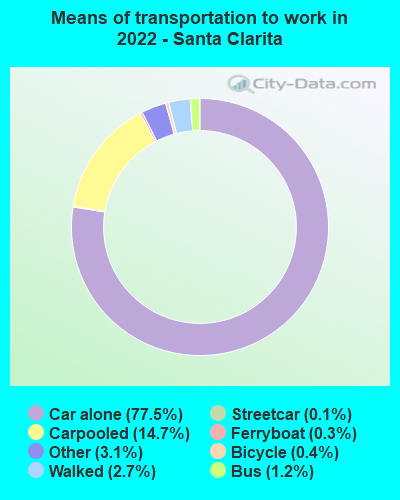
Means of transportation to work:
Drove a car alone: 53,407 (60.6%)
Carpooled: 10,095 (11.5%)
Bus: 807 (0.9%)
Subway or elevated rail: 79 (0.1%)
Ferryboat: 230 (0.3%)
Taxi: 2,133 (2.4%)
Bicycle: 294 (0.3%)
Walked: 1,839 (2.1%)
Worked at home: 19,274 (21.9%)
Unemployment by race in 2022
Unemployment rate for White non-Hispanic residents
5.5%Males
3.9%Females
Unemployment rate for Black residents
4.2%Males
3.4%Females
Unemployment rate for American Indian and Alaska Native residents
1.5%Males
0.8%Females
Unemployment rate for Asian residents
3.7%Males
4.2%Females
Unemployment rate for other race residents
7.8%Males
4.7%Females
Unemployment rate for two or more race residents
3.3%Males
3.9%Females
Unemployment rate for Hispanic or Latino residents
4.6%Males
4.9%Females
Year of entry for the foreign-born population in Santa Clarita, California
8,8132010 or later
8,1122000 to 2009
9,9351990 to 1999
6,9421980 to 1989
4,6811970 to 1979
3,966Before 1970
First ancestries reported:
English: 5,672 (4.8%)
American: 4,755 (4.0%)
German: 4,578 (3.9%)
Italian: 3,886 (3.3%)
Irish: 3,526 (3.0%)
European: 2,305 (1.9%)
Armenian: 2,052 (1.7%)
Iranian: 880 (0.7%)
Polish: 695 (0.6%)
Scottish: 673 (0.6%)
Syrian: 600 (0.5%)
Norwegian: 583 (0.5%)
Russian: 580 (0.5%)
Egyptian: 567 (0.5%)
Brazilian: 523 (0.4%)
African: 488 (0.4%)
French: 445 (0.4%)
Eastern European: 430 (0.4%)
Swedish: 411 (0.3%)
Hungarian: 378 (0.3%)
Assyrian: 351 (0.3%)
Scotch-Irish: 338 (0.3%)
Lebanese: 299 (0.3%)
British: 286 (0.2%)
Greek: 271 (0.2%)
Dutch: 269 (0.2%)
Arab: 261 (0.2%)
Turkish: 213 (0.2%)
French Canadian: 211 (0.2%)
Slavic: 198 (0.2%)
Portuguese: 197 (0.2%)
Welsh: 186 (0.2%)
Ukrainian: 176 (0.1%)
West Indian: 176 (0.1%)
Czech: 175 (0.1%)
Danish: 174 (0.1%)
Canadian: 131 (0.1%)
Swiss: 130 (0.1%)
Jamaican: 125 (0.1%)
Afghan: 123 (0.1%)
Croatian: 122 (0.1%)
Romanian: 120 (0.1%)
Jordanian: 106 (0.09%)
Nigerian: 91 (0.08%)
Scandinavian: 89 (0.08%)
Northern European: 84 (0.07%)
Lithuanian: 80 (0.07%)
Belgian: 78 (0.07%)
Austrian: 73 (0.06%)
Iraqi: 70 (0.06%)
Slovene: 68 (0.06%)
Kenyan: 62 (0.05%)
Palestinian: 55 (0.05%)
Zimbabwean: 53 (0.04%)
Belizean: 51 (0.04%)
Finnish: 50 (0.04%)
Bulgarian: 46 (0.04%)
Israeli: 45 (0.04%)
Haitian: 39 (0.03%)
Slovak: 38 (0.03%)
Moroccan: 36 (0.03%)
Ugandan: 32 (0.03%)
Australian: 29 (0.02%)
South African: 22 (0.02%)
Czechoslovakian: 21 (0.02%)
Cajun: 20 (0.02%)
Serbian: 19 (0.02%)
Icelander: 12 (0.01%)
Yugoslavian: 11 (0.01%)
Luxembourger: 7 (0.01%)
Basque: 6 (0.01%)
Barbadian: 6 (0.01%)
Most common places of birth for foreign-born residents (%):
Mexico
Santa Clarita:
28.5% (13,252)
California:
37.2% (3,881,193)
Philippines
Santa Clarita:
13.8% (6,399)
California:
7.8% (818,297)
Guatemala
Santa Clarita:
5.9% (2,722)
California:
2.8% (290,436)
India
Santa Clarita:
5.4% (2,533)
California:
5.2% (539,184)
El Salvador
Santa Clarita:
4.3% (2,008)
California:
4.2% (440,287)
Korea
Santa Clarita:
4.2% (1,948)
California:
3.0% (315,248)
Iran
Santa Clarita:
2.7% (1,259)
California:
2.0% (206,004)
China, excluding Hong Kong and Taiwan
Santa Clarita:
1.7% (769)
California:
6.6% (684,672)
Egypt
Santa Clarita:
1.7% (769)
California:
0.4% (42,718)
Place of birth for U.S.-born residents:
This state: 138,960
Other state: 33,681
Northeast: 8,914
Midwest: 11,182
South: 7,726
West: 5,859
89.0% of Santa Clarita residents lived in the same house 1 years ago. Out of people who lived in different houses, 44.2% lived in this county. Out of people who lived in different counties, 54.9% lived in California.
Santa Clarita:
89.0%
State average:
88.9%
Education attainment for males 25 years and older:
No schooling: 2,266
Nursery to 4th grade: 407
5th and 6th grade: 612
7th and 8th grade: 570
9th grade: 527
10th grade: 127
11th grade: 429
12th grade, no diploma: 1,813
High school graduate (or equivalency): 14,636
Less than 1 year of college: 4,665
Some college more than 1 year, no degree: 12,401
Associate degree: 6,854
Bachelor's degree: 18,366
Master's degree: 6,549
Professional school degree: 1,546
Doctorate degree: 1,069
Education attainment for females 25 years and older:
No schooling: 2,153
Nursery to 4th grade: 514
5th and 6th grade: 1,455
7th and 8th grade: 406
9th grade: 129
10th grade: 401
11th grade: 440
12th grade, no diploma: 1,360
High school graduate (or equivalency): 13,896
Less than 1 year of college: 5,615
Some college more than 1 year, no degree: 11,972
Associate degree: 7,045
Bachelor's degree: 20,923
Master's degree: 8,366
Professional school degree: 1,000
Doctorate degree: 1,163
Housing units in structures:
One, detached: 46,981
One, attached: 8,689
Two: 856
3 or 4: 2,420
5 to 9: 4,456
10 to 19: 3,099
20 to 49: 2,068
50 or more: 3,479
Mobile homes: 3,552
Boats, RVs, vans, etc.: 66
Median worth of mobile homes: $158,200
Housing units lacking complete plumbing facilities in 2022: 1.0%
Housing units lacking complete kitchen facilities in 2022: 1.5%
House/condo owner moved in on average 10 years ago