Housing density: 409 houses/condos per square mile
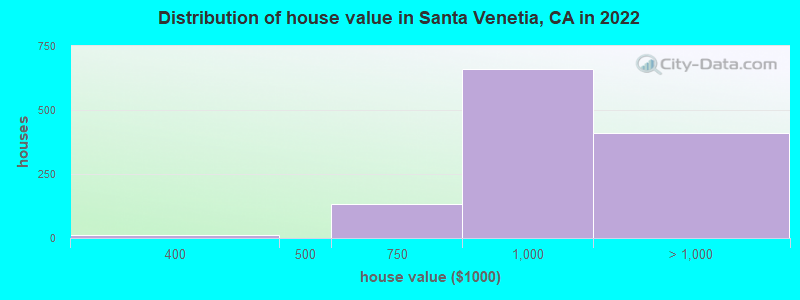
Median price asked for vacant for-sale houses and condos in 2022 in this county: $3,364,178.
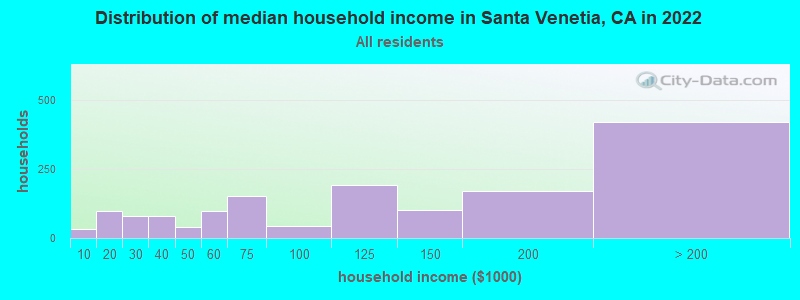
Median contract rent in 2022: over $2,000 (lower quartile is $546, upper quartile is over $2,000)
Median rent asked for vacant for-rent units in 2022: $3,507
Median gross rent in Santa Venetia, CA in 2022: over $2,000
Housing units in Santa Venetia with a mortgage: 877 (262 second mortgage, 0 home equity loan, 256 both second mortgage and home equity loan) Houses without a mortgage: 0
Median household income for houses/condos with a mortgage: $178,672
Median monthly housing costs: $2,737
Compare current foreclosures near Santa Venetia, CA:
Size of family households: 368 2-persons, 272 3-persons, 43 4-persons, 98 5-persons, 15 7-or-more-persons.
Size of nonfamily households: 619 1-person, 78 2-persons, 20 4-persons.
556 married couples with children.
0 single-parent households (0 men, 0 women).
90.5% of residents of Santa Venetia speak English at home.
1.4% of residents speak Spanish at home (52% speak English very well, 23% speak English not well, 25% don't speak English at all).
5.7% of residents speak other Indo-European language at home (51% speak English very well, 28% speak English well, 12% speak English not well, 9% don't speak English at all).
0.3% of residents speak Asian or Pacific Island language at home (100% speak English well).
2.5% of residents speak other language at home (62% speak English very well, 38% speak English well).
Foreign born population: 464 (12.5%)
(93.5% of them are naturalized citizens)
Percentage of workers working in this county: 84.8% Number of people working at home: 553 (32.5% of all workers)
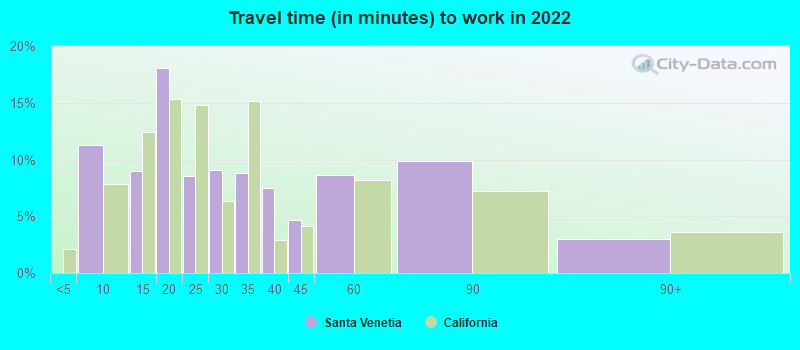
Travel time to work (commute)
Less than 5 minutes: 46
5 to 9 minutes: 17
10 to 14 minutes: 326
15 to 19 minutes: 167
20 to 24 minutes: 79
25 to 29 minutes: 80
30 to 34 minutes: 140
35 to 39 minutes: 15
40 to 44 minutes: 120
45 to 59 minutes: 82
60 to 89 minutes: 61
90 or more minutes: 31
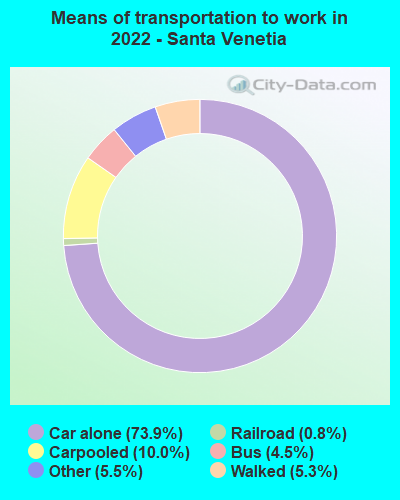
Means of transportation to work:
Drove a car alone: 480 (40.7%)
Carpooled: 61 (5.2%)
Bus: 39 (3.3%)
Light rail, streetcar or trolley: 6 (0.5%)
Taxi: 62 (5.3%)
Walked: 44 (3.7%)
Worked at home: 553 (46.9%)
Unemployment by race in 2022
Unemployment rate for White non-Hispanic residents
2.2%Males
2.8%Females
Unemployment rate for two or more race residents
69.0%Males
Unemployment rate for Hispanic or Latino residents
74.8%Males
Year of entry for the foreign-born population in Santa Venetia, California
362010 or later
402000 to 2009
911990 to 1999
1851980 to 1989
1051970 to 1979
134Before 1970
First ancestries reported:
Irish: 352 (20.5%)
Kenyan: 228 (13.3%)
English: 119 (6.9%)
Italian: 118 (6.9%)
European: 93 (5.4%)
Greek: 75 (4.4%)
Russian: 75 (4.4%)
Northern European: 61 (3.6%)
American: 46 (2.7%)
British: 22 (1.3%)
Armenian: 21 (1.2%)
Assyrian: 19 (1.1%)
Dutch: 11 (0.6%)
Eastern European: 7 (0.4%)
Most common places of birth for foreign-born residents (%):
Kenya
Santa Venetia:
18.4% (86)
California:
0.1% (12,503)
Italy
Santa Venetia:
17.1% (80)
California:
0.3% (31,439)
Venezuela
Santa Venetia:
13.9% (65)
California:
0.2% (16,998)
India
Santa Venetia:
10.7% (50)
California:
5.2% (539,184)
Philippines
Santa Venetia:
8.3% (39)
California:
7.8% (818,297)
Mexico
Santa Venetia:
6.4% (30)
California:
37.2% (3,881,193)
Fiji
Santa Venetia:
5.8% (27)
California:
0.3% (33,937)
Ukraine
Santa Venetia:
4.9% (23)
California:
0.6% (60,761)
England
Santa Venetia:
4.9% (23)
California:
0.6% (57,953)
Russia
Santa Venetia:
3.8% (18)
California:
0.7% (71,932)
Israel
Santa Venetia:
3.4% (16)
California:
0.3% (33,029)
Peru
Santa Venetia:
3.0% (14)
California:
0.7% (74,025)
Scotland
Santa Venetia:
2.1% (10)
California:
0.1% (8,444)
Oceania, n.e.c.
Santa Venetia:
1.7% (8)
California:
0.2% (18,925)
Place of birth for U.S.-born residents:
This state: 2,229
Other state: 997
Northeast: 406
Midwest: 257
South: 111
West: 224
95.2% of Santa Venetia residents lived in the same house 1 years ago. Out of people who lived in different houses, 34.1% lived in this county. Out of people who lived in different counties, 100.0% lived in California.
Santa Venetia:
95.2%
State average:
88.9%
Education attainment for males 25 years and older:
No schooling: 24
Nursery to 4th grade: 15
5th and 6th grade: 12
7th and 8th grade: 0
9th grade: 0
10th grade: 0
11th grade: 0
12th grade, no diploma: 0
High school graduate (or equivalency): 468
Less than 1 year of college: 73
Some college more than 1 year, no degree: 172
Associate degree: 37
Bachelor's degree: 374
Master's degree: 172
Professional school degree: 30
Doctorate degree: 11
Education attainment for females 25 years and older:
No schooling: 9
Nursery to 4th grade: 4
5th and 6th grade: 0
7th and 8th grade: 16
9th grade: 0
10th grade: 0
11th grade: 0
12th grade, no diploma: 21
High school graduate (or equivalency): 191
Less than 1 year of college: 26
Some college more than 1 year, no degree: 330
Associate degree: 137
Bachelor's degree: 608
Master's degree: 132
Professional school degree: 94
Doctorate degree: 16
Housing units in structures:
One, detached: 1,232
One, attached: 119
Two: 67
5 to 9: 18
10 to 19: 22
50 or more: 60
Mobile homes: 21
Housing units lacking complete plumbing facilities in 2022: 1.8%
Housing units lacking complete kitchen facilities in 2022: 1.8%
House/condo owner moved in on average 16 years ago