Sardinia, SC (South Carolina) Houses and Residents
| Sardinia: | $144,320 |
| South Carolina: | $254,600 |
Total population: 3,058 (Urban population: 0, Rural population: 3,031 (32 farm, 2,999 nonfarm))
Houses: 748 (673 occupied: 539 owner occupied, 134 renter occupied)
| % of renters here: | 20% |
| State: | 28% |
Housing density: 11 houses/condos per square mile
Median price asked for vacant for-sale houses and condos in 2022 in this county: $111,399.
Median contract rent in 2022: $461 (lower quartile is $404, upper quartile is $620)
Median rent asked for vacant for-rent units in 2022: $388
Median gross rent in Sardinia, SC in 2022: $656
Housing units in Sardinia with a mortgage: 127 (17 second mortgage, 7 home equity loan, 0 both second mortgage and home equity loan)
Houses without a mortgage: 186
Compare current foreclosures near Sardinia, SC:
| Photo | Address | Area | Beds / Baths | Price | Details |
|---|---|---|---|---|---|

|
#1
Moore Rd
Lake City, SC 29560
|
3,149 sq. feet
|
4 baths 6 beds |
$64,900
|
show details |

|
#2
Hwy 301
Gable, SC 29051
|
1,348 sq. feet
|
1 baths 3 beds |
$200,000
|
show details |

|
#3
Mooneyhan Rd
Sumter, SC 29150
|
2,126 sq. feet
|
2 baths 5 beds |
$180,000
|
show details |

|
#4
Sherwood St
Kingstree, SC 29556
|
1,458 sq. feet
|
- baths - beds |
$39,900
|
show details |

|
#5
Two Mile Rd
Lynchburg, SC 29080
|
2,049 sq. feet
|
2 baths 4 beds |
show details | |

|
#6
Woodtrails Dr
Olanta, SC 29114
|
3,296 sq. feet
|
3 baths 4 beds |
show details | |

|
#7
Alvamarie Ln
Lake City, SC 29560
|
2,080 sq. feet
|
3 baths 3 beds |
show details | |

|
#8
Little John Ln
Sumter, SC 29153
|
1,423 sq. feet
|
2 baths 3 beds |
show details | |

|
#9
Little John Ln
Sumter, SC 29153
|
1,344 sq. feet
|
2 baths 3 beds |
show details | |

|
#10
Highland Dr
Kingstree, SC 29556
|
1,296 sq. feet
|
2 baths 3 beds |
show details |
| Photo | Address | Area | Beds / Baths | Price | Details |
|---|---|---|---|---|---|

|
#11
Virginia St
Kingstree, SC 29556
|
2,056 sq. feet
|
2 baths 4 beds |
show details | |

|
#12
Burgess St
Lake City, SC 29560
|
1,075 sq. feet
|
2 baths 4 beds |
show details | |

|
#13
Vernon Dr
Sumter, SC 29150
|
1,515 sq. feet
|
3 baths 3 beds |
show details | |

|
#14
Fulton Ave
Kingstree, SC 29556
|
2,004 sq. feet
|
2 baths 3 beds |
show details | |

|
#15
E Main St
Olanta, SC 29114
|
816 sq. feet
|
1 baths 3 beds |
show details | |

|
#16
Green Rd
Cades, SC 29518
|
1,782 sq. feet
|
2 baths 4 beds |
show details | |

|
#17
Raccoon Rd
Manning, SC 29102
|
- sq. feet
|
2 baths 3 beds |
show details | |

|
#18
Reedroman Rd
Sumter, SC 29153
|
1,353 sq. feet
|
- baths 3 beds |
show details | |

|
#19
Independence Ave
Lake City, SC 29560
|
1,125 sq. feet
|
1 baths 3 beds |
show details | |

|
#20
S Cartersville Hwy
Timmonsville, SC 29161
|
1,827 sq. feet
|
2 baths 3 beds |
show details |
| Photo | Address | Area | Beds / Baths | Price | Details |
|---|---|---|---|---|---|

|
#21
Glenwood Dr
Sumter, SC 29153
|
1,057 sq. feet
|
- baths 3 beds |
show details | |

|
#22
Huntley St
Lake City, SC 29560
|
1,606 sq. feet
|
2 baths 4 beds |
show details | |

|
#23
S Morris St
Lake City, SC 29560
|
1,229 sq. feet
|
1 baths 3 beds |
show details | |

|
#24
Bingham Ave
Olanta, SC 29114
|
3,056 sq. feet
|
3 baths 4 beds |
show details | |

|
#25
Cooter Creek Rd
Alcolu, SC 29001
|
1,050 sq. feet
|
- baths - beds |
show details | |

|
#26
Habitat Dr
Sumter, SC 29153
|
- sq. feet
|
2 baths 3 beds |
show details | |

|
#27
Mishoe St
Greeleyville, SC 29056
|
1,200 sq. feet
|
- baths - beds |
show details | |

|
#28
Otto Rd
Manning, SC 29102
|
1,728 sq. feet
|
- baths - beds |
show details | |

|
#29
Farmington Rd
Gable, SC 29051
|
896 sq. feet
|
- baths - beds |
show details | |

|
#30
Planters Rd
Kingstree, SC 29556
|
1,584 sq. feet
|
- baths - beds |
show details |
| Photo | Address | Area | Beds / Baths | Price | Details |
|---|---|---|---|---|---|

|
#31
Cooktown Rd
Lake City, SC 29560
|
924 sq. feet
|
- baths - beds |
show details | |

|
#32
Olanta Hwy
Turbeville, SC 29162
|
2,160 sq. feet
|
- baths - beds |
show details | |

|
#33
Loblolly Dr
Manning, SC 29102
|
2,337 sq. feet
|
- baths - beds |
show details | |

|
#34
Legion Rd
Olanta, SC 29114
|
2,432 sq. feet
|
- baths - beds |
show details | |

|
#35
W Academy St
Kingstree, SC 29556
|
2,778 sq. feet
|
- baths - beds |
show details | |

|
#36
Habitat Dr
Sumter, SC 29153
|
- sq. feet
|
2 baths 3 beds |
show details | |

|
#37
Dewitt St
Manning, SC 29102
|
1,472 sq. feet
|
- baths - beds |
show details | |

|
#38
Barrineau Rd
Lake City, SC 29560
|
1,628 sq. feet
|
- baths - beds |
show details | |

|
#39
Habitat Ct
Sumter, SC 29153
|
- sq. feet
|
2 baths 3 beds |
show details | |

|
#40
Logan St
Kingstree, SC 29556
|
2,000 sq. feet
|
- baths - beds |
show details |
| Photo | Address | Area | Beds / Baths | Price | Details |
|---|---|---|---|---|---|

|
#41
Davis St
Lake City, SC 29560
|
- sq. feet
|
2 baths 3 beds |
show details | |

|
#42
Saint John St
Kingstree, SC 29556
|
760 sq. feet
|
- baths - beds |
show details | |

|
#43
Georgia Pacific Rd
Alcolu, SC 29001
|
1,872 sq. feet
|
- baths - beds |
show details | |

|
#44
Manning Hwy
Greeleyville, SC 29056
|
2,142 sq. feet
|
2 baths - beds |
show details | |

|
#45
Davis St
Lake City, SC 29560
|
881 sq. feet
|
- baths - beds |
show details | |

|
#46
Lexington Ave
Kingstree, SC 29556
|
- sq. feet
|
- baths - beds |
show details | |

|
#47
Nevada Ct
Sumter, SC 29153
|
- sq. feet
|
- baths - beds |
show details | |

|
#48
Martin Luther King Ave # 133
Kingstree, SC 29556
|
- sq. feet
|
- baths - beds |
show details | |

|
#49
Moore St
Lake City, SC 29560
|
- sq. feet
|
- baths - beds |
show details | |

|
Check over 1 million property listings on Foreclosure.com!
|
browse all offers | |||

Household type by relationship:
Households: 33,310- In family households: 28,842 (5,396 male householders, 3,842 female householders)
5,916 spouses, 9,546 children (8,817 natural, 302 adopted, 427 stepchildren), 1,728 grandchildren, 577 brothers or sisters, 320 parents, foster children, 613 other relatives, 725 non-relatives
- In nonfamily households: 4,468 (1,806 male householders (1,559 living alone)), 2,088 female householders (1,867 living alone)), 574 nonrelatives
- In group quarters: 1,661 (1,608 institutionalized population)
4,067 married couples with children.
2,630 single-parent households (350 men, 2,280 women).
93.8% of residents of Sardinia speak English at home.
3.6% of residents speak Spanish at home (89% speak English very well, 7% speak English well, 4% speak English not well).
1.9% of residents speak other Indo-European language at home (93% speak English very well, 7% speak English well).
0.7% of residents speak other language at home (57% speak English very well, 43% speak English not well).
Foreign born population: 13 (0.4%)
(123.1% of them are naturalized citizens)
| Here: | 6.2 |
| State: | 6.4 |
| Here: | 4.9 |
| State: | 4.5 |

- Bedrooms in owner-occupied houses and condos in Sardinia, South Carolina
- 5no bedroom
- 61 bedroom
- 1262 bedrooms
- 3413 bedrooms
- 554 bedrooms
- 65+ bedrooms

- Bedrooms in renter-occupied apartments in Sardinia, South Carolina
- 0no bedroom
- 251 bedroom
- 212 bedrooms
- 673 bedrooms
- 214 bedrooms
- 05+ bedrooms

- Cars and other vehicles available in Sardinia in owner-occupied houses/condos
- 20no vehicle
- 2151 vehicle
- 2032 vehicles
- 793 vehicles
- 134 vehicles
- 95+ vehicles

- Cars and other vehicles available in Sardinia in renter-occupied apartments
- 39no vehicle
- 651 vehicle
- 172 vehicles
- 03 vehicles
- 134 vehicles
- 05+ vehicles

- Rooms in owner-occupied houses in Sardinia, South Carolina
- 01 room
- 02 rooms
- 113 rooms
- 864 rooms
- 1915 rooms
- 1286 rooms
- 617 rooms
- 558 rooms
- 79+ rooms

- Rooms in renter-occupied apartments in Sardinia, South Carolina
- 01 room
- 132 rooms
- 193 rooms
- 264 rooms
- 385 rooms
- 196 rooms
- 77 rooms
- 68 rooms
- 69+ rooms


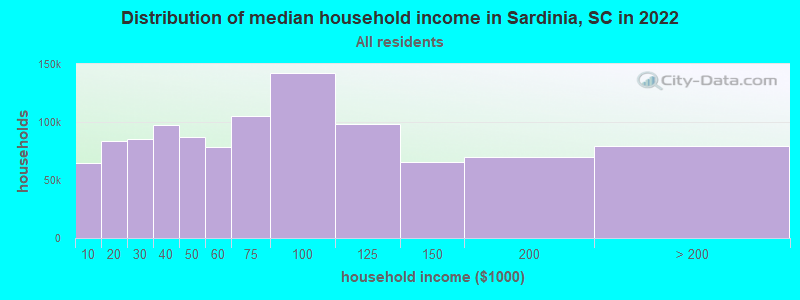
Sardinia, SC household income distribution

- 45,105Less than $10,000
- 68,998$10,000 to $19,999
- 60,357$20,000 to $29,999
- 67,018$30,000 to $39,999
- 61,862$40,000 to $49,999
- 48,316$50,000 to $59,999
- 64,426$60,000 to $74,999
- 85,391$75,000 to $99,999
- 60,255$100,000 to $124,999
- 37,748$125,000 to $149,999
- 37,551$150,000 to $199,999
- 37,021$200,000 or more
Percentage of workers working in this county: 54.0%
Number of people working at home: 51 (7.3% of all workers)
Travel time to work (commute)
- Less than 5 minutes: 23
- 5 to 9 minutes: 53
- 10 to 14 minutes: 87
- 15 to 19 minutes: 114
- 20 to 24 minutes: 84
- 25 to 29 minutes: 62
- 30 to 34 minutes: 97
- 35 to 39 minutes: 12
- 40 to 44 minutes: 15
- 45 to 59 minutes: 88
- 60 to 89 minutes: 23
- 90 or more minutes: 13
Means of transportation to work:
- Drove a car alone: 532 (78.1%)
- Carpooled: 67 (9.8%)
- Bus or trolley bus: 17 (2.5%)
- Walked: 55 (8.1%)
- Worked at home: 10 (1.5%)


- Year of entry for the foreign-born population in Sardinia, South Carolina
- 01995 to March 2000
- 01990 to 1994
- 61985 to 1989
- 01980 to 1984
- 01975 to 1979
- 01970 to 1974
- 01965 to 1969
- 0Before 1965
Most common places of birth for foreign-born residents (%):
| Sardinia: | 100.0% (6) |
| South Carolina: | 2.6% (3,030) |
Place of birth for U.S.-born residents:
- This state: 2,688
- Other state: 337
- Northeast: 99
- Midwest: 13
- South: 188
- West: 37
48% of Sardinia residents lived in the same house 5 years ago.
Out of people who lived in different houses, 24% lived in this county.
Out of people who lived in different counties, 88% lived in South Carolina.
Education attainment for males 25 years and older:
- No schooling: 16
- Nursery to 4th grade: 0
- 5th and 6th grade: 27
- 7th and 8th grade: 23
- 9th grade: 62
- 10th grade: 69
- 11th grade: 90
- 12th grade, no diploma: 56
- High school graduate (or equivalency): 370
- Less than 1 year of college: 21
- Some college more than 1 year, no degree: 48
- Associate degree: 41
- Bachelor's degree: 67
- Master's degree: 11
- Professional school degree: 0
- Doctorate degree: 0

Education attainment for females 25 years and older:
- No schooling: 5
- Nursery to 4th grade: 15
- 5th and 6th grade: 13
- 7th and 8th grade: 40
- 9th grade: 37
- 10th grade: 30
- 11th grade: 18
- 12th grade, no diploma: 20
- High school graduate (or equivalency): 227
- Less than 1 year of college: 18
- Some college more than 1 year, no degree: 86
- Associate degree: 11
- Bachelor's degree: 96
- Master's degree: 20
- Professional school degree: 9
- Doctorate degree: 0


Housing units in structures:
- One, detached: 510
- Two: 6
- 3 or 4: 6
- Mobile homes: 226
Median worth of mobile homes: $57,621
Housing units lacking complete kitchen facilities: 4.9%

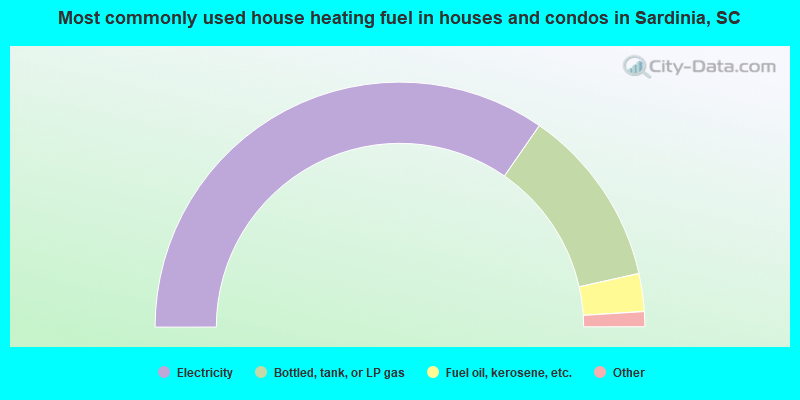
- 69.2%Electricity
- 23.7%Bottled, tank, or LP gas
- 5.0%Fuel oil, kerosene, etc.
- 1.1%Wood
- 0.9%Utility gas
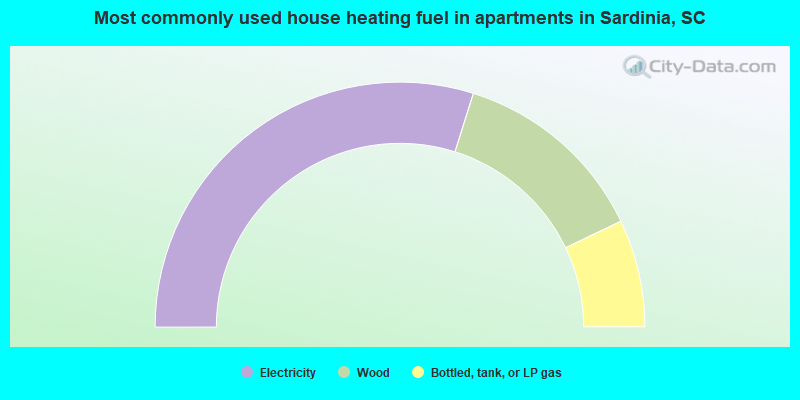
- 59.7%Electricity
- 26.1%Wood
- 14.2%Bottled, tank, or LP gas
Private vs. public school enrollment:
| Here: | 10.7% |
| South Carolina: | 9.2% |
| Here: | 3.8% |
| South Carolina: | 8.1% |
| Here: | 8.0% |
| South Carolina: | 20.3% |


