Scarsdale, NY (New York) Houses and Residents
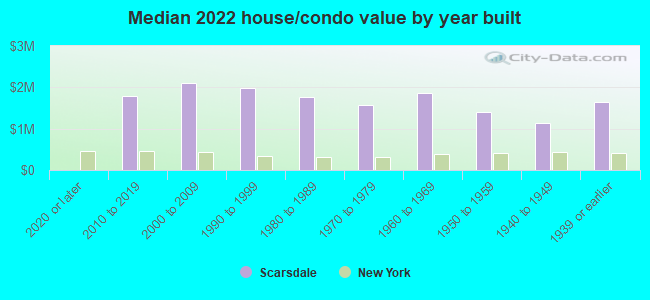
Estimated median house or condo value in 2022: $1,677,144 (it was $691,400 in 2000 )
Scarsdale:
$1,677,144New York:
$400,400
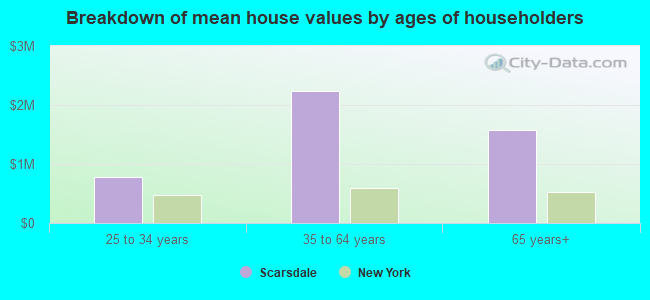
Lower value quartile - upper value quartile: $1,241,135 - $2,029,276Mean price in 2022: Detached houses: $2,085,295 Here:
$2,085,295State:
$476,719
Townhouses or other attached units: $676,057 Here:
$676,057State:
$699,270
In 5-or-more-unit structures: $900,732 Here:
$900,732State:
$912,009
Total population: 17,729 (All urban)
Houses: 6,057 (5,595 occupied: 5,083 owner occupied, 526 renter occupied )
% of renters here:
9%State:
46%
Housing density: 913 houses/condos per square mile
Median price asked for vacant for-sale houses and condos in 2022: $1,159,565.
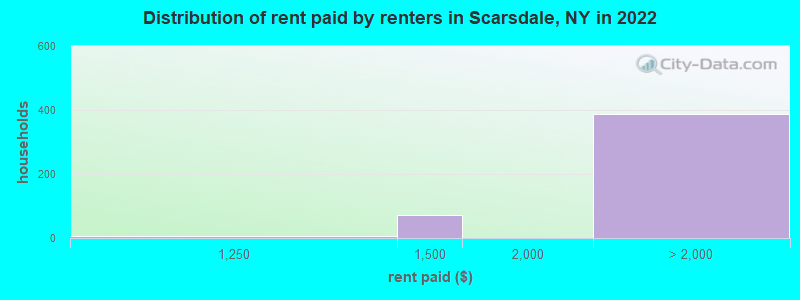
Median contract rent in 2022: over $2,000
Median rent asked for vacant for-rent units in 2022: $8,035
Median gross rent in Scarsdale, NY in 2022: over $2,000
Housing units in Scarsdale with a mortgage: 3,352 (415 second mortgage, 0 home equity loan, 422 both second mortgage and home equity loan )Houses without a mortgage: 15
Median household income for houses/condos with a mortgage: $249,777
Median household income for apartments without a mortgage: $245,510
Median monthly housing costs: $3,934
Data:
Median house or condo value ($)
Median house or condo value ($ change since 2000)
Median house or condo value ($) - White
Median house or condo value ($) - Black or African American
Median house or condo value ($) - Asian
Median house or condo value ($) - Hispanic or Latino
Median house or condo value ($) - American Indian and Alaska Native
Median house or condo value ($) - Multirace
Median house or condo value ($) - Other Race
Median price asked for mobile homes ($)
Household density (households per square mile)
Mean house or condo value by units in structure - 1, detached ($)
Mean house or condo value by units in structure - 1, attached ($)
Mean house or condo value by units in structure - 2 ($)
Mean house or condo value by units in structure by units in structure - 3 or 4 ($)
Mean house or condo value by units in structure - 5 or more ($)
Mean house or condo value by units in structure - Boat, RV, van, etc. ($)
Mean house or condo value by units in structure - Mobile home ($)
Median contract rent ($)
Median contract rent - Lower quartile ($)
Median contract rent - Upper quartile ($)
Median gross rent ($)
Urban houses (%)
Rural houses (%)
Houses occupied (%)
Houses occupied (% change since 2000)
Houses owner occupied (%)
Houses owner occupied (% change since 2000)
Houses renter occupied (%)
Houses renter occupied (% change since 2000)
Vacant housing units - For rent (%)
Vacant housing units - For rent (% change since 2000)
Vacant housing units - For sale only (%)
Vacant housing units - For sale only (% change since 2000)
Vacant housing units - Rented or sold, not occupied (%)
Vacant housing units - Rented or sold, not occupied (% change since 2000)
Vacant housing units - For seasonal, recreational, or occasional use (%)
Vacant housing units - For seasonal, recreational, or occasional use (% change since 2000)
Vacant housing units - For migrant workers (%)
Vacant housing units - For migrant workers (% change since 2000)
Vacant housing units - Other vacant (%)
Vacant housing units - Other vacant (% change since 2000)
Median monthly housing costs ($)
Median household income for houses/condos with a mortgage ($)
Median household income for houses/condos without a mortgage ($)
Median household income ($)
Median household income ($) - White
Median household income ($) - Black or African American
Median household income ($) - Asian
Median household income ($) - Hispanic or Latino
Median household income ($) - American Indian and Alaska Native
Median household income ($) - Multirace
Median household income ($) - Other Race
Mortgage status - with mortgage (%)
Mortgage status - with second mortgage (%)
Mortgage status - with home equity loan (%)
Mortgage status - with both second mortgage and home equity loan (%)
Mortgage status - without a mortgage (%)
Median year house/condo built
Median year apartment built
Household type by relationship - Male householder living alone (%)
Household type by relationship - Male householder not living alone (%)
Household type by relationship - Female householder living alone (%)
Household type by relationship - Female householder not living alone (%)
Household type by relationship - Opposite-Sex spouse (%)
Household type by relationship - Same-Sex spouse (%)
Household type by relationship - Opposite-Sex unmarried partner (%)
Household type by relationship - Same-Sex unmarried partner (%)
Household type by relationship - In group quarters (%)
Size of family households - 2-person household (%)
Size of family households - 3-person household (%)
Size of family households - 4-person household (%)
Size of family households - 5-person household (%)
Size of family households - 6-person household (%)
Size of family households - 7-or-more-person household (%)
Size of nonfamily households - 1-person household (%)
Size of nonfamily households - 2-person household (%)
Size of nonfamily households - 3-person household (%)
Size of nonfamily households - 4-person household (%)
Size of nonfamily households - 5-person household (%)
Size of nonfamily households - 6-person household (%)
Size of nonfamily households - 7-or-moreperson household (%)
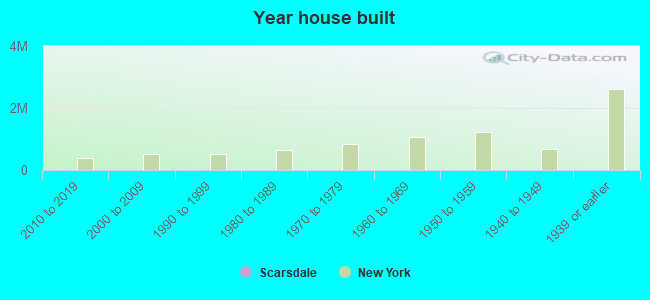
Year house built - Built 2010 or later (%)
Year house built - Built 2000 to 2009 (%)
Year house built - Built 1990 to 1999 (%)
Year house built - Built 1980 to 1989 (%)
Year house built - Built 1970 to 1979 (%)
Year house built - Built 1960 to 1969 (%)
Year house built - Built 1950 to 1959 (%)
Year house built - Built 1940 to 1949 (%)
Year house built - Built 1939 or earlier (%)
Median number of rooms in houses and condos
Median number of rooms in apartments
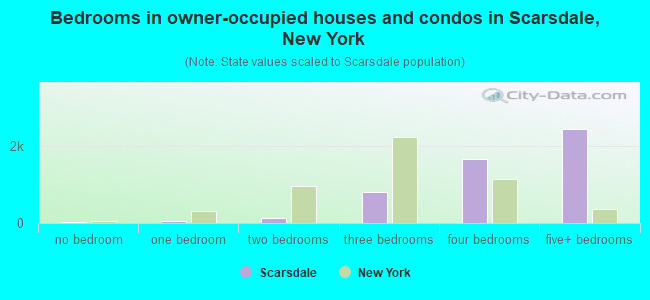
Median number of bedrooms in owner occupied houses
Mean number of bedrooms in owner occupied houses
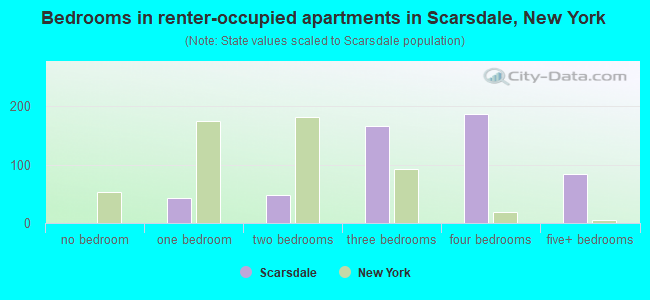
Median number of bedrooms in renter occupied houses
Mean number of bedrooms in renter occupied houses
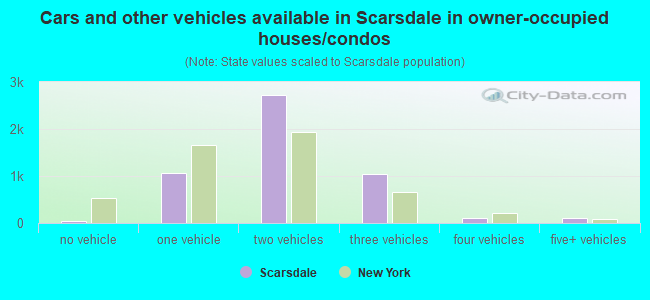
Median number of vehichles in owner occupied houses
Mean number of vehichles in owner occupied houses
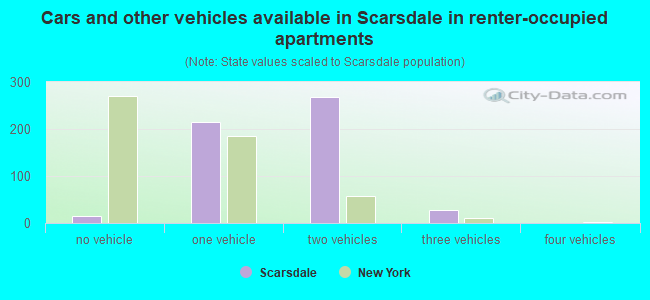
Median number of vehichles in renter occupied houses
Mean number of vehichles in renter occupied houses
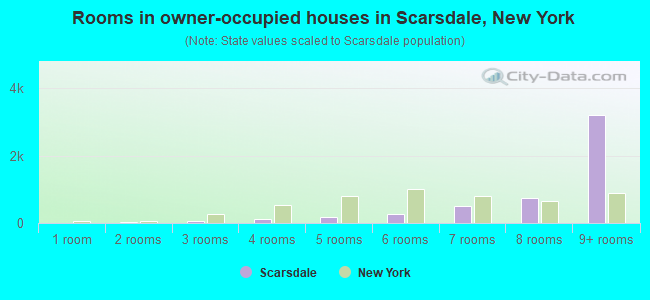
Rooms in owner-occupied houses - 1 room (%)
Rooms in owner-occupied houses - 2 rooms (%)
Rooms in owner-occupied houses - 3 rooms (%)
Rooms in owner-occupied houses - 4 rooms (%)
Rooms in owner-occupied houses - 5 rooms (%)
Rooms in owner-occupied houses - 6 rooms (%)
Rooms in owner-occupied houses - 7 rooms (%)
Rooms in owner-occupied houses - 8 rooms (%)
Rooms in owner-occupied houses - 9+ rooms (%)
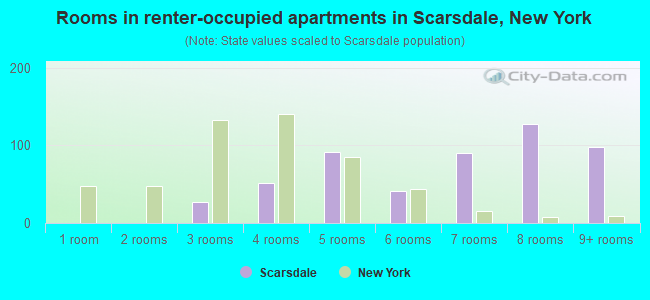
Rooms in renter-occupied houses - 1 room (%)
Rooms in renter-occupied houses - 2 rooms (%)
Rooms in renter-occupied houses - 3 rooms (%)
Rooms in renter-occupied houses - 4 rooms (%)
Rooms in renter-occupied houses - 5 rooms (%)
Rooms in renter-occupied houses - 6 rooms (%)
Rooms in renter-occupied houses - 7 rooms (%)
Rooms in renter-occupied houses - 8 rooms (%)
Rooms in renter-occupied houses - 9+ rooms (%)
Bedrooms in owner-occupied houses - no bedrooms (%)
Bedrooms in owner-occupied houses - 1 bedroom (%)
Bedrooms in owner-occupied houses - 2 bedrooms (%)
Bedrooms in owner-occupied houses - 3 bedrooms (%)
Bedrooms in owner-occupied houses - 4 bedrooms (%)
Bedrooms in owner-occupied houses - 5+ bedrooms (%)
Bedrooms in renter-occupied houses - no bedrooms (%)
Bedrooms in renter-occupied houses - 1 bedroom (%)
Bedrooms in renter-occupied houses - 2 bedrooms (%)
Bedrooms in renter-occupied houses - 3 bedrooms (%)
Bedrooms in renter-occupied houses - 4 bedrooms (%)
Bedrooms in renter-occupied houses - 5+ bedrooms (%)
Vehicles available in owner-occupied houses - no vehicle available (%)
Vehicles available in owner-occupied houses - 1 vehicle available(%)
Vehicles available in owner-occupied houses - 2 Vehicles available (%)
Vehicles available in owner-occupied houses - 3 Vehicles available (%)
Vehicles available in owner-occupied houses - 4 Vehicles available (%)
Vehicles available in owner-occupied houses - 5+ Vehicles available (%)
Vehicles available in renter-occupied houses - no vehicle available (%)
Vehicles available in renter-occupied houses - 1 vehicle available (%)
Vehicles available in renter-occupied houses - 2 Vehicles available (%)
Vehicles available in renter-occupied houses - 3 Vehicles available (%)
Vehicles available in renter-occupied houses - 4 Vehicles available (%)
Vehicles available in renter-occupied houses - 5+ Vehicles available (%)
Housing units in structures - 1, detached (%)
Housing units in structures - 1, attached (%)
Housing units in structures - 2 (%)
Housing units in structures - 3 or 4 (%)
Housing units in structures - 5 to 9 (%)
Housing units in structures - 10 to 19 (%)
Housing units in structures - 20 to 49 (%)
Housing units in structures - 50 or more (%)
Housing units in structures - Mobile home (%)
Housing units in structures - Boat, RV, van, etc. (%)
Housing units in structures - Owners - 1, detached (%)
Housing units in structures - Owners - 1, attached (%)
Housing units in structures - Owners - 2 (%)
Housing units in structures - Owners - 3 or 4 (%)
Housing units in structures - Owners - 5 to 9 (%)
Housing units in structures - Owners - 10 to 19 (%)
Housing units in structures - Owners - 20 to 49 (%)
Housing units in structures - Owners - 50 or more (%)
Housing units in structures - Owners - Mobile home (%)
Housing units in structures - Owners - Boat, RV, van, etc. (%)
Housing units in structures - Renters - 1, detached (%)
Housing units in structures - Renters - 1, attached (%)
Housing units in structures - Renters - 2 (%)
Housing units in structures - Renters - 3 or 4 (%)
Housing units in structures - Renters - 5 to 9 (%)
Housing units in structures - Renters - 10 to 19 (%)
Housing units in structures - Renters - 20 to 49 (%)
Housing units in structures - Renters - 50 or more (%)
Housing units in structures - Renters - Mobile home (%)
Housing units in structures - Renters - Boat, RV, van, etc. (%)
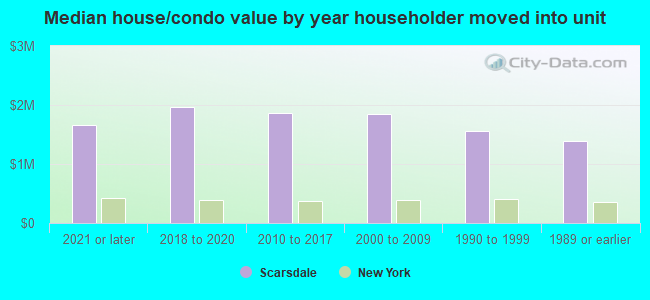
House/condo owner moved in on average (years ago)
Renter moved in on average (years ago)
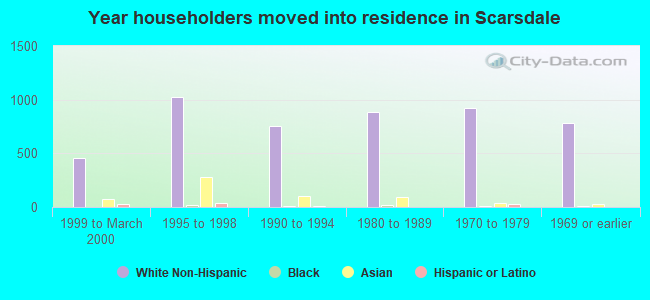
Year householder moved into unit - Moved in 1999 to March 2000 (%)
Year householder moved into unit - Moved in 1999 to March 2000 (%) - White
Year householder moved into unit - Moved in 1999 to March 2000 (%) - Black or African American
Year householder moved into unit - Moved in 1999 to March 2000 (%) - Asian
Year householder moved into unit - Moved in 1999 to March 2000 (%) - Hispanic or Latino
Year householder moved into unit - Moved in 1999 to March 2000 (%) - American Indian and Alaska Native
Year householder moved into unit - Moved in 1999 to March 2000 (%) - Multirace
Year householder moved into unit - Moved in 1999 to March 2000 (%) - Other Race
Year householder moved into unit - Moved in 1995 to 1998 (%)
Year householder moved into unit - Moved in 1995 to 1998 (%) - White
Year householder moved into unit - Moved in 1995 to 1998 (%) - Black or African American
Year householder moved into unit - Moved in 1995 to 1998 (%) - Asian
Year householder moved into unit - Moved in 1995 to 1998 (%) - Hispanic or Latino
Year householder moved into unit - Moved in 1995 to 1998 (%) - American Indian and Alaska Native
Year householder moved into unit - Moved in 1995 to 1998 (%) - Multirace
Year householder moved into unit - Moved in 1995 to 1998 (%) - Other Race
Year householder moved into unit - Moved in 1990 to 1994 (%)
Year householder moved into unit - Moved in 1990 to 1994 (%) - White
Year householder moved into unit - Moved in 1990 to 1994 (%) - Black or African American
Year householder moved into unit - Moved in 1990 to 1994 (%) - Asian
Year householder moved into unit - Moved in 1990 to 1994 (%) - Hispanic or Latino
Year householder moved into unit - Moved in 1990 to 1994 (%) - American Indian and Alaska Native
Year householder moved into unit - Moved in 1990 to 1994 (%) - Multirace
Year householder moved into unit - Moved in 1990 to 1994 (%) - Other Race
Year householder moved into unit - Moved in 1980 to 1989 (%)
Year householder moved into unit - Moved in 1980 to 1989 (%) - White
Year householder moved into unit - Moved in 1980 to 1989 (%) - Black or African American
Year householder moved into unit - Moved in 1980 to 1989 (%) - Asian
Year householder moved into unit - Moved in 1980 to 1989 (%) - Hispanic or Latino
Year householder moved into unit - Moved in 1980 to 1989 (%) - American Indian and Alaska Native
Year householder moved into unit - Moved in 1980 to 1989 (%) - Multirace
Year householder moved into unit - Moved in 1980 to 1989 (%) - Other Race
Year householder moved into unit - Moved in 1970 to 1979 (%)
Year householder moved into unit - Moved in 1970 to 1979 (%) - White
Year householder moved into unit - Moved in 1970 to 1979 (%) - Black or African American
Year householder moved into unit - Moved in 1970 to 1979 (%) - Asian
Year householder moved into unit - Moved in 1970 to 1979 (%) - Hispanic or Latino
Year householder moved into unit - Moved in 1970 to 1979 (%) - American Indian and Alaska Native
Year householder moved into unit - Moved in 1970 to 1979 (%) - Multirace
Year householder moved into unit - Moved in 1970 to 1979 (%) - Other Race
Year householder moved into unit - Moved in 1969 or earlier (%)
Year householder moved into unit - Moved in 1969 or earlier (%) - White
Year householder moved into unit - Moved in 1969 or earlier (%) - Black or African American
Year householder moved into unit - Moved in 1969 or earlier (%) - Asian
Year householder moved into unit - Moved in 1969 or earlier (%) - Hispanic or Latino
Year householder moved into unit - Moved in 1969 or earlier (%) - American Indian and Alaska Native
Year householder moved into unit - Moved in 1969 or earlier (%) - Multirace
Year householder moved into unit - Moved in 1969 or earlier (%) - Other Race
Housing units lacking complete plumbing facilities (%)
Housing units lacking complete kitchen facilities (%)
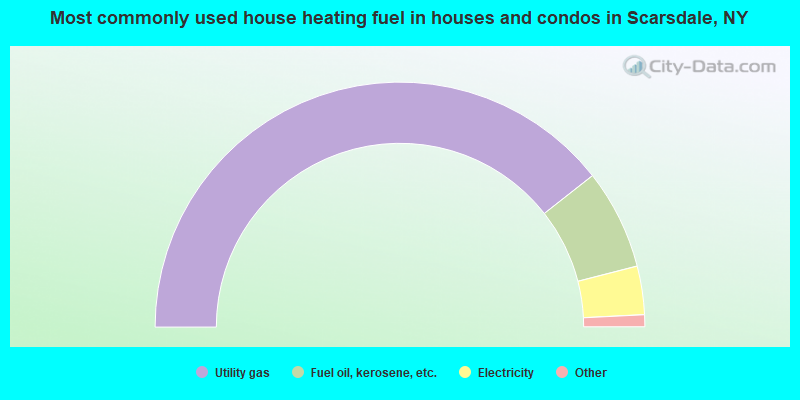
House heating fuel used in houses and condos - Utility gas (%)
House heating fuel used in houses and condos - Bottled, tank, or LP gas (%)
House heating fuel used in houses and condos - Electricity (%)
House heating fuel used in houses and condos - Fuel oil, kerosene, etc. (%)
House heating fuel used in houses and condos - Coal or coke (%)
House heating fuel used in houses and condos - Wood (%)
House heating fuel used in houses and condos - Solar energy (%)
House heating fuel used in houses and condos - Other fuel (%)
House heating fuel used in houses and condos - No fuel used (%)
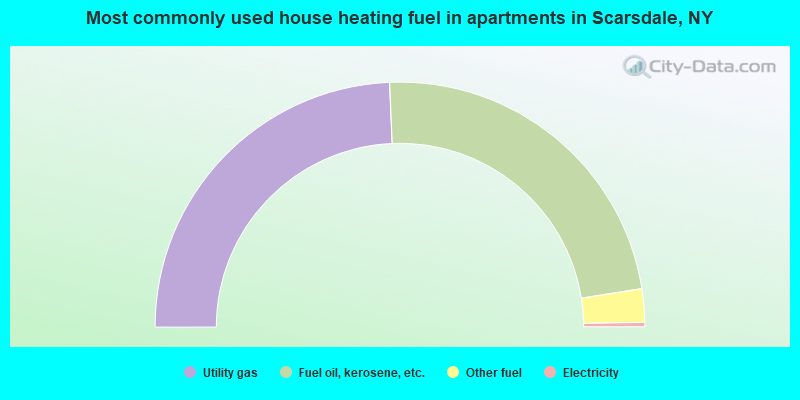
House heating fuel used in apartments - Utility gas (%)
House heating fuel used in apartments - Bottled, tank, or LP gas (%)
House heating fuel used in apartments - Electricity (%)
House heating fuel used in apartments - Fuel oil, kerosene, etc. (%)
House heating fuel used in apartments - Coal or coke (%)
House heating fuel used in apartments - Wood (%)
House heating fuel used in apartments - Solar energy (%)
House heating fuel used in apartments - Other fuel (%)
House heating fuel used in apartments - No fuel used (%)
Latest news about housing in Scarsdale, NY collected exclusively by city-data.com from local newspapers, TV, and radio stations
Median year house/condo built: 1946Median year apartment built: 1940Household type by relationship:
Households: 17,925
Male householders: 3,362 (47 living alone ), Female householders: 2,119 (386 living alone )4,450 spouses (4,443 opposite-sex spouses ), 124 unmarried partners , (124 opposite-sex unmarried partners ), 7,174 children (6,981 natural , 97 adopted , 96 stepchildren ), 97 grandchildren , 27 brothers or sisters , 237 parents , 0 foster children , 110 other relatives , 186 non-relatives In group quarters: 35
Size of family households: 1,644 2-persons , 732 3-persons , 1,573 4-persons , 734 5-persons , 246 6-persons , 24 7-or-more-persons .
Size of nonfamily households: 471 1-person , 79 2-persons , 13 4-persons .
5,010 married couples with children. single-parent households (349 men , 201 women ).
74.0% of residents of Scarsdale speak English at home. of residents speak Spanish at home (73% speak English very well , 19% speak English well , 5% speak English not well , 3% don't speak English at all ).of residents speak other Indo-European language at home (83% speak English very well , 13% speak English well , 4% speak English not well ).of residents speak Asian or Pacific Island language at home (66% speak English very well , 21% speak English well , 5% speak English not well , 8% don't speak English at all ).of residents speak other language at home (100% speak English very well ).
Foreign born population: 4,454 (24.8%)of them are naturalized citizens )
Median number of rooms in houses and condos:
Median number of rooms in apartments
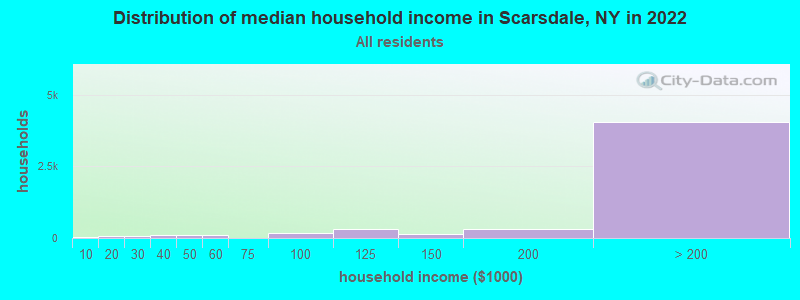
Scarsdale, NY household income distribution 49 Less than $10,00071 $10,000 to $19,99960 $20,000 to $29,99991 $30,000 to $39,99994 $40,000 to $49,99994 $50,000 to $59,99917 $60,000 to $74,999173 $75,000 to $99,999298 $100,000 to $124,999146 $125,000 to $149,999311 $150,000 to $199,9994,047 $200,000 or more
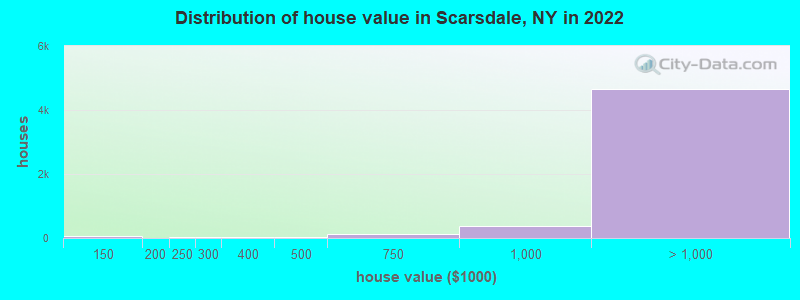
Home value of owner - occupied houses in 2022 in Scarsdale, NY 17 Less than $10,0003 $15,000 to $19,99939 $100,000 to $124,99923 $125,000 to $149,99941 $200,000 to $249,99926 $250,000 to $299,99924 $300,000 to $399,99932 $400,000 to $499,999115 $500,000 to $749,999363 $750,000 to $999,9991,494 $1,000,000 to $1,499,9991,317 $1,500,000 to $1,999,9991,844 $2,000,000 or moreRent paid by renters in 2022 in Scarsdale, NY 7 $1,000 to $1,24972 $1,250 to $1,49939 $2,000 to $2,49925 $2,500 to $2,99912 $3,000 to $3,499221 $3,500 or more89 No cash rent
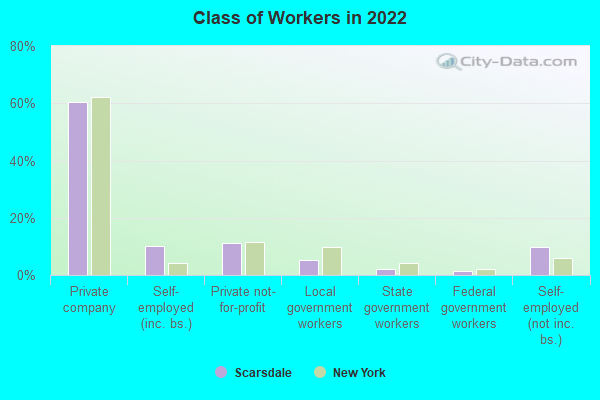
Percentage of workers working in this county: 53.3%Number of people working at home: 2,637 (34.1% of all workers )
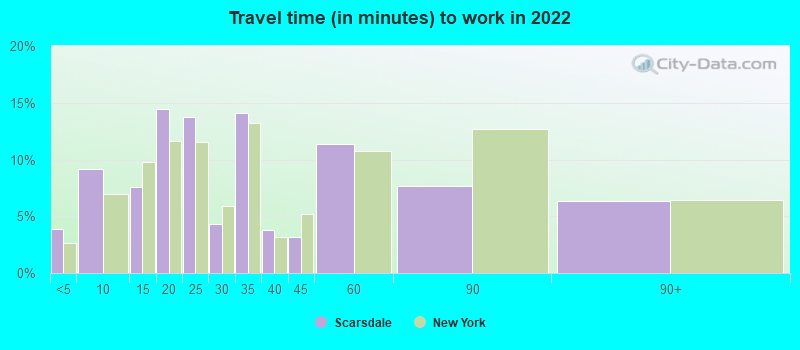
Travel time to work (commute)
Less than 5 minutes: 1615 to 9 minutes: 36810 to 14 minutes: 17315 to 19 minutes: 41520 to 24 minutes: 47125 to 29 minutes: 13130 to 34 minutes: 27235 to 39 minutes: 35540 to 44 minutes: 28445 to 59 minutes: 72060 to 89 minutes: 1,77790 or more minutes: 157
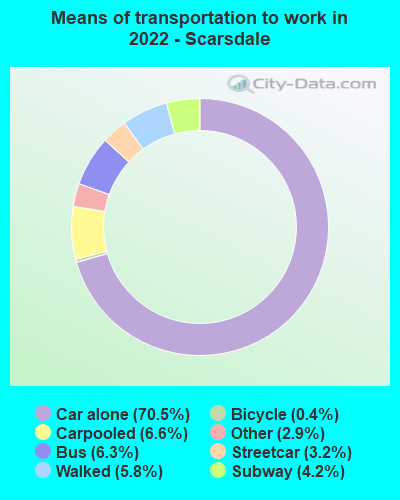
Means of transportation to work:
Drove a car alone: 3,329 (46.6%)Carpooled: 316 (4.4%)Bus : 256 (3.6%)Subway or elevated rail : 200 (2.8%)Long-distance train or commuter rail : 150 (2.1%)Taxi: 240 (3.4%)Bicycle: 23 (0.3%)Walked: 271 (3.8%)Worked at home: 2,637 (36.9%)
Unemployment by race in 2022
Unemployment rate for White non-Hispanic residents 2.4% Males3.5% FemalesUnemployment rate for Black residents 2.0% MalesUnemployment rate for Asian residents 2.5% Males3.1% FemalesUnemployment rate for two or more race residents 6.9% Males19.1% FemalesUnemployment rate for Hispanic or Latino residents 10.8% Females
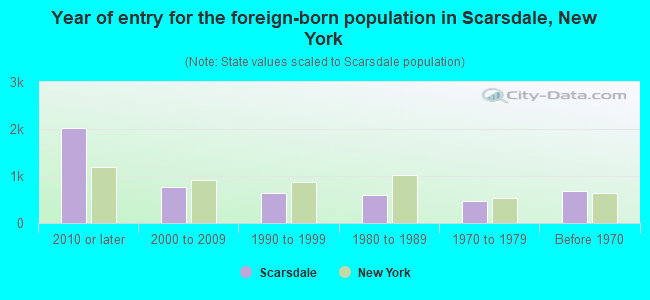
Year of entry for the foreign-born population in Scarsdale, New York
2,013 2010 or later 762 2000 to 2009 638 1990 to 1999 586 1980 to 1989 468 1970 to 1979 688 Before 1970
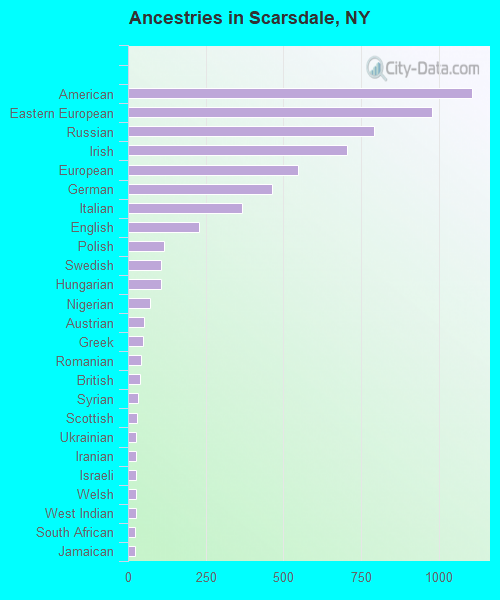
First ancestries reported:
American: 1,106 (11.1%)
Eastern European: 979 (9.8%)
Russian: 790 (7.9%)
Irish: 703 (7.0%)
European: 547 (5.5%)
German: 462 (4.6%)
Italian: 366 (3.7%)
English: 230 (2.3%)
Polish: 115 (1.1%)
Swedish: 106 (1.1%)
Hungarian: 106 (1.1%)
Nigerian: 70 (0.7%)
Austrian: 52 (0.5%)
Greek: 48 (0.5%)
Romanian: 42 (0.4%)
British: 39 (0.4%)
Syrian: 32 (0.3%)
Scottish: 29 (0.3%)
Ukrainian: 27 (0.3%)
Iranian: 26 (0.3%)
Israeli: 26 (0.3%)
Welsh: 26 (0.3%)
West Indian: 25 (0.2%)
South African: 23 (0.2%)
Jamaican: 23 (0.2%)
Canadian: 20 (0.2%)
Norwegian: 17 (0.2%)
Estonian: 14 (0.1%)
Portuguese: 14 (0.1%)
Scotch-Irish: 12 (0.1%)
Brazilian: 12 (0.1%)
French: 9 (0.09%)
Dutch: 9 (0.09%)
Armenian: 9 (0.09%)
Northern European: 8 (0.08%)
Lithuanian: 7 (0.07%)
Croatian: 6 (0.06%)
Lebanese: 3 (0.03%)
Guyanese: 2 (0.02%) Most common places of birth for foreign-born residents (%): China, excluding Hong Kong and Taiwan Scarsdale:
18.4% (813)New York:
9.1% (410,910)
India Scarsdale:
9.3% (408)New York:
3.5% (158,432)
Ireland Scarsdale:
6.0% (265)New York:
0.6% (26,772)
United Kingdom, excluding England and Scotland Scarsdale:
5.1% (226)New York:
0.8% (33,869)
Other South America Scarsdale:
4.8% (210)New York:
0.2% (8,613)
Korea Scarsdale:
3.1% (136)New York:
1.8% (82,786)
Italy Scarsdale:
3.0% (133)New York:
1.8% (81,374)
South Africa Scarsdale:
3.0% (132)New York:
0.2% (8,010)
Brazil Scarsdale:
2.9% (128)New York:
0.7% (30,658)
Hong Kong Scarsdale:
2.7% (121)New York:
0.9% (42,220)
Mexico Scarsdale:
2.5% (110)New York:
4.8% (214,559)
Germany Scarsdale:
2.5% (110)New York:
0.9% (38,713)
Canada Scarsdale:
2.5% (110)New York:
1.3% (59,107)
Russia Scarsdale:
2.4% (104)New York:
1.7% (75,802)
Japan Scarsdale:
1.9% (83)New York:
0.6% (28,472)
Philippines Scarsdale:
1.8% (79)New York:
2.0% (91,070)
Nigeria Scarsdale:
1.7% (76)New York:
0.7% (33,746)
Taiwan Scarsdale:
1.7% (74)New York:
0.7% (30,619)
Sweden Scarsdale:
1.6% (72)New York:
0.1% (3,808)
Israel Scarsdale:
1.6% (72)New York:
0.7% (29,743)
Place of birth for U.S.-born residents:
This state: 9,529Other state: 3,520Northeast: 1,369Midwest: 772South: 719West: 714 89.1% of Scarsdale residents lived in the same house 1 years ago.
Out of people who lived in different houses, 25.0% lived in this county.
Out of people who lived in different counties, 64.9% lived in New York.
Scarsdale:
89.1%State average:
89.6%
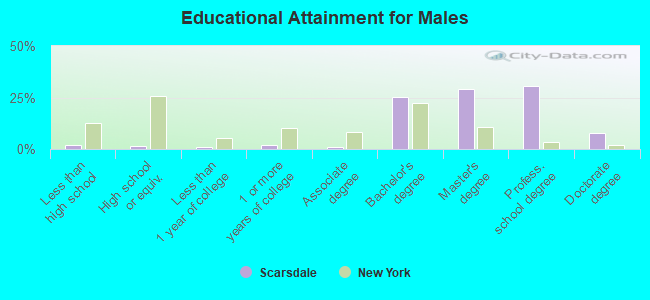
Education attainment for males 25 years and older:
No schooling: 0Nursery to 4th grade: 05th and 6th grade: 117th and 8th grade: 389th grade: 010th grade: 2411th grade: 512th grade, no diploma: 34High school graduate (or equivalency): 81Less than 1 year of college: 64Some college more than 1 year, no degree: 112Associate degree: 41Bachelor's degree: 1,397Master's degree: 1,603Professional school degree: 1,700Doctorate degree: 419
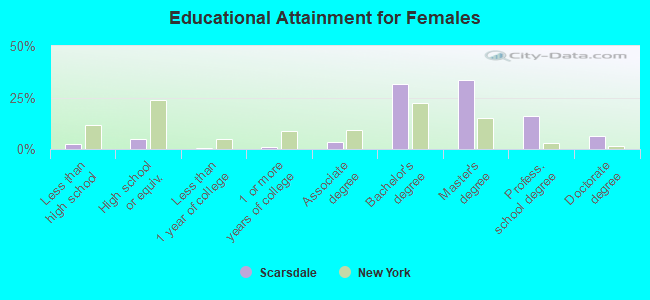
Education attainment for females 25 years and older:
No schooling: 12Nursery to 4th grade: 55th and 6th grade: 247th and 8th grade: 299th grade: 1110th grade: 111th grade: 412th grade, no diploma: 49High school graduate (or equivalency): 282Less than 1 year of college: 29Some college more than 1 year, no degree: 57Associate degree: 198Bachelor's degree: 1,800Master's degree: 1,920Professional school degree: 918Doctorate degree: 361
Housing units in structures:
One, detached: 5,649One, attached: 48Two: 113 or 4: 125 to 9: 8010 to 19: 10120 to 49: 12450 or more: 30Housing units lacking complete plumbing facilities in 2022: 0.9%Housing units lacking complete kitchen facilities in 2022: 1.4%House/condo owner moved in on average 11 years ago
Renter moved in on average 0 years ago
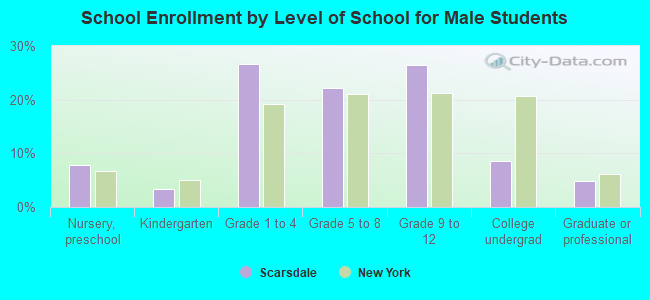
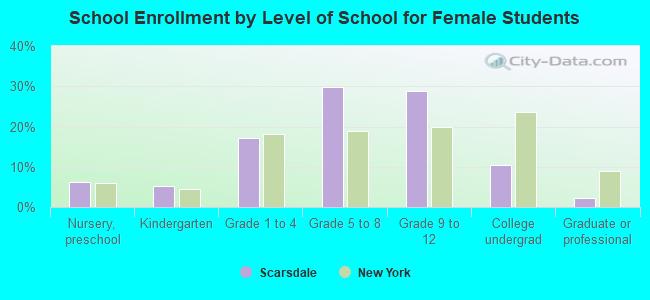
Private vs. public school enrollment:
Students in private schools in grades 1 to 8 (elementary and middle school): 138 Students in private schools in grades 9 to 12 (high school): 115 Students in private undergraduate colleges: 473