Schererville, IN (Indiana) Houses and Residents
Estimated median house or condo value in 2022: $324,468 (it was $155,400 in 2000 )
Schererville:
$324,468Indiana:
$208,700
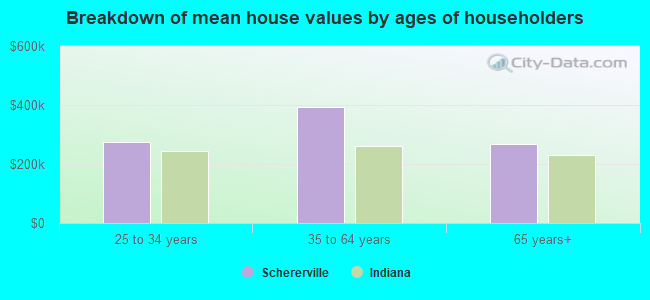
Lower value quartile - upper value quartile: $247,552 - $427,342Mean price in 2022: Detached houses: $380,950 Here:
$380,950State:
$257,916
Townhouses or other attached units: $245,711 Here:
$245,711State:
$224,114
In 2-unit structures: $198,754 Here:
$198,754State:
$175,375
In 3-to-4-unit structures: $262,145 Here:
$262,145State:
$151,116
In 5-or-more-unit structures: $116,571 Here:
$116,571State:
$200,844
Mobile homes: $11,897 Here:
$11,897State:
$67,116
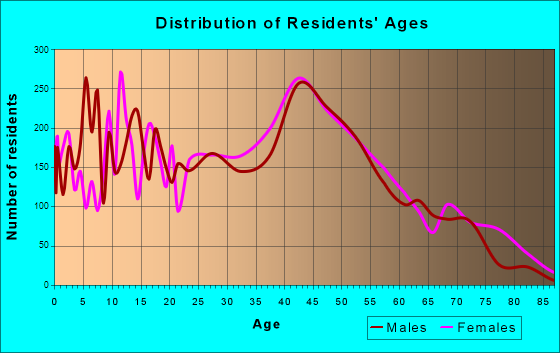
Total population: 28,926 (Urban population: 24,771, Rural population: 54 (all nonfarm) )
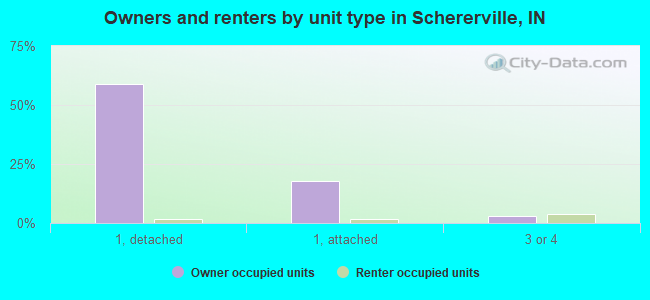
Houses: 12,452 (11,961 occupied: 9,516 owner occupied, 2,455 renter occupied )
% of renters here:
21%State:
29%
Housing density: 915 houses/condos per square mile
Median price asked for vacant for-sale houses and condos in 2022: $2,210,798.
Median contract rent in 2022: $993 (lower quartile is $915, upper quartile is $1,238)
Median rent asked for vacant for-rent units in 2022: $1,638
Median gross rent in Schererville, IN in 2022: $1,145
Housing units in Schererville with a mortgage: 6,031 (654 second mortgage, 51 home equity loan, 553 both second mortgage and home equity loan )Houses without a mortgage: 165
Median household income for houses/condos with a mortgage: $107,992
Median household income for apartments without a mortgage: $69,830
Median monthly housing costs: $1,187
Data:
Median house or condo value ($)
Median house or condo value ($ change since 2000)
Median house or condo value ($) - White
Median house or condo value ($) - Black or African American
Median house or condo value ($) - Asian
Median house or condo value ($) - Hispanic or Latino
Median house or condo value ($) - American Indian and Alaska Native
Median house or condo value ($) - Multirace
Median house or condo value ($) - Other Race
Median price asked for mobile homes ($)
Household density (households per square mile)
Mean house or condo value by units in structure - 1, detached ($)
Mean house or condo value by units in structure - 1, attached ($)
Mean house or condo value by units in structure - 2 ($)
Mean house or condo value by units in structure by units in structure - 3 or 4 ($)
Mean house or condo value by units in structure - 5 or more ($)
Mean house or condo value by units in structure - Boat, RV, van, etc. ($)
Mean house or condo value by units in structure - Mobile home ($)
Median contract rent ($)
Median contract rent - Lower quartile ($)
Median contract rent - Upper quartile ($)
Median gross rent ($)
Urban houses (%)
Rural houses (%)
Houses occupied (%)
Houses occupied (% change since 2000)
Houses owner occupied (%)
Houses owner occupied (% change since 2000)
Houses renter occupied (%)
Houses renter occupied (% change since 2000)
Vacant housing units - For rent (%)
Vacant housing units - For rent (% change since 2000)
Vacant housing units - For sale only (%)
Vacant housing units - For sale only (% change since 2000)
Vacant housing units - Rented or sold, not occupied (%)
Vacant housing units - Rented or sold, not occupied (% change since 2000)
Vacant housing units - For seasonal, recreational, or occasional use (%)
Vacant housing units - For seasonal, recreational, or occasional use (% change since 2000)
Vacant housing units - For migrant workers (%)
Vacant housing units - For migrant workers (% change since 2000)
Vacant housing units - Other vacant (%)
Vacant housing units - Other vacant (% change since 2000)
Median monthly housing costs ($)
Median household income for houses/condos with a mortgage ($)
Median household income for houses/condos without a mortgage ($)
Median household income ($)
Median household income ($) - White
Median household income ($) - Black or African American
Median household income ($) - Asian
Median household income ($) - Hispanic or Latino
Median household income ($) - American Indian and Alaska Native
Median household income ($) - Multirace
Median household income ($) - Other Race
Mortgage status - with mortgage (%)
Mortgage status - with second mortgage (%)
Mortgage status - with home equity loan (%)
Mortgage status - with both second mortgage and home equity loan (%)
Mortgage status - without a mortgage (%)
Median year house/condo built
Median year apartment built
Household type by relationship - Male householder living alone (%)
Household type by relationship - Male householder not living alone (%)
Household type by relationship - Female householder living alone (%)
Household type by relationship - Female householder not living alone (%)
Household type by relationship - Opposite-Sex spouse (%)
Household type by relationship - Same-Sex spouse (%)
Household type by relationship - Opposite-Sex unmarried partner (%)
Household type by relationship - Same-Sex unmarried partner (%)
Household type by relationship - In group quarters (%)
Size of family households - 2-person household (%)
Size of family households - 3-person household (%)
Size of family households - 4-person household (%)
Size of family households - 5-person household (%)
Size of family households - 6-person household (%)
Size of family households - 7-or-more-person household (%)
Size of nonfamily households - 1-person household (%)
Size of nonfamily households - 2-person household (%)
Size of nonfamily households - 3-person household (%)
Size of nonfamily households - 4-person household (%)
Size of nonfamily households - 5-person household (%)
Size of nonfamily households - 6-person household (%)
Size of nonfamily households - 7-or-moreperson household (%)
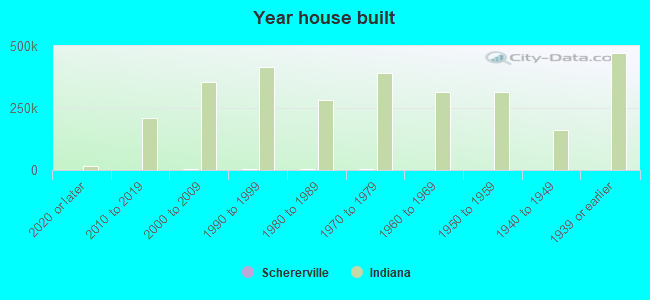
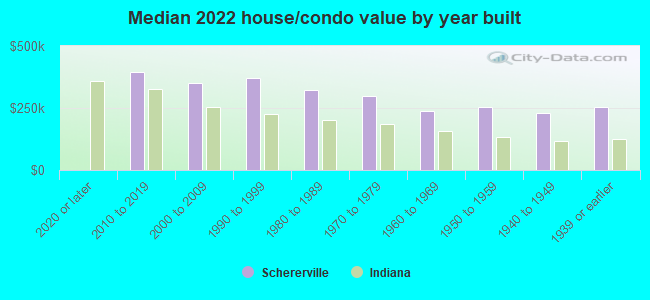
Year house built - Built 2010 or later (%)
Year house built - Built 2000 to 2009 (%)
Year house built - Built 1990 to 1999 (%)
Year house built - Built 1980 to 1989 (%)
Year house built - Built 1970 to 1979 (%)
Year house built - Built 1960 to 1969 (%)
Year house built - Built 1950 to 1959 (%)
Year house built - Built 1940 to 1949 (%)
Year house built - Built 1939 or earlier (%)
Median number of rooms in houses and condos
Median number of rooms in apartments
Median number of bedrooms in owner occupied houses
Mean number of bedrooms in owner occupied houses
Median number of bedrooms in renter occupied houses
Mean number of bedrooms in renter occupied houses
Median number of vehichles in owner occupied houses
Mean number of vehichles in owner occupied houses
Median number of vehichles in renter occupied houses
Mean number of vehichles in renter occupied houses
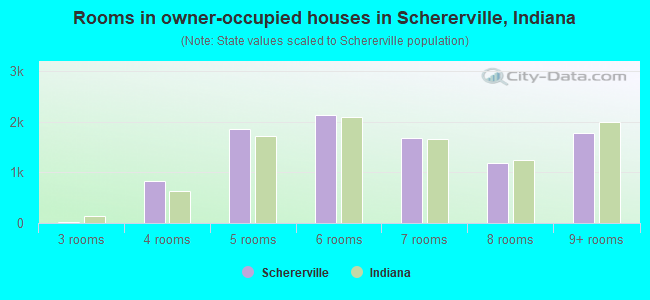
Rooms in owner-occupied houses - 1 room (%)
Rooms in owner-occupied houses - 2 rooms (%)
Rooms in owner-occupied houses - 3 rooms (%)
Rooms in owner-occupied houses - 4 rooms (%)
Rooms in owner-occupied houses - 5 rooms (%)
Rooms in owner-occupied houses - 6 rooms (%)
Rooms in owner-occupied houses - 7 rooms (%)
Rooms in owner-occupied houses - 8 rooms (%)
Rooms in owner-occupied houses - 9+ rooms (%)
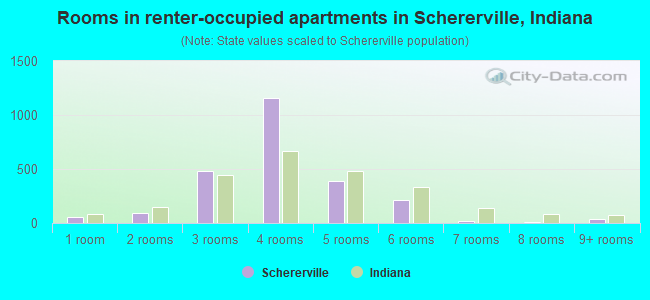
Rooms in renter-occupied houses - 1 room (%)
Rooms in renter-occupied houses - 2 rooms (%)
Rooms in renter-occupied houses - 3 rooms (%)
Rooms in renter-occupied houses - 4 rooms (%)
Rooms in renter-occupied houses - 5 rooms (%)
Rooms in renter-occupied houses - 6 rooms (%)
Rooms in renter-occupied houses - 7 rooms (%)
Rooms in renter-occupied houses - 8 rooms (%)
Rooms in renter-occupied houses - 9+ rooms (%)
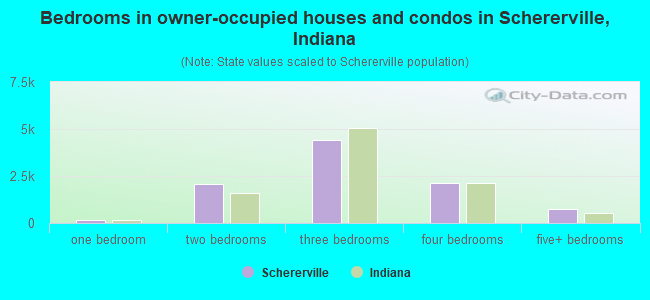
Bedrooms in owner-occupied houses - no bedrooms (%)
Bedrooms in owner-occupied houses - 1 bedroom (%)
Bedrooms in owner-occupied houses - 2 bedrooms (%)
Bedrooms in owner-occupied houses - 3 bedrooms (%)
Bedrooms in owner-occupied houses - 4 bedrooms (%)
Bedrooms in owner-occupied houses - 5+ bedrooms (%)
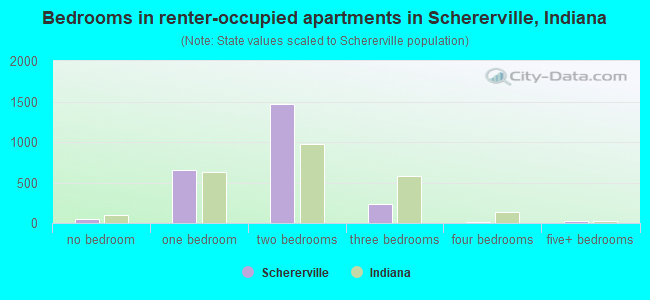
Bedrooms in renter-occupied houses - no bedrooms (%)
Bedrooms in renter-occupied houses - 1 bedroom (%)
Bedrooms in renter-occupied houses - 2 bedrooms (%)
Bedrooms in renter-occupied houses - 3 bedrooms (%)
Bedrooms in renter-occupied houses - 4 bedrooms (%)
Bedrooms in renter-occupied houses - 5+ bedrooms (%)
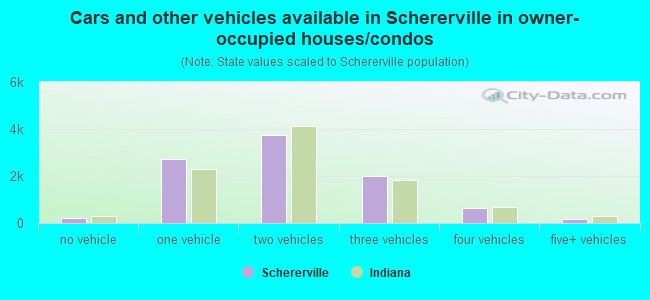
Vehicles available in owner-occupied houses - no vehicle available (%)
Vehicles available in owner-occupied houses - 1 vehicle available(%)
Vehicles available in owner-occupied houses - 2 Vehicles available (%)
Vehicles available in owner-occupied houses - 3 Vehicles available (%)
Vehicles available in owner-occupied houses - 4 Vehicles available (%)
Vehicles available in owner-occupied houses - 5+ Vehicles available (%)
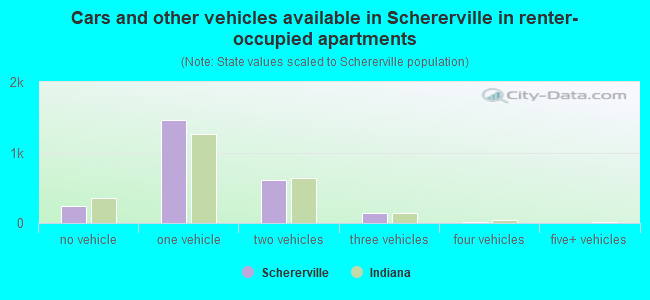
Vehicles available in renter-occupied houses - no vehicle available (%)
Vehicles available in renter-occupied houses - 1 vehicle available (%)
Vehicles available in renter-occupied houses - 2 Vehicles available (%)
Vehicles available in renter-occupied houses - 3 Vehicles available (%)
Vehicles available in renter-occupied houses - 4 Vehicles available (%)
Vehicles available in renter-occupied houses - 5+ Vehicles available (%)
Housing units in structures - 1, detached (%)
Housing units in structures - 1, attached (%)
Housing units in structures - 2 (%)
Housing units in structures - 3 or 4 (%)
Housing units in structures - 5 to 9 (%)
Housing units in structures - 10 to 19 (%)
Housing units in structures - 20 to 49 (%)
Housing units in structures - 50 or more (%)
Housing units in structures - Mobile home (%)
Housing units in structures - Boat, RV, van, etc. (%)
Housing units in structures - Owners - 1, detached (%)
Housing units in structures - Owners - 1, attached (%)
Housing units in structures - Owners - 2 (%)
Housing units in structures - Owners - 3 or 4 (%)
Housing units in structures - Owners - 5 to 9 (%)
Housing units in structures - Owners - 10 to 19 (%)
Housing units in structures - Owners - 20 to 49 (%)
Housing units in structures - Owners - 50 or more (%)
Housing units in structures - Owners - Mobile home (%)
Housing units in structures - Owners - Boat, RV, van, etc. (%)
Housing units in structures - Renters - 1, detached (%)
Housing units in structures - Renters - 1, attached (%)
Housing units in structures - Renters - 2 (%)
Housing units in structures - Renters - 3 or 4 (%)
Housing units in structures - Renters - 5 to 9 (%)
Housing units in structures - Renters - 10 to 19 (%)
Housing units in structures - Renters - 20 to 49 (%)
Housing units in structures - Renters - 50 or more (%)
Housing units in structures - Renters - Mobile home (%)
Housing units in structures - Renters - Boat, RV, van, etc. (%)
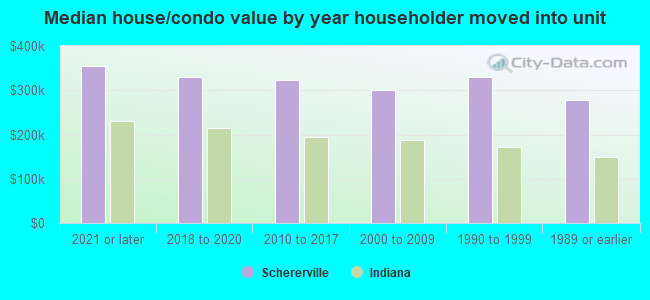
House/condo owner moved in on average (years ago)
Renter moved in on average (years ago)
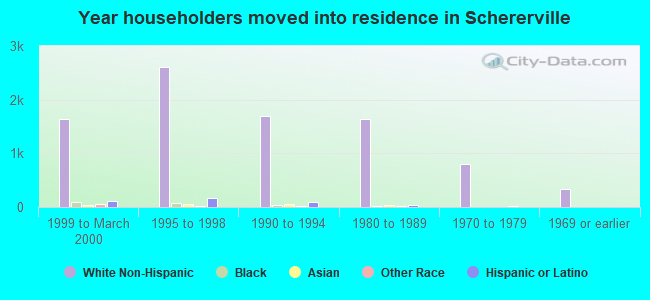
Year householder moved into unit - Moved in 1999 to March 2000 (%)
Year householder moved into unit - Moved in 1999 to March 2000 (%) - White
Year householder moved into unit - Moved in 1999 to March 2000 (%) - Black or African American
Year householder moved into unit - Moved in 1999 to March 2000 (%) - Asian
Year householder moved into unit - Moved in 1999 to March 2000 (%) - Hispanic or Latino
Year householder moved into unit - Moved in 1999 to March 2000 (%) - American Indian and Alaska Native
Year householder moved into unit - Moved in 1999 to March 2000 (%) - Multirace
Year householder moved into unit - Moved in 1999 to March 2000 (%) - Other Race
Year householder moved into unit - Moved in 1995 to 1998 (%)
Year householder moved into unit - Moved in 1995 to 1998 (%) - White
Year householder moved into unit - Moved in 1995 to 1998 (%) - Black or African American
Year householder moved into unit - Moved in 1995 to 1998 (%) - Asian
Year householder moved into unit - Moved in 1995 to 1998 (%) - Hispanic or Latino
Year householder moved into unit - Moved in 1995 to 1998 (%) - American Indian and Alaska Native
Year householder moved into unit - Moved in 1995 to 1998 (%) - Multirace
Year householder moved into unit - Moved in 1995 to 1998 (%) - Other Race
Year householder moved into unit - Moved in 1990 to 1994 (%)
Year householder moved into unit - Moved in 1990 to 1994 (%) - White
Year householder moved into unit - Moved in 1990 to 1994 (%) - Black or African American
Year householder moved into unit - Moved in 1990 to 1994 (%) - Asian
Year householder moved into unit - Moved in 1990 to 1994 (%) - Hispanic or Latino
Year householder moved into unit - Moved in 1990 to 1994 (%) - American Indian and Alaska Native
Year householder moved into unit - Moved in 1990 to 1994 (%) - Multirace
Year householder moved into unit - Moved in 1990 to 1994 (%) - Other Race
Year householder moved into unit - Moved in 1980 to 1989 (%)
Year householder moved into unit - Moved in 1980 to 1989 (%) - White
Year householder moved into unit - Moved in 1980 to 1989 (%) - Black or African American
Year householder moved into unit - Moved in 1980 to 1989 (%) - Asian
Year householder moved into unit - Moved in 1980 to 1989 (%) - Hispanic or Latino
Year householder moved into unit - Moved in 1980 to 1989 (%) - American Indian and Alaska Native
Year householder moved into unit - Moved in 1980 to 1989 (%) - Multirace
Year householder moved into unit - Moved in 1980 to 1989 (%) - Other Race
Year householder moved into unit - Moved in 1970 to 1979 (%)
Year householder moved into unit - Moved in 1970 to 1979 (%) - White
Year householder moved into unit - Moved in 1970 to 1979 (%) - Black or African American
Year householder moved into unit - Moved in 1970 to 1979 (%) - Asian
Year householder moved into unit - Moved in 1970 to 1979 (%) - Hispanic or Latino
Year householder moved into unit - Moved in 1970 to 1979 (%) - American Indian and Alaska Native
Year householder moved into unit - Moved in 1970 to 1979 (%) - Multirace
Year householder moved into unit - Moved in 1970 to 1979 (%) - Other Race
Year householder moved into unit - Moved in 1969 or earlier (%)
Year householder moved into unit - Moved in 1969 or earlier (%) - White
Year householder moved into unit - Moved in 1969 or earlier (%) - Black or African American
Year householder moved into unit - Moved in 1969 or earlier (%) - Asian
Year householder moved into unit - Moved in 1969 or earlier (%) - Hispanic or Latino
Year householder moved into unit - Moved in 1969 or earlier (%) - American Indian and Alaska Native
Year householder moved into unit - Moved in 1969 or earlier (%) - Multirace
Year householder moved into unit - Moved in 1969 or earlier (%) - Other Race
Housing units lacking complete plumbing facilities (%)
Housing units lacking complete kitchen facilities (%)
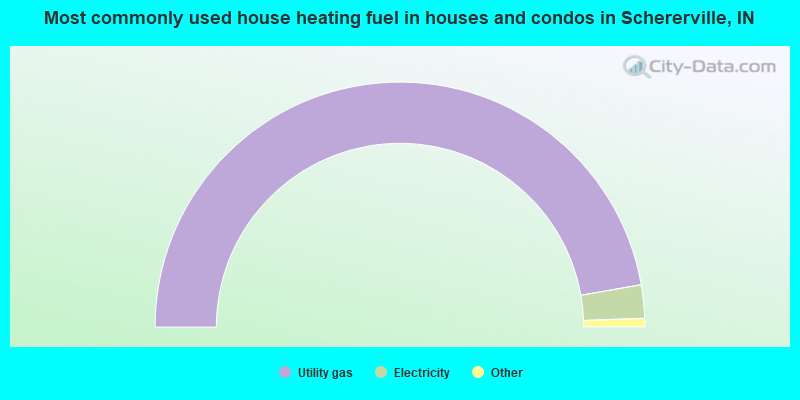
House heating fuel used in houses and condos - Utility gas (%)
House heating fuel used in houses and condos - Bottled, tank, or LP gas (%)
House heating fuel used in houses and condos - Electricity (%)
House heating fuel used in houses and condos - Fuel oil, kerosene, etc. (%)
House heating fuel used in houses and condos - Coal or coke (%)
House heating fuel used in houses and condos - Wood (%)
House heating fuel used in houses and condos - Solar energy (%)
House heating fuel used in houses and condos - Other fuel (%)
House heating fuel used in houses and condos - No fuel used (%)
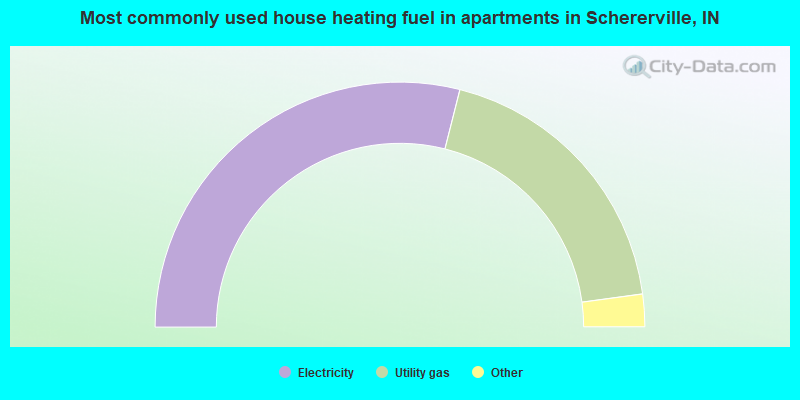
House heating fuel used in apartments - Utility gas (%)
House heating fuel used in apartments - Bottled, tank, or LP gas (%)
House heating fuel used in apartments - Electricity (%)
House heating fuel used in apartments - Fuel oil, kerosene, etc. (%)
House heating fuel used in apartments - Coal or coke (%)
House heating fuel used in apartments - Wood (%)
House heating fuel used in apartments - Solar energy (%)
House heating fuel used in apartments - Other fuel (%)
House heating fuel used in apartments - No fuel used (%)
Latest news about housing in Schererville, IN collected exclusively by city-data.com from local newspapers, TV, and radio stations
Median year house/condo built: 1991Median year apartment built: 1975Household type by relationship:
Households: 29,692
Male householders: 5,998 (1,333 living alone ), Female householders: 5,878 (2,068 living alone )5,858 spouses (5,811 opposite-sex spouses ), 819 unmarried partners , (819 opposite-sex unmarried partners ), 8,833 children (8,281 natural , 237 adopted , 314 stepchildren ), 707 grandchildren , 403 brothers or sisters , 449 parents , 0 foster children , 275 other relatives , 406 non-relatives In group quarters: 61
Size of family households: 3,583 2-persons , 1,963 3-persons , 1,938 4-persons , 449 5-persons , 129 6-persons , 47 7-or-more-persons .
Size of nonfamily households: 3,486 1-person , 294 2-persons , 66 3-persons , 17 5-persons .
4,191 married couples with children. single-parent households (359 men , 845 women ).
81.1% of residents of Schererville speak English at home. of residents speak Spanish at home (83% speak English very well , 5% speak English well , 9% speak English not well , 3% don't speak English at all ).of residents speak other Indo-European language at home (64% speak English very well , 32% speak English well , 3% speak English not well , 1% don't speak English at all ).of residents speak Asian or Pacific Island language at home (32% speak English very well , 19% speak English well , 25% speak English not well , 25% don't speak English at all ).of residents speak other language at home (91% speak English very well , 5% speak English well , 4% speak English not well ).
Foreign born population: 3,267 (11.0%)of them are naturalized citizens )
Median number of rooms in houses and condos:
Median number of rooms in apartments
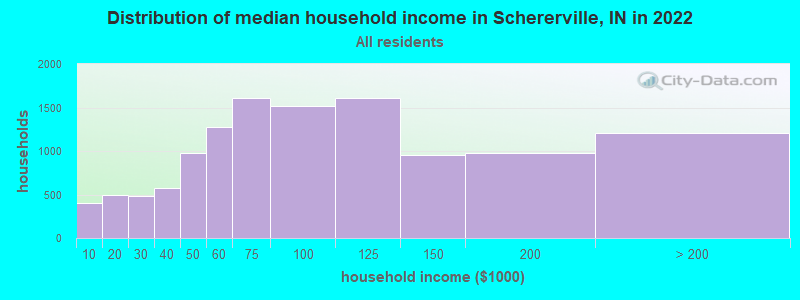
Schererville, IN household income distribution 402 Less than $10,000493 $10,000 to $19,999488 $20,000 to $29,999573 $30,000 to $39,999979 $40,000 to $49,9991,281 $50,000 to $59,9991,611 $60,000 to $74,9991,513 $75,000 to $99,9991,604 $100,000 to $124,999951 $125,000 to $149,999974 $150,000 to $199,9991,211 $200,000 or more
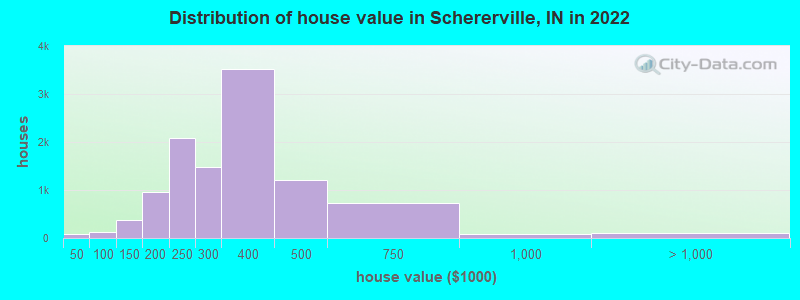
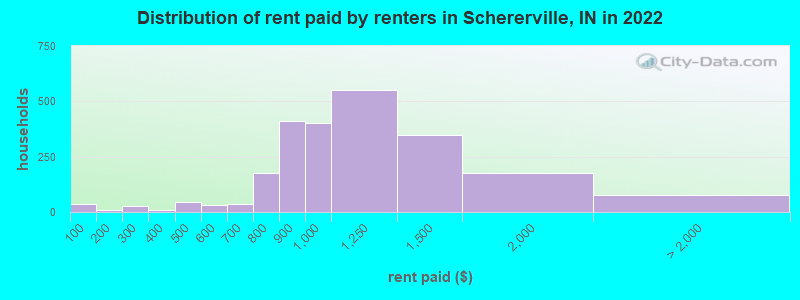
Home value of owner - occupied houses in 2022 in Schererville, IN 33 Less than $10,00028 $20,000 to $24,99910 $35,000 to $39,99933 $50,000 to $59,99913 $70,000 to $79,99940 $80,000 to $89,99937 $90,000 to $99,999114 $100,000 to $124,999268 $125,000 to $149,999381 $150,000 to $174,999583 $175,000 to $199,9992,084 $200,000 to $249,9991,481 $250,000 to $299,9993,510 $300,000 to $399,9991,213 $400,000 to $499,999725 $500,000 to $749,99982 $750,000 to $999,99959 $1,000,000 to $1,499,9993 $1,500,000 to $1,999,99938 $2,000,000 or moreRent paid by renters in 2022 in Schererville, IN 35 Less than $10011 $150 to $19927 $200 to $2497 $300 to $3490 $350 to $39942 $450 to $4996 $500 to $54925 $550 to $59937 $650 to $699117 $700 to $74960 $750 to $799410 $800 to $899404 $900 to $999550 $1,000 to $1,249348 $1,250 to $1,499176 $1,500 to $1,99911 $2,000 to $2,4998 $3,500 or more57 No cash rent
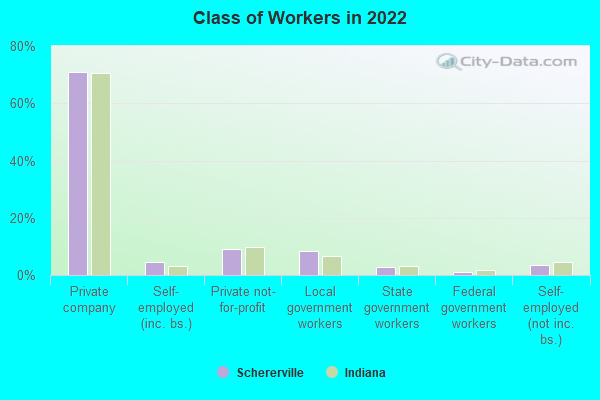
Percentage of workers working in this county: 70.7%Number of people working at home: 1,922 (12.7% of all workers )
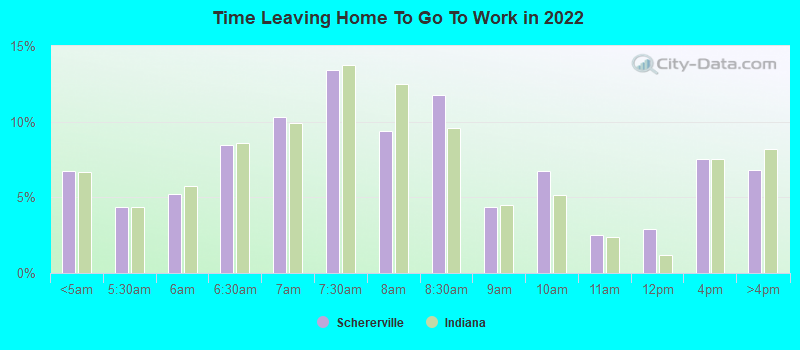
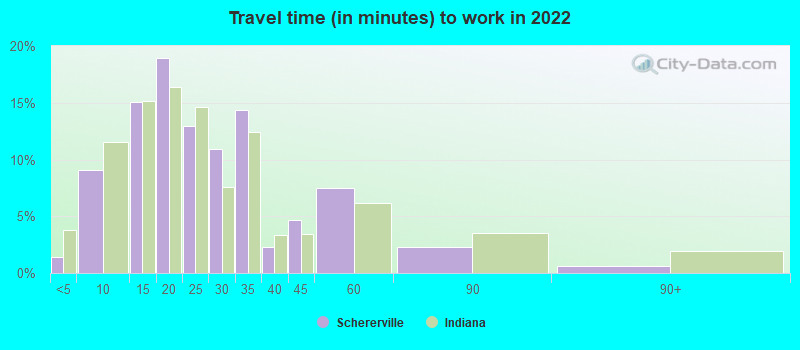
Travel time to work (commute)
Less than 5 minutes: 3105 to 9 minutes: 86510 to 14 minutes: 1,28515 to 19 minutes: 1,66320 to 24 minutes: 2,24425 to 29 minutes: 1,08130 to 34 minutes: 1,68435 to 39 minutes: 46040 to 44 minutes: 67445 to 59 minutes: 1,30860 to 89 minutes: 1,31290 or more minutes: 436
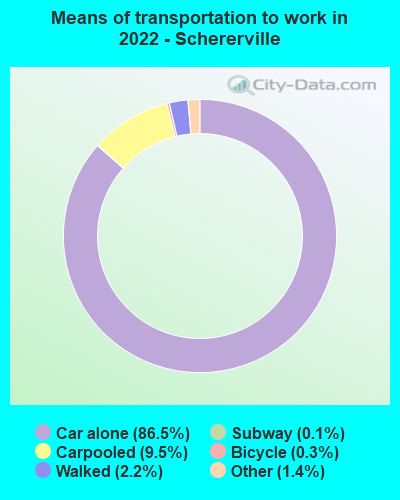
Means of transportation to work:
Drove a car alone: 9,754 (73.9%)Carpooled: 1,272 (9.6%)Long-distance train or commuter rail : 12 (0.1%)Taxi: 152 (1.2%)Bicycle: 79 (0.6%)Walked: 257 (1.9%)Worked at home: 1,922 (14.6%)
Unemployment by race in 2022
Unemployment rate for White non-Hispanic residents 1.8% Males1.2% FemalesUnemployment rate for Black residents 1.4% Males4.7% FemalesUnemployment rate for other race residents 4.0% MalesUnemployment rate for two or more race residents 13.8% Males32.8% FemalesUnemployment rate for Hispanic or Latino residents 5.8% Males3.1% Females
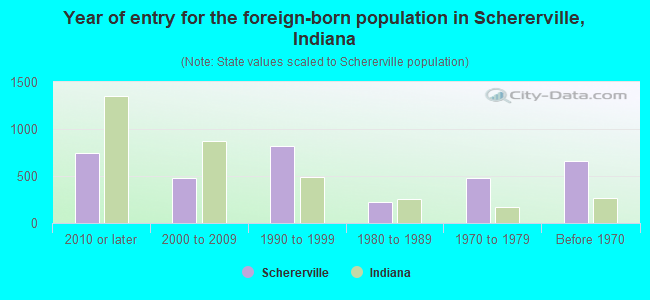
Year of entry for the foreign-born population in Schererville, Indiana
747 2010 or later 479 2000 to 2009 821 1990 to 1999 228 1980 to 1989 480 1970 to 1979 660 Before 1970
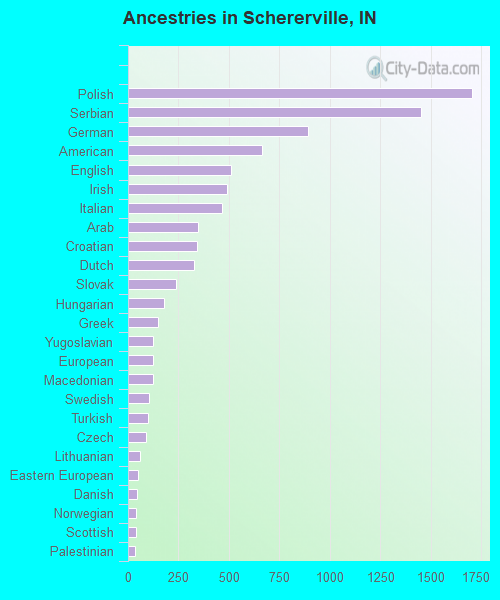
First ancestries reported:
Polish: 1,703 (12.4%)
Serbian: 1,451 (10.6%)
German: 890 (6.5%)
American: 662 (4.8%)
English: 509 (3.7%)
Irish: 488 (3.6%)
Italian: 467 (3.4%)
Arab: 345 (2.5%)
Croatian: 341 (2.5%)
Dutch: 329 (2.4%)
Slovak: 237 (1.7%)
Hungarian: 180 (1.3%)
Greek: 147 (1.1%)
Yugoslavian: 126 (0.9%)
European: 123 (0.9%)
Macedonian: 122 (0.9%)
Swedish: 105 (0.8%)
Turkish: 97 (0.7%)
Czech: 87 (0.6%)
Lithuanian: 57 (0.4%)
Eastern European: 48 (0.4%)
Danish: 44 (0.3%)
Norwegian: 41 (0.3%)
Scottish: 40 (0.3%)
Palestinian: 36 (0.3%)
Jordanian: 32 (0.2%)
French: 32 (0.2%)
Ukrainian: 29 (0.2%)
Scandinavian: 23 (0.2%)
Nigerian: 22 (0.2%)
British: 11 (0.08%)
Romanian: 10 (0.07%)
Russian: 10 (0.07%)
African: 9 (0.07%)
Czechoslovakian: 7 (0.05%)
French Canadian: 6 (0.04%)
Welsh: 6 (0.04%)
Bulgarian: 5 (0.04%)
Assyrian: 3 (0.02%)
Canadian: 2 (0.01%) Most common places of birth for foreign-born residents (%): Mexico Schererville:
12.4% (417)Indiana:
27.0% (101,996)
Croatia Schererville:
10.1% (342)Indiana:
0.3% (968)
Vietnam Schererville:
8.2% (276)Indiana:
1.8% (6,645)
Philippines Schererville:
7.4% (248)Indiana:
3.1% (11,851)
Serbia Schererville:
6.6% (223)Indiana:
0.3% (978)
Other Eastern Europe Schererville:
6.1% (206)Indiana:
0.3% (1,096)
India Schererville:
4.5% (151)Indiana:
8.5% (32,127)
Poland Schererville:
4.3% (145)Indiana:
0.8% (2,959)
Canada Schererville:
4.3% (145)Indiana:
2.1% (7,834)
North Macedonia (Macedonia) Schererville:
3.8% (127)Indiana:
0.3% (1,056)
Kuwait Schererville:
3.6% (120)Indiana:
0.2% (614)
Germany Schererville:
3.1% (105)Indiana:
1.7% (6,439)
Korea Schererville:
2.6% (86)Indiana:
2.0% (7,653)
Syria Schererville:
2.1% (71)Indiana:
0.3% (975)
Place of birth for U.S.-born residents:
This state: 13,506Other state: 12,779Northeast: 861Midwest: 10,757South: 1,063West: 277 94.9% of Schererville residents lived in the same house 1 years ago.
Out of people who lived in different houses, 41.9% lived in this county.
Out of people who lived in different counties, 7.5% lived in Indiana.
Schererville:
94.9%State average:
87.1%
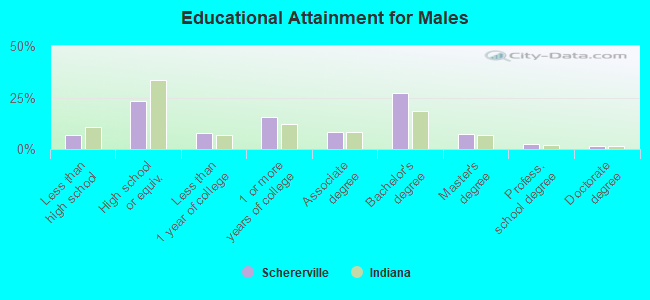
Education attainment for males 25 years and older:
No schooling: 182Nursery to 4th grade: 05th and 6th grade: 1387th and 8th grade: 429th grade: 1010th grade: 311th grade: 2512th grade, no diploma: 316High school graduate (or equivalency): 2,539Less than 1 year of college: 865Some college more than 1 year, no degree: 1,659Associate degree: 910Bachelor's degree: 2,953Master's degree: 771Professional school degree: 246Doctorate degree: 152
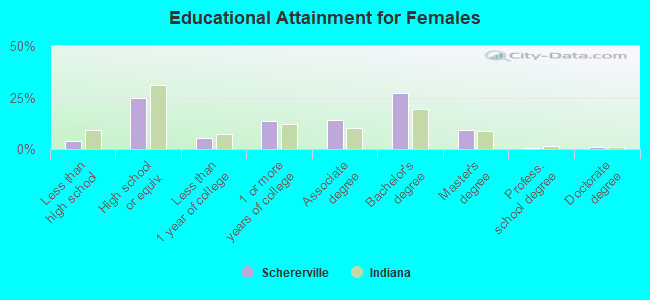
Education attainment for females 25 years and older:
No schooling: 102Nursery to 4th grade: 325th and 6th grade: 807th and 8th grade: 359th grade: 5510th grade: 3811th grade: 7612th grade, no diploma: 49High school graduate (or equivalency): 2,828Less than 1 year of college: 624Some college more than 1 year, no degree: 1,542Associate degree: 1,581Bachelor's degree: 3,101Master's degree: 1,061Professional school degree: 77Doctorate degree: 99
Housing units in structures:
One, detached: 7,272One, attached: 2,496Two: 1533 or 4: 7755 to 9: 34910 to 19: 99220 to 49: 27450 or more: 117Mobile homes: 20Housing units lacking complete plumbing facilities in 2022: 0.8%Housing units lacking complete kitchen facilities in 2022: 1.7%House/condo owner moved in on average 13 years ago
Renter moved in on average 1 years ago
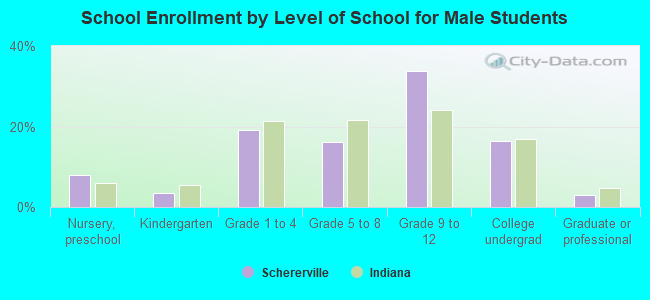
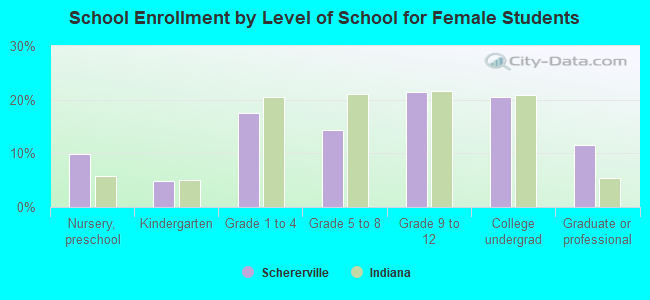
Private vs. public school enrollment:
Students in private schools in grades 1 to 8 (elementary and middle school): 266 Students in private schools in grades 9 to 12 (high school): 271 Students in private undergraduate colleges: 255