Scituate, MA (Massachusetts) Houses and Residents
| Scituate: | $742,843 |
| Massachusetts: | $534,700 |
Mean price in 2022:
Detached houses: $745,899
Here: $745,899 State: $651,570 Townhouses or other attached units: $899,866
Here: $899,866 State: $617,749 In 5-or-more-unit structures: $600,595
Here: $600,595 State: $555,768
Total population: 5,245 (Urban population: 5,101, Rural population: 0)
Houses: 2,592 (2,522 occupied: 2,128 owner occupied, 431 renter occupied)
| % of renters here: | 17% |
| State: | 38% |
Housing density: 633 houses/condos per square mile
Median price asked for vacant for-sale houses and condos in 2022 in this county: $446,078.
Median contract rent in 2022: $828
Median gross rent in Scituate, MA in 2022: $916
Housing units in Scituate with a mortgage: 1,293 (234 second mortgage, 7 home equity loan, 238 both second mortgage and home equity loan)
Houses without a mortgage: 59
Median household income for houses/condos with a mortgage: $136,259
Median household income for apartments without a mortgage: $90,604
Median monthly housing costs: $2,041
Compare current foreclosures near Scituate, MA:
| Photo | Address | Area | Beds / Baths | Price | Details |
|---|---|---|---|---|---|

|
#1
New Kent St
Scituate, MA 02066
|
1,488 sq. feet
|
2 baths 2 beds |
show details | |

|
#2
Indian Wind Dr
Scituate, MA 02066
|
2,494 sq. feet
|
2 baths 4 beds |
show details | |

|
#3
Murphys Ln
Scituate, MA 02066
|
2,163 sq. feet
|
2 baths 4 beds |
show details | |

|
#4
Kathys Path
Scituate, MA 02066
|
2,408 sq. feet
|
2 baths 4 beds |
show details | |

|
#5
Turner Rd
Scituate, MA 02066
|
- sq. feet
|
- baths - beds |
show details | |

|
#6
Chief Justice Cushing Hwy
Scituate, MA 02066
|
- sq. feet
|
- baths - beds |
show details | |

|
#7
Heritage Ln
Duxbury, MA 02332
|
5,508 sq. feet
|
1 baths 5 beds |
$759,900
|
show details |

|
#8
Prospect St
Norwell, MA 02061
|
5,483 sq. feet
|
5 baths 5 beds |
$1,760,000
|
show details |

|
#9
Tall Oaks Dr Unit 508
South Weymouth, MA 02190
|
1,300 sq. feet
|
2 baths 2 beds |
$285,000
|
show details |

|
#10
Johnson Rd
North Weymouth, MA 02191
|
748 sq. feet
|
1 baths 2 beds |
$365,000
|
show details |
| Photo | Address | Area | Beds / Baths | Price | Details |
|---|---|---|---|---|---|

|
#11
Bittersweet Ln
Randolph, MA 02368
|
882 sq. feet
|
1 baths 2 beds |
show details | |

|
#12
Kendrick Ave Apt 307
Quincy, MA 02169
|
1,234 sq. feet
|
2 baths 2 beds |
show details | |

|
#13
Cappys Way
Brockton, MA 02302
|
2,128 sq. feet
|
2 baths 4 beds |
show details | |

|
#14
Tamarack Ln
Abington, MA 02351
|
1,495 sq. feet
|
2 baths 2 beds |
show details | |

|
#15
S Franklin St
Holbrook, MA 02343
|
940 sq. feet
|
2 baths 2 beds |
show details | |

|
#16
Rockwell Ave
Brockton, MA 02302
|
1,774 sq. feet
|
1 baths 3 beds |
show details | |

|
#17
Littlefield St
Quincy, MA 02169
|
1,274 sq. feet
|
1 baths 4 beds |
show details | |

|
#18
Ballou St
Quincy, MA 02169
|
1,758 sq. feet
|
1 baths 3 beds |
show details | |

|
#19
Rockland St
Abington, MA 02351
|
1,700 sq. feet
|
1 baths 4 beds |
show details | |

|
#20
2nd St
Hull, MA 02045
|
1,624 sq. feet
|
1 baths 4 beds |
show details |
| Photo | Address | Area | Beds / Baths | Price | Details |
|---|---|---|---|---|---|

|
#21
Webster St
Randolph, MA 02368
|
1,080 sq. feet
|
1 baths 3 beds |
show details | |

|
#22
Hubbard Rd
East Bridgewater, MA 02333
|
1,344 sq. feet
|
2 baths 4 beds |
show details | |

|
#23
Great Cedar Dr # 4
Hanson, MA 02341
|
- sq. feet
|
1 baths 2 beds |
show details | |

|
#24
Tremont St
Brockton, MA 02301
|
1,470 sq. feet
|
2 baths 4 beds |
show details | |

|
#25
Emily Jeffers Rd # L
Randolph, MA 02368
|
1,350 sq. feet
|
1 baths 3 beds |
show details | |

|
#26
Palmer Mill Rd
Halifax, MA 02338
|
3,102 sq. feet
|
3 baths 5 beds |
show details | |

|
#27
Guild Rd
Brockton, MA 02302
|
1,210 sq. feet
|
1 baths 3 beds |
show details | |

|
#28
Pond St
Halifax, MA 02338
|
2,208 sq. feet
|
2 baths 3 beds |
show details | |

|
#29
Fay Rd
Brockton, MA 02302
|
1,088 sq. feet
|
1 baths 3 beds |
show details | |

|
#30
Anderson Ave
Kingston, MA 02364
|
1,448 sq. feet
|
1 baths 3 beds |
show details |
| Photo | Address | Area | Beds / Baths | Price | Details |
|---|---|---|---|---|---|

|
#31
Greenfield St # 2
Brockton, MA 02301
|
2,499 sq. feet
|
2 baths 4 beds |
show details | |

|
#32
Clara Rd
Brockton, MA 02302
|
1,172 sq. feet
|
1 baths 2 beds |
show details | |

|
#33
Connell Ave
Brockton, MA 02302
|
1,172 sq. feet
|
1 baths 3 beds |
show details | |

|
#34
Elsie Rd
Brockton, MA 02302
|
1,172 sq. feet
|
1 baths 3 beds |
show details | |

|
#35
Quincy St
Brockton, MA 02302
|
1,299 sq. feet
|
2 baths 2 beds |
show details | |

|
#36
Hovendon Ave
Brockton, MA 02302
|
864 sq. feet
|
1 baths 3 beds |
show details | |

|
#37
Gary Rd
Brockton, MA 02302
|
1,228 sq. feet
|
1 baths 3 beds |
show details | |

|
#38
Lynn Rd
Brockton, MA 02302
|
2,064 sq. feet
|
2 baths 4 beds |
show details | |

|
#39
Jon Dr
Brockton, MA 02302
|
1,248 sq. feet
|
1 baths 3 beds |
show details | |

|
#40
Spring St
Plympton, MA 02367
|
1,700 sq. feet
|
1 baths 4 beds |
show details |
| Photo | Address | Area | Beds / Baths | Price | Details |
|---|---|---|---|---|---|

|
#41
Rhonda Rd
Brockton, MA 02302
|
1,611 sq. feet
|
2 baths 3 beds |
show details | |

|
#42
Oak Hill Rd
Braintree, MA 02184
|
1,630 sq. feet
|
1 baths 3 beds |
show details | |

|
#43
Royal Lake Dr
Braintree, MA 02184
|
1,491 sq. feet
|
2 baths 3 beds |
show details | |

|
#44
Starling Ave
Kingston, MA 02364
|
1,104 sq. feet
|
2 baths 3 beds |
show details | |

|
#45
Lafayette St
Randolph, MA 02368
|
1,936 sq. feet
|
1 baths 3 beds |
show details | |

|
#46
Tamarack Ln # No
Abington, MA 02351
|
1,495 sq. feet
|
2 baths 2 beds |
show details | |

|
#47
Tamarack Ln # 422
Abington, MA 02351
|
1,495 sq. feet
|
2 baths 2 beds |
show details | |

|
#48
Quincy St
Brockton, MA 02302
|
1,776 sq. feet
|
1 baths 3 beds |
show details | |

|
#49
Round Hill Rd
Kingston, MA 02364
|
2,491 sq. feet
|
3 baths 4 beds |
show details | |

|
Check over 1 million property listings on Foreclosure.com!
|
browse all offers | |||

Latest news about housing in Scituate, MA collected exclusively by city-data.com from local newspapers, TV, and radio stations

 | Nicer house in Pembroke or hold out for Norwell scituate duxbury? (72 replies) |
| Post homes in MA that people like (55 replies) |
| How Much Massachusetts Households Make Per Year: Census Data (37 replies) |
| 2023 Real Estate Observations (5278 replies) |
| Norwell, Cohasset, Scituate or Hanover? (26 replies) |
| Fire in Scituate (0 replies) |

Median year apartment built: 1965
Household type by relationship:
Households: 5,478- Male householders: 919 (223 living alone), Female householders: 1,578 (672 living alone)
1,130 spouses (1,130 opposite-sex spouses), 42 unmarried partners, (42 opposite-sex unmarried partners), 1,360 children (1,360 natural, 0 adopted, 0 stepchildren), 119 grandchildren, 69 brothers or sisters, 81 parents, 0 foster children, 36 other relatives, 80 non-relatives
- In group quarters: 59
Size of family households: 757 2-persons, 295 3-persons, 384 4-persons, 103 5-persons, 52 6-persons.
Size of nonfamily households: 857 1-person, 26 2-persons, 50 3-persons.
851 married couples with children.
115 single-parent households (0 men, 115 women).
89.5% of residents of Scituate speak English at home.
11.4% of residents speak other Indo-European language at home (47% speak English very well, 10% speak English well, 43% speak English not well).
0.2% of residents speak Asian or Pacific Island language at home (100% speak English very well).
Foreign born population: 440 (8.0%)
(47.5% of them are naturalized citizens)
| Here: | 7.2 |
| State: | 6.5 |
| Here: | 3.5 |
| State: | 4.0 |

- Bedrooms in owner-occupied houses and condos in Scituate, Massachusetts
- 0no bedroom
- 1151 bedroom
- 3072 bedrooms
- 9783 bedrooms
- 6784 bedrooms
- 515+ bedrooms

- Bedrooms in renter-occupied apartments in Scituate, Massachusetts
- 7no bedroom
- 2431 bedroom
- 1652 bedrooms
- 153 bedrooms
- 04 bedrooms
- 05+ bedrooms

- Cars and other vehicles available in Scituate in owner-occupied houses/condos
- 76no vehicle
- 7231 vehicle
- 1,0262 vehicles
- 2413 vehicles
- 614 vehicles
- 05+ vehicles

- Cars and other vehicles available in Scituate in renter-occupied apartments
- 70no vehicle
- 2061 vehicle
- 1552 vehicles
- 03 vehicles
- 04 vehicles
- 05+ vehicles

- Rooms in owner-occupied houses in Scituate, Massachusetts
- 01 room
- 262 rooms
- 313 rooms
- 1024 rooms
- 3465 rooms
- 2636 rooms
- 5307 rooms
- 3148 rooms
- 5179+ rooms

- Rooms in renter-occupied apartments in Scituate, Massachusetts
- 71 room
- 642 rooms
- 1333 rooms
- 1024 rooms
- 1095 rooms
- 156 rooms
- 07 rooms
- 08 rooms
- 09+ rooms


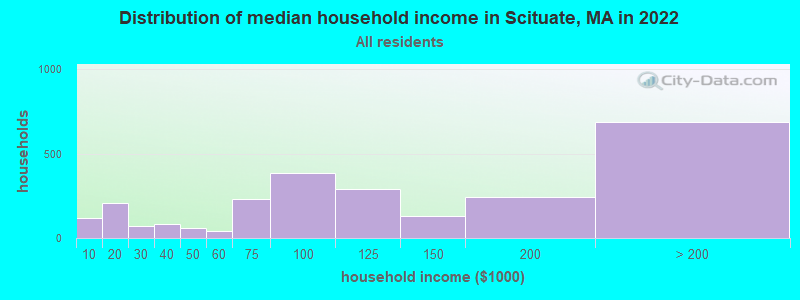
Scituate, MA household income distribution

- 117Less than $10,000
- 205$10,000 to $19,999
- 73$20,000 to $29,999
- 82$30,000 to $39,999
- 57$40,000 to $49,999
- 39$50,000 to $59,999
- 232$60,000 to $74,999
- 387$75,000 to $99,999
- 289$100,000 to $124,999
- 129$125,000 to $149,999
- 241$150,000 to $199,999
- 687$200,000 or more
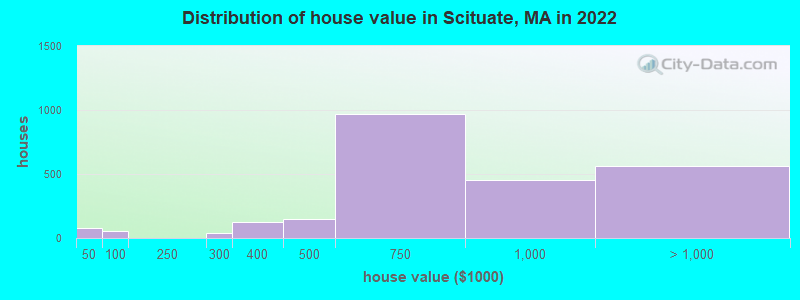
Home value of owner - occupied houses in 2022 in Scituate, MA
-
- 62Less than $10,000
- 14$20,000 to $24,999
- 12$50,000 to $59,999
- 41$80,000 to $89,999
- 39$250,000 to $299,999
- 121$300,000 to $399,999
- 147$400,000 to $499,999
- 971$500,000 to $749,999
- 453$750,000 to $999,999
- 348$1,000,000 to $1,499,999
- 121$1,500,000 to $1,999,999
- 92$2,000,000 or more
Rent paid by renters in 2022 in Scituate, MA
-
- 14$100 to $149
- 17$250 to $299
- 94$300 to $349
- 43$400 to $449
- 21$700 to $749
- 9$750 to $799
- 127$1,000 to $1,249
- 25$1,250 to $1,499
- 63$2,500 to $2,999
- 32$3,500 or more

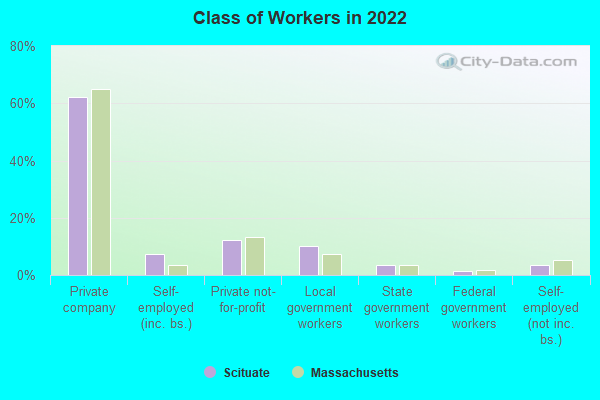
Percentage of workers working in this county: 66.0%
Number of people working at home: 566 (23.1% of all workers)

Travel time to work (commute)
- Less than 5 minutes: 105
- 5 to 9 minutes: 204
- 10 to 14 minutes: 87
- 15 to 19 minutes: 147
- 20 to 24 minutes: 270
- 25 to 29 minutes: 74
- 30 to 34 minutes: 173
- 35 to 39 minutes: 0
- 40 to 44 minutes: 38
- 45 to 59 minutes: 301
- 60 to 89 minutes: 396
- 90 or more minutes: 142
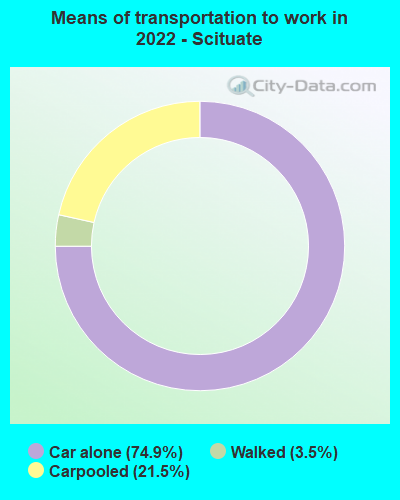
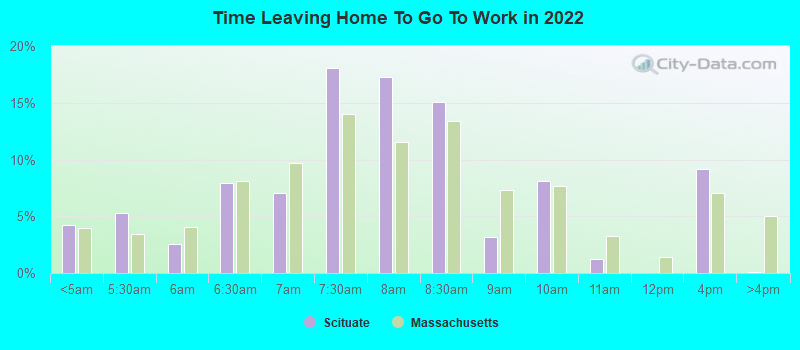
Means of transportation to work:
- Drove a car alone: 1,706 (60.0%)
- Carpooled: 501 (17.6%)
- Walked: 58 (2.0%)
- Worked at home: 566 (19.9%)
- Unemployment by race in 2022
- Unemployment rate for White non-Hispanic residents
- 3.0%Males
- 1.4%Females

- Year of entry for the foreign-born population in Scituate, Massachusetts
- 2322010 or later
- 12000 to 2009
- 01990 to 1999
- 181980 to 1989
- 01970 to 1979
- 110Before 1970

First ancestries reported:
- Irish: 1,150 (46.5%)
- Cape Verdean: 275 (11.1%)
- Italian: 188 (7.6%)
- European: 164 (6.6%)
- English: 100 (4.0%)
- Portuguese: 99 (4.0%)
- German: 75 (3.0%)
- African: 65 (2.6%)
- American: 52 (2.1%)
- Scottish: 51 (2.1%)
- Polish: 49 (2.0%)
- Northern European: 18 (0.7%)
- French Canadian: 16 (0.6%)
- Czech: 15 (0.6%)
- French: 10 (0.4%)
- Scandinavian: 9 (0.4%)
- Swedish: 8 (0.3%)
- Celtic: 6 (0.2%)
- Ukrainian: 1 (0.04%)
Most common places of birth for foreign-born residents (%):
| Scituate: | 78.7% (336) |
| Massachusetts: | 2.6% (32,354) |
| Scituate: | 10.8% (46) |
| Massachusetts: | 2.3% (28,158) |
| Scituate: | 2.8% (12) |
| Massachusetts: | 1.1% (13,446) |
Place of birth for U.S.-born residents:
- This state: 4,087
- Other state: 888
- Northeast: 512
- Midwest: 130
- South: 171
- West: 72
92.8% of Scituate residents lived in the same house 1 years ago.
Out of people who lived in different houses, 23.6% lived in this county.
Out of people who lived in different counties, 55.1% lived in Massachusetts.
| Scituate: | 92.8% |
| State average: | 87.7% |
Education attainment for males 25 years and older:
- No schooling: 0
- Nursery to 4th grade: 0
- 5th and 6th grade: 0
- 7th and 8th grade: 0
- 9th grade: 0
- 10th grade: 0
- 11th grade: 0
- 12th grade, no diploma: 9
- High school graduate (or equivalency): 327
- Less than 1 year of college: 81
- Some college more than 1 year, no degree: 98
- Associate degree: 68
- Bachelor's degree: 587
- Master's degree: 399
- Professional school degree: 123
- Doctorate degree: 18

Education attainment for females 25 years and older:
- No schooling: 46
- Nursery to 4th grade: 0
- 5th and 6th grade: 0
- 7th and 8th grade: 167
- 9th grade: 0
- 10th grade: 6
- 11th grade: 24
- 12th grade, no diploma: 13
- High school graduate (or equivalency): 390
- Less than 1 year of college: 142
- Some college more than 1 year, no degree: 183
- Associate degree: 218
- Bachelor's degree: 642
- Master's degree: 516
- Professional school degree: 132
- Doctorate degree: 22


Housing units in structures:
- One, detached: 1,989
- One, attached: 197
- 3 or 4: 113
- 5 to 9: 31
- 10 to 19: 130
- 20 to 49: 130
House/condo owner moved in on average 11 years ago
Renter moved in on average 3 years ago

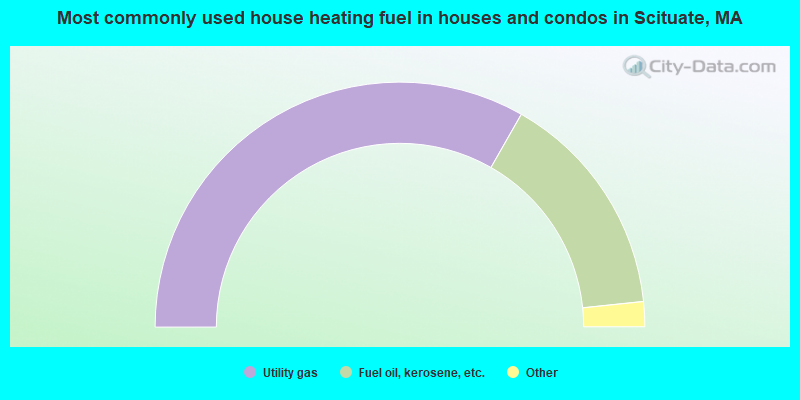
- 66.5%Utility gas
- 30.2%Fuel oil, kerosene, etc.
- 2.5%Bottled, tank, or LP gas
- 0.5%Coal or coke
- 0.3%Electricity
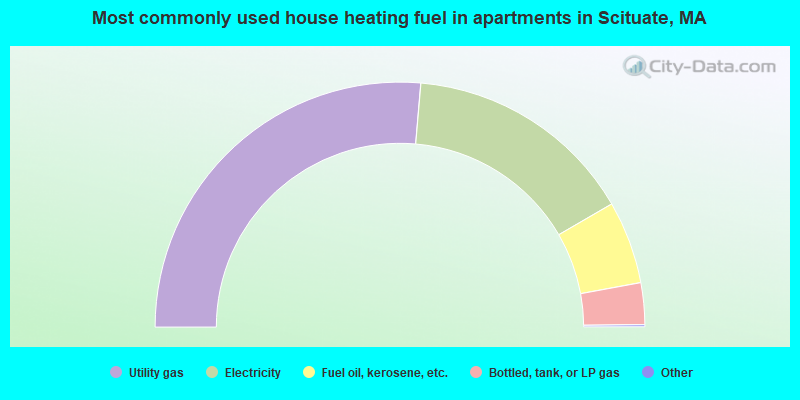
- 52.9%Utility gas
- 30.6%Electricity
- 11.0%Fuel oil, kerosene, etc.
- 5.5%Bottled, tank, or LP gas
Private vs. public school enrollment:
| Here: | 4.9% |
| Massachusetts: | 10.3% |
| Here: | 5.9% |
| Massachusetts: | 12.3% |
| Here: | 48.1% |
| Massachusetts: | 51.2% |


