Sea Bright, NJ (New Jersey) Houses and Residents
| Sea Bright: | $886,359 |
| New Jersey: | $428,900 |
Total population: 1,348 (All urban)
Houses: 1,156 (899 occupied: 630 owner occupied, 285 renter occupied)
| % of renters here: | 31% |
| State: | 35% |
Housing density: 1,810 houses/condos per square mile
Median price asked for vacant for-sale houses and condos in 2022: $976,495.
Median contract rent in 2022: $1,682 (lower quartile is $1,269, upper quartile is over $2,000)
Median rent asked for vacant for-rent units in 2022: $3,054
Median gross rent in Sea Bright, NJ in 2022: $1,786
Housing units in Sea Bright with a mortgage: 335 (20 second mortgage, 0 home equity loan, 20 both second mortgage and home equity loan)
Houses without a mortgage: 0
Median household income for houses/condos with a mortgage: $185,316
Median household income for apartments without a mortgage: $105,597
Median monthly housing costs: $2,057
Compare current foreclosures near Sea Bright, NJ:
| Photo | Address | Area | Beds / Baths | Price | Details |
|---|---|---|---|---|---|

|
#1
Henry St
Keyport, NJ 07735
|
800 sq. feet
|
1 baths 2 beds |
$219,350
|
show details |

|
#2
Warren Street
Keyport, NJ 07735
|
2,889 sq. feet
|
2 baths 7 beds |
$459,900
|
show details |

|
#3
Bay 19th St
Brooklyn, NY 11214
|
880 sq. feet
|
1 baths 2 beds |
$425,000
|
show details |

|
#4
Ocean Pkwy Apt 11k
Brooklyn, NY 11235
|
400 sq. feet
|
1 baths - beds |
$205,000
|
show details |

|
#5
Crawford Street
Red Bank, NJ 07701
|
1,280 sq. feet
|
1 baths 2 beds |
show details | |

|
#6
Shore Pkwy Apt 15a
Brooklyn, NY 11214
|
995 sq. feet
|
1 baths 2 beds |
show details | |

|
#7
-11 Spring St
Red Bank, NJ 07701
|
1,096 sq. feet
|
1 baths 2 beds |
show details | |

|
#8
Jupiter St
Middletown, NJ 07748
|
2,040 sq. feet
|
2 baths 4 beds |
show details | |

|
#9
Johnson Ter
Keansburg, NJ 07734
|
1,382 sq. feet
|
2 baths 3 beds |
show details | |

|
#10
Spring St Apt 10c
Red Bank, NJ 07701
|
1,073 sq. feet
|
1 baths 2 beds |
show details |
| Photo | Address | Area | Beds / Baths | Price | Details |
|---|---|---|---|---|---|

|
#11
Ocean Pkwy Apt 8c
Brooklyn, NY 11235
|
1,186 sq. feet
|
2 baths 2 beds |
show details | |

|
#12
Fairfield Dr
Eatontown, NJ 07724
|
1,448 sq. feet
|
2 baths 3 beds |
show details | |

|
#13
Dover Ct
Asbury Park, NJ 07712
|
1,414 sq. feet
|
3 baths 2 beds |
show details | |

|
#14
Orange Dr
Marlboro, NJ 07746
|
1,800 sq. feet
|
2 baths 2 beds |
show details | |

|
#15
S Laurel Ave
Keansburg, NJ 07734
|
1,152 sq. feet
|
2 baths 2 beds |
show details | |

|
#16
Mansion Ave
Staten Island, NY 10308
|
960 sq. feet
|
1 baths 2 beds |
show details | |

|
#17
Dora Ln
Holmdel, NJ 07733
|
4,783 sq. feet
|
2 baths 4 beds |
show details | |

|
#18
S Laurel Ave
Keansburg, NJ 07734
|
1,228 sq. feet
|
1 baths 2 beds |
show details | |

|
#19
Shoreland Ter
Middletown, NJ 07748
|
2,052 sq. feet
|
3 baths 2 beds |
show details | |

|
#20
6th Ave
Asbury Park, NJ 07712
|
1,908 sq. feet
|
2 baths 6 beds |
show details |
| Photo | Address | Area | Beds / Baths | Price | Details |
|---|---|---|---|---|---|

|
#21
Pegasus Ct
Morganville, NJ 07751
|
3,112 sq. feet
|
2 baths 4 beds |
show details | |

|
#22
Cheyenne Dr
Morganville, NJ 07751
|
3,023 sq. feet
|
2 baths 4 beds |
show details | |

|
#23
Brown Ave
Hazlet, NJ 07730
|
752 sq. feet
|
1 baths 3 beds |
show details | |

|
#24
Stuart St
Brooklyn, NY 11229
|
1,563 sq. feet
|
2 baths 4 beds |
show details | |

|
#25
Gabriele Ct
Staten Island, NY 10312
|
2,100 sq. feet
|
3 baths 3 beds |
show details | |

|
#26
Cheyenne St
Asbury Park, NJ 07712
|
1,840 sq. feet
|
2 baths 3 beds |
show details | |

|
#27
5th St
Keansburg, NJ 07734
|
1,877 sq. feet
|
2 baths 4 beds |
show details | |

|
#28
1st Ave
Asbury Park, NJ 07712
|
1,318 sq. feet
|
1 baths 2 beds |
show details | |

|
#29
Asbury Ave
Asbury Park, NJ 07712
|
1,284 sq. feet
|
2 baths 3 beds |
show details | |

|
#30
Main St
Belford, NJ 07718
|
2,393 sq. feet
|
3 baths 4 beds |
show details |
| Photo | Address | Area | Beds / Baths | Price | Details |
|---|---|---|---|---|---|

|
#31
Dudley St
Long Branch, NJ 07740
|
1,668 sq. feet
|
1 baths 3 beds |
show details | |

|
#32
Monmouth Ave Apt B3
Spring Lake, NJ 07762
|
1,108 sq. feet
|
2 baths 2 beds |
show details | |

|
#33
Fairway Ave
West Long Branch, NJ 07764
|
2,075 sq. feet
|
1 baths 3 beds |
show details | |

|
#34
Christy Ln
Asbury Park, NJ 07712
|
2,405 sq. feet
|
3 baths 4 beds |
show details | |

|
#35
Shoreland Ter
Middletown, NJ 07748
|
2,504 sq. feet
|
1 baths 3 beds |
show details | |

|
#36
Alameda Ct
Shrewsbury, NJ 07702
|
1,056 sq. feet
|
1 baths 2 beds |
show details | |

|
#37
Squankum Rd
Eatontown, NJ 07724
|
2,682 sq. feet
|
2 baths 4 beds |
show details | |

|
#38
Weehawken Ave
Middletown, NJ 07748
|
1,880 sq. feet
|
2 baths 3 beds |
show details | |

|
#39
Sunset Pl
Middletown, NJ 07748
|
1,535 sq. feet
|
2 baths 3 beds |
show details | |

|
#40
Port Monmouth Rd
Middletown, NJ 07748
|
745 sq. feet
|
2 baths 2 beds |
show details |
| Photo | Address | Area | Beds / Baths | Price | Details |
|---|---|---|---|---|---|

|
#41
Sycamore Ave
Middletown, NJ 07748
|
1,296 sq. feet
|
2 baths 3 beds |
show details | |

|
#42
Drs James Parker Blvd
Red Bank, NJ 07701
|
1,032 sq. feet
|
1 baths 2 beds |
show details | |

|
#43
Crine Rd
Morganville, NJ 07751
|
3,058 sq. feet
|
3 baths 5 beds |
show details | |

|
#44
Richmond Rd
Staten Island, NY 10306
|
3,960 sq. feet
|
2 baths 4 beds |
show details | |

|
#45
Bruns Rd
Allenhurst, NJ 07711
|
4,112 sq. feet
|
3 baths 4 beds |
show details | |

|
#46
Logan Rd
Asbury Park, NJ 07712
|
2,100 sq. feet
|
2 baths 5 beds |
show details | |

|
#47
Oxford Ln
Belmar, NJ 07719
|
3,209 sq. feet
|
1 baths 4 beds |
show details | |

|
#48
Maurice Ave
Holmdel, NJ 07733
|
1,296 sq. feet
|
2 baths 3 beds |
show details | |

|
#49
Shore Blvd
Keansburg, NJ 07734
|
1,164 sq. feet
|
1 baths 3 beds |
show details | |

|
Check over 1 million property listings on Foreclosure.com!
|
browse all offers | |||


Median year apartment built: 1976
Household type by relationship:
Households: 1,631- Male householders: 489 (205 living alone), Female householders: 406 (181 living alone)
262 spouses (262 opposite-sex spouses), 159 unmarried partners, (159 opposite-sex unmarried partners), 201 children (193 natural, 8 adopted, 0 stepchildren), 0 grandchildren, 13 brothers or sisters, 9 parents, 0 foster children, 0 other relatives, 90 non-relatives
Size of family households: 184 2-persons, 42 3-persons, 54 4-persons, 23 5-persons.
Size of nonfamily households: 385 1-person, 212 2-persons, 6 3-persons.
144 married couples with children.
7 single-parent households (7 men, 0 women).
95.3% of residents of Sea Bright speak English at home.
2.6% of residents speak Spanish at home (36% speak English very well, 24% speak English well, 40% speak English not well).
1.4% of residents speak other Indo-European language at home (100% speak English very well).
0.4% of residents speak Asian or Pacific Island language at home (100% speak English very well).
0.4% of residents speak other language at home (100% speak English very well).
Foreign born population: 77 (4.7%)
(71.4% of them are naturalized citizens)
| Here: | 5.3 |
| State: | 6.8 |
| Here: | 4.3 |
| State: | 3.9 |

- Bedrooms in owner-occupied houses and condos in Sea Bright, New Jersey
- 0no bedroom
- 1161 bedroom
- 2192 bedrooms
- 1833 bedrooms
- 804 bedrooms
- 335+ bedrooms

- Bedrooms in renter-occupied apartments in Sea Bright, New Jersey
- 17no bedroom
- 1081 bedroom
- 982 bedrooms
- 173 bedrooms
- 134 bedrooms
- 315+ bedrooms

- Cars and other vehicles available in Sea Bright in owner-occupied houses/condos
- 40no vehicle
- 3031 vehicle
- 1812 vehicles
- 383 vehicles
- 694 vehicles
- 05+ vehicles

- Cars and other vehicles available in Sea Bright in renter-occupied apartments
- 15no vehicle
- 1341 vehicle
- 1362 vehicles
- 03 vehicles
- 04 vehicles
- 05+ vehicles

- Rooms in owner-occupied houses in Sea Bright, New Jersey
- 01 room
- 02 rooms
- 393 rooms
- 974 rooms
- 2215 rooms
- 666 rooms
- 577 rooms
- 388 rooms
- 1119+ rooms

- Rooms in renter-occupied apartments in Sea Bright, New Jersey
- 81 room
- 362 rooms
- 413 rooms
- 724 rooms
- 775 rooms
- 126 rooms
- 47 rooms
- 368 rooms
- 09+ rooms


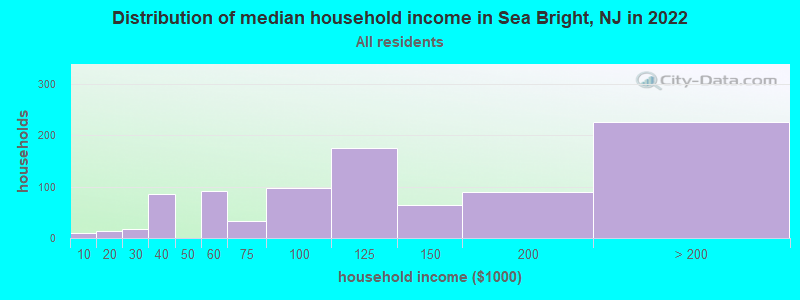
Sea Bright, NJ household income distribution

- 9Less than $10,000
- 14$10,000 to $19,999
- 18$20,000 to $29,999
- 86$30,000 to $39,999
- 92$50,000 to $59,999
- 33$60,000 to $74,999
- 98$75,000 to $99,999
- 175$100,000 to $124,999
- 64$125,000 to $149,999
- 89$150,000 to $199,999
- 226$200,000 or more
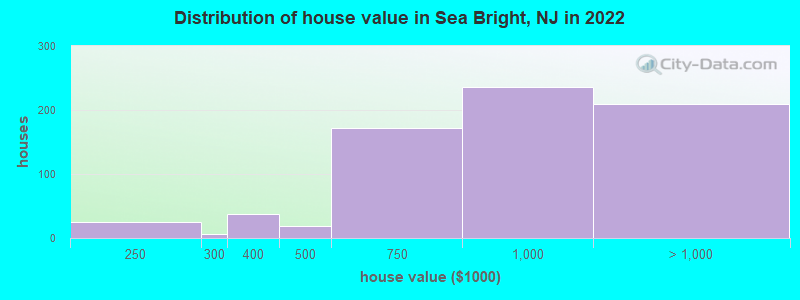
Home value of owner - occupied houses in 2022 in Sea Bright, NJ
-
- 25$200,000 to $249,999
- 7$250,000 to $299,999
- 37$300,000 to $399,999
- 19$400,000 to $499,999
- 172$500,000 to $749,999
- 236$750,000 to $999,999
- 99$1,000,000 to $1,499,999
- 55$1,500,000 to $1,999,999
- 55$2,000,000 or more
Rent paid by renters in 2022 in Sea Bright, NJ
-
- 25$800 to $899
- 8$900 to $999
- 28$1,000 to $1,249
- 25$1,250 to $1,499
- 95$1,500 to $1,999
- 56$2,000 to $2,499
- 4$2,500 to $2,999
- 17$3,500 or more
- 11No cash rent


Percentage of workers working in this county: 64.1%
Number of people working at home: 178 (20.3% of all workers)
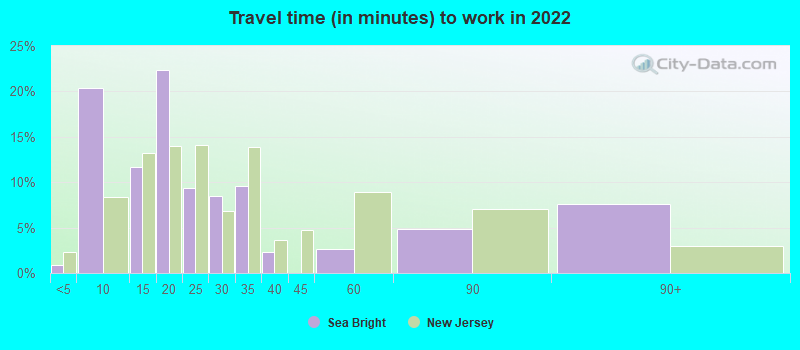
Travel time to work (commute)
- Less than 5 minutes: 0
- 5 to 9 minutes: 57
- 10 to 14 minutes: 89
- 15 to 19 minutes: 80
- 20 to 24 minutes: 102
- 25 to 29 minutes: 35
- 30 to 34 minutes: 48
- 35 to 39 minutes: 72
- 40 to 44 minutes: 5
- 45 to 59 minutes: 54
- 60 to 89 minutes: 72
- 90 or more minutes: 75
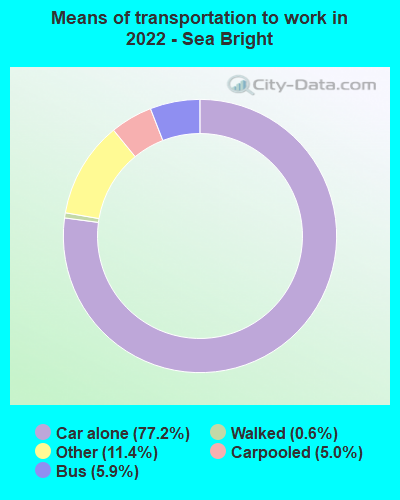
Means of transportation to work:
- Drove a car alone: 474 (57.9%)
- Carpooled: 36 (4.4%)
- Bus: 58 (7.1%)
- Taxi: 107 (13.1%)
- Walked: 5 (0.6%)
- Worked at home: 178 (21.8%)

- Unemployment by race in 2022
- Unemployment rate for White non-Hispanic residents
- 6.9%Males

- Year of entry for the foreign-born population in Sea Bright, New Jersey
- 02010 or later
- 132000 to 2009
- 301990 to 1999
- 361980 to 1989
- 201970 to 1979
- 48Before 1970

First ancestries reported:
- Irish: 129 (20.6%)
- Italian: 112 (17.9%)
- German: 86 (13.7%)
- American: 40 (6.4%)
- Armenian: 16 (2.6%)
- Slovak: 16 (2.6%)
- Russian: 13 (2.1%)
- Eastern European: 10 (1.6%)
- European: 9 (1.4%)
- English: 8 (1.3%)
- Polish: 6 (1.0%)
- Finnish: 5 (0.8%)
- British: 4 (0.6%)
Most common places of birth for foreign-born residents (%):
| Sea Bright: | 24.7% (19) |
| New Jersey: | 0.2% (4,579) |
| Sea Bright: | 16.9% (13) |
| New Jersey: | 0.5% (10,246) |
| Sea Bright: | 16.9% (13) |
| New Jersey: | 4.8% (102,527) |
| Sea Bright: | 11.7% (9) |
| New Jersey: | 2.7% (58,563) |
| Sea Bright: | 9.1% (7) |
| New Jersey: | 0.0% (503) |
| Sea Bright: | 7.8% (6) |
| New Jersey: | 1.5% (33,198) |
| Sea Bright: | 6.5% (5) |
| New Jersey: | 3.3% (70,512) |
Place of birth for U.S.-born residents:
- This state: 905
- Other state: 641
- Northeast: 489
- Midwest: 86
- South: 54
- West: 9
93.2% of Sea Bright residents lived in the same house 1 years ago.
Out of people who lived in different houses, 43.1% lived in this county.
Out of people who lived in different counties, 58.6% lived in New Jersey.
| Sea Bright: | 93.2% |
| State average: | 90.4% |
Education attainment for males 25 years and older:
- No schooling: 0
- Nursery to 4th grade: 0
- 5th and 6th grade: 0
- 7th and 8th grade: 0
- 9th grade: 0
- 10th grade: 0
- 11th grade: 0
- 12th grade, no diploma: 0
- High school graduate (or equivalency): 44
- Less than 1 year of college: 33
- Some college more than 1 year, no degree: 122
- Associate degree: 76
- Bachelor's degree: 294
- Master's degree: 91
- Professional school degree: 85
- Doctorate degree: 6

Education attainment for females 25 years and older:
- No schooling: 0
- Nursery to 4th grade: 0
- 5th and 6th grade: 0
- 7th and 8th grade: 0
- 9th grade: 0
- 10th grade: 0
- 11th grade: 0
- 12th grade, no diploma: 0
- High school graduate (or equivalency): 51
- Less than 1 year of college: 24
- Some college more than 1 year, no degree: 23
- Associate degree: 49
- Bachelor's degree: 307
- Master's degree: 95
- Professional school degree: 39
- Doctorate degree: 21


Housing units in structures:
- One, detached: 334
- One, attached: 289
- Two: 89
- 3 or 4: 33
- 5 to 9: 97
- 10 to 19: 124
- 20 to 49: 146
- 50 or more: 40
House/condo owner moved in on average 8 years ago
Renter moved in on average 5 years ago

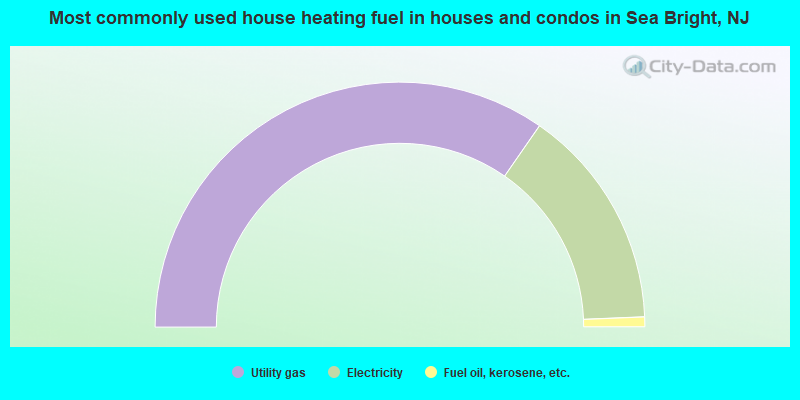
- 69.3%Utility gas
- 29.4%Electricity
- 1.3%Fuel oil, kerosene, etc.
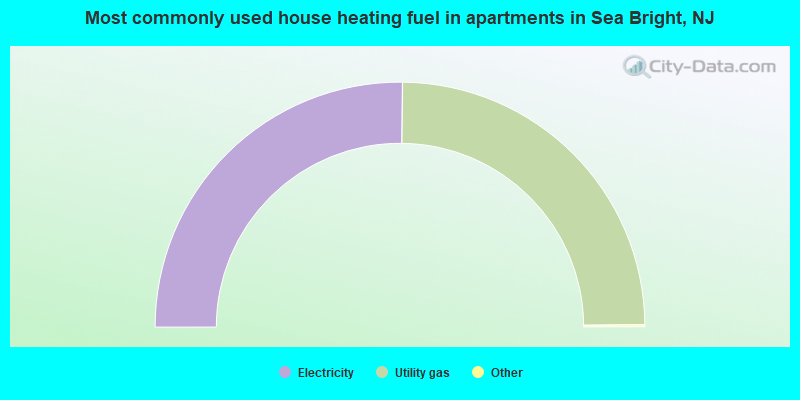
- 50.5%Electricity
- 49.5%Utility gas
Private vs. public school enrollment:
| Here: | 6.4% |
| New Jersey: | 12.3% |
| Here: | 8.0% |
| New Jersey: | 33.2% |


