Sea Cliff, NY (New York) Houses and Residents
| Sea Cliff: | $928,193 |
| New York: | $400,400 |
Mean price in 2022:
Detached houses: $1,103,038
Here: $1,103,038 State: $476,719 Townhouses or other attached units: $792,829
Here: $792,829 State: $699,270 In 2-unit structures: $1,046,033
Here: $1,046,033 State: $713,077
Total population: 5,024 (All urban)
Houses: 2,006 (1,836 occupied: 1,508 owner occupied, 324 renter occupied)
| % of renters here: | 18% |
| State: | 46% |
Housing density: 1,843 houses/condos per square mile
Median price asked for vacant for-sale houses and condos in 2022 in this county: $728,543.
Median contract rent in 2022: $1,839 (lower quartile is $1,526, upper quartile is over $2,000)
Median rent asked for vacant for-rent units in 2022: $1,269
Median gross rent in Sea Cliff, NY in 2022: over $2,000
Housing units in Sea Cliff with a mortgage: 1,034 (194 second mortgage, 7 home equity loan, 180 both second mortgage and home equity loan)
Houses without a mortgage: 34
Median household income for houses/condos with a mortgage: $247,725
Median household income for apartments without a mortgage: $153,353
Median monthly housing costs: $3,430
Compare current foreclosures near Sea Cliff, NY:
| Photo | Address | Area | Beds / Baths | Price | Details |
|---|---|---|---|---|---|

|
#1
Richardson Ave
Sea Cliff, NY 11579
|
2,291 sq. feet
|
3 baths - beds |
show details | |

|
#2
Sea Cliff Ave
Sea Cliff, NY 11579
|
1,394 sq. feet
|
1 baths - beds |
show details | |

|
#3
Francis Lewis Blvd
Queens Village, NY 11429
|
844 sq. feet
|
1 baths 2 beds |
$589,900
|
show details |

|
#4
W Sidney Ave
Mount Vernon, NY 10550
|
2,800 sq. feet
|
3 baths 8 beds |
$454,900
|
show details |

|
#5
Sylvan Knoll Rd
Stamford, CT 06902
|
1,100 sq. feet
|
1 baths 2 beds |
$339,900
|
show details |

|
#6
Grand Concourse Apt 3c
Bronx, NY 10452
|
700 sq. feet
|
1 baths 1 beds |
$184,500
|
show details |

|
#7
Crane Ave
White Plains, NY 10603
|
2,400 sq. feet
|
2 baths 4 beds |
$654,500
|
show details |

|
#8
E 81st St Apt 4c
New York, NY 10028
|
696 sq. feet
|
1 baths 1 beds |
$745,000
|
show details |

|
#9
Ruxton St
Uniondale, NY 11553
|
1,176 sq. feet
|
1 baths 3 beds |
$450,000
|
show details |

|
#10
Midland Ave Apt 4h
Bronxville, NY 10708
|
900 sq. feet
|
1 baths 1 beds |
$184,000
|
show details |
| Photo | Address | Area | Beds / Baths | Price | Details |
|---|---|---|---|---|---|

|
#11
72nd Avenue
Bellerose, NY 11426
|
850 sq. feet
|
1 baths 1 beds |
$259,900
|
show details |

|
#12
Olinville Ave Apt 11c
Bronx, NY 10467
|
1,000 sq. feet
|
2 baths 3 beds |
$385,000
|
show details |

|
#13
Limerick St
Stamford, CT 06902
|
1,382 sq. feet
|
4 baths 5 beds |
$919,900
|
show details |

|
#14
Davenport Ave Apt 1b
New Rochelle, NY 10805
|
750 sq. feet
|
1 baths 1 beds |
$159,900
|
show details |

|
#15
96th St
Ozone Park, NY 11417
|
1,520 sq. feet
|
2 baths 3 beds |
$709,900
|
show details |

|
#16
6th Ave Apt A
Huntington Station, NY 11746
|
3,300 sq. feet
|
4 baths 7 beds |
$999,900
|
show details |

|
#17
Harbor Rd
Hewlett, NY 11557
|
4,549 sq. feet
|
4 baths 5 beds |
$1,155,000
|
show details |

|
#18
Swinton Ave
Bronx, NY 10465
|
1,938 sq. feet
|
2 baths 3 beds |
$789,900
|
show details |

|
#19
E Marshall St
Hempstead, NY 11550
|
1,210 sq. feet
|
2 baths 4 beds |
$479,900
|
show details |

|
#20
90th St Apt 5d
Jackson Heights, NY 11372
|
1,000 sq. feet
|
1 baths 2 beds |
$269,900
|
show details |
| Photo | Address | Area | Beds / Baths | Price | Details |
|---|---|---|---|---|---|

|
#21
N Broadway Apt A6
Yonkers, NY 10701
|
950 sq. feet
|
2 baths 2 beds |
$219,900
|
show details |

|
#22
Evans Ave
Elmont, NY 11003
|
1,352 sq. feet
|
2 baths 3 beds |
$699,900
|
show details |

|
#23
Fordham Hill Oval Apt 12d
Bronx, NY 10468
|
850 sq. feet
|
1 baths 1 beds |
$179,900
|
show details |

|
#24
Cedar Rd
Inwood, NY 11096
|
- sq. feet
|
2 baths 4 beds |
$699,000
|
show details |

|
#25
Edcris Ln
Huntington, NY 11743
|
1,450 sq. feet
|
2 baths 3 beds |
$550,000
|
show details |

|
#26
Fairway Rd
Oceanside, NY 11572
|
2,250 sq. feet
|
2 baths 3 beds |
$509,900
|
show details |

|
#27
Riverdale Ave
Port Chester, NY 10573
|
1,616 sq. feet
|
1 baths 3 beds |
$639,900
|
show details |

|
#28
Sandy Hill Rd
Oyster Bay, NY 11771
|
9,672 sq. feet
|
6 baths 9 beds |
$1,394,900
|
show details |

|
#29
Franklin St
Elmont, NY 11003
|
1,116 sq. feet
|
2 baths 2 beds |
$679,900
|
show details |

|
#30
123rd Ave
Jamaica, NY 11434
|
1,042 sq. feet
|
1 baths 3 beds |
$460,000
|
show details |
| Photo | Address | Area | Beds / Baths | Price | Details |
|---|---|---|---|---|---|

|
#31
Ford Dr N
Massapequa, NY 11758
|
2,000 sq. feet
|
2 baths 5 beds |
$799,900
|
show details |

|
#32
Merle Ave
Oceanside, NY 11572
|
885 sq. feet
|
1 baths 2 beds |
$450,000
|
show details |

|
#33
E 221st St
Bronx, NY 10467
|
1,890 sq. feet
|
2 baths 3 beds |
$554,900
|
show details |

|
#34
Dartmouth St
Westbury, NY 11590
|
1,772 sq. feet
|
1 baths 4 beds |
$499,200
|
show details |

|
#35
17th Ave 1st Floor
Whitestone, NY 11357
|
610 sq. feet
|
1 baths 1 beds |
$229,900
|
show details |

|
#36
Tulip Ave # Gl2
Floral Park, NY 11001
|
1,200 sq. feet
|
1 baths 2 beds |
$409,900
|
show details |

|
#37
177th St
Jamaica, NY 11433
|
1,156 sq. feet
|
1 baths 3 beds |
$450,000
|
show details |

|
#38
Oceanside Pkwy
Oceanside, NY 11572
|
1,650 sq. feet
|
2 baths 2 beds |
$545,000
|
show details |

|
#39
Fordham Hill Oval
Bronx, NY 10468
|
700 sq. feet
|
1 baths 1 beds |
$154,900
|
show details |

|
#40
Central Park Ave Apt 9m
Yonkers, NY 10710
|
1,300 sq. feet
|
2 baths 3 beds |
$319,900
|
show details |
| Photo | Address | Area | Beds / Baths | Price | Details |
|---|---|---|---|---|---|

|
#41
2nd Ave # 5c
New York, NY 10029
|
550 sq. feet
|
1 baths 1 beds |
$429,900
|
show details |

|
#42
Bellport Ave
Wantagh, NY 11793
|
1,785 sq. feet
|
3 baths 5 beds |
$700,000
|
show details |

|
#43
Belmont Pkwy
Hempstead, NY 11550
|
1,348 sq. feet
|
1 baths 3 beds |
$659,900
|
show details |

|
#44
Fox Island Rd
Port Chester, NY 10573
|
- sq. feet
|
6 baths 6 beds |
$910,000
|
show details |

|
#45
11th Ave
Huntington Station, NY 11746
|
- sq. feet
|
2 baths 4 beds |
$399,000
|
show details |

|
#46
County Center Rd
White Plains, NY 10603
|
- sq. feet
|
2 baths 3 beds |
$540,800
|
show details |

|
#47
203rd St
Saint Albans, NY 11412
|
- sq. feet
|
1 baths 4 beds |
$421,000
|
show details |

|
#48
Arlington Ave Apt 11n
Bronx, NY 10471
|
500 sq. feet
|
- baths 1 beds |
$182,500
|
show details |

|
#49
Main Street Unit 1b
Jamaica, NY 11435
|
- sq. feet
|
3 baths 3 beds |
$314,900
|
show details |

|
Check over 1 million property listings on Foreclosure.com!
|
browse all offers | |||


 | Houses in Sea cliff and glen head (4 replies) |
| Searching for homes in LI (51 replies) |
| Manhasset Jewish population (38 replies) |
| Househunting in Sea Cliff (20 replies) |
| I don't want to hear my neighbor's fart (71 replies) |
| Looking to buy in Merrick (76 replies) |

Median year apartment built: 1954
Household type by relationship:
Households: 5,042- Male householders: 833 (152 living alone), Female householders: 987 (248 living alone)
1,129 spouses (1,120 opposite-sex spouses), 49 unmarried partners, (35 opposite-sex unmarried partners), 1,829 children (1,760 natural, 16 adopted, 52 stepchildren), 0 grandchildren, 21 brothers or sisters, 22 parents, 0 foster children, 28 other relatives, 90 non-relatives
- In group quarters: 47
Size of family households: 416 2-persons, 322 3-persons, 474 4-persons, 78 5-persons, 8 6-persons, 42 7-or-more-persons.
Size of nonfamily households: 417 1-person, 67 2-persons, 10 3-persons.
1,149 married couples with children.
110 single-parent households (84 men, 26 women).
85.4% of residents of Sea Cliff speak English at home.
1.7% of residents speak Spanish at home (54% speak English very well, 46% speak English well).
8.5% of residents speak other Indo-European language at home (89% speak English very well, 11% speak English well).
0.7% of residents speak Asian or Pacific Island language at home (58% speak English well, 42% don't speak English at all).
3.6% of residents speak other language at home (100% speak English very well).
Foreign born population: 577 (11.4%)
(89.9% of them are naturalized citizens)
| Here: | 6.9 |
| State: | 6.3 |
| Here: | 3.4 |
| State: | 3.8 |

- Bedrooms in owner-occupied houses and condos in Sea Cliff, New York
- 0no bedroom
- 191 bedroom
- 1492 bedrooms
- 6733 bedrooms
- 5254 bedrooms
- 1425+ bedrooms

- Bedrooms in renter-occupied apartments in Sea Cliff, New York
- 25no bedroom
- 1091 bedroom
- 1022 bedrooms
- 253 bedrooms
- 634 bedrooms
- 05+ bedrooms

- Cars and other vehicles available in Sea Cliff in owner-occupied houses/condos
- 10no vehicle
- 3231 vehicle
- 8052 vehicles
- 2243 vehicles
- 1124 vehicles
- 345+ vehicles

- Cars and other vehicles available in Sea Cliff in renter-occupied apartments
- 33no vehicle
- 1011 vehicle
- 1682 vehicles
- 133 vehicles
- 04 vehicles
- 105+ vehicles

- Rooms in owner-occupied houses in Sea Cliff, New York
- 01 room
- 02 rooms
- 193 rooms
- 974 rooms
- 955 rooms
- 2696 rooms
- 5137 rooms
- 2488 rooms
- 2689+ rooms

- Rooms in renter-occupied apartments in Sea Cliff, New York
- 251 room
- 112 rooms
- 1233 rooms
- 824 rooms
- 05 rooms
- 136 rooms
- 467 rooms
- 248 rooms
- 09+ rooms


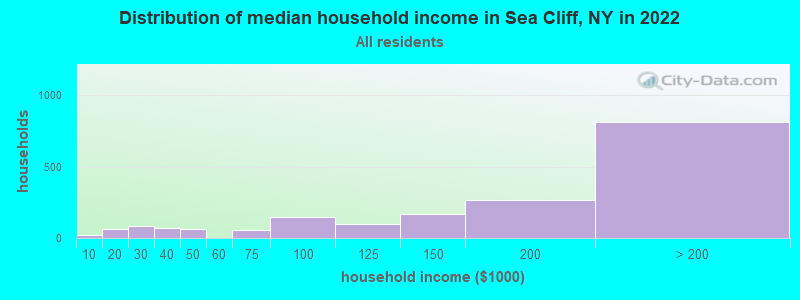
Sea Cliff, NY household income distribution

- 19Less than $10,000
- 66$10,000 to $19,999
- 84$20,000 to $29,999
- 70$30,000 to $39,999
- 60$40,000 to $49,999
- 53$60,000 to $74,999
- 146$75,000 to $99,999
- 95$100,000 to $124,999
- 167$125,000 to $149,999
- 265$150,000 to $199,999
- 814$200,000 or more
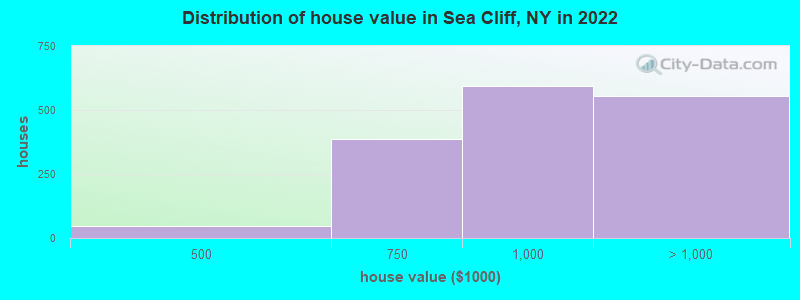
Home value of owner - occupied houses in 2022 in Sea Cliff, NY
-
- 46$400,000 to $499,999
- 388$500,000 to $749,999
- 592$750,000 to $999,999
- 350$1,000,000 to $1,499,999
- 205$1,500,000 to $1,999,999
Rent paid by renters in 2022 in Sea Cliff, NY
-
- 15$200 to $249
- 20$1,250 to $1,499
- 124$1,500 to $1,999
- 18$2,000 to $2,499
- 52$2,500 to $2,999
- 24$3,000 to $3,499
- 19$3,500 or more
- 67No cash rent

Percentage of workers working in this county: 75.6%
Number of people working at home: 512 (21.9% of all workers)
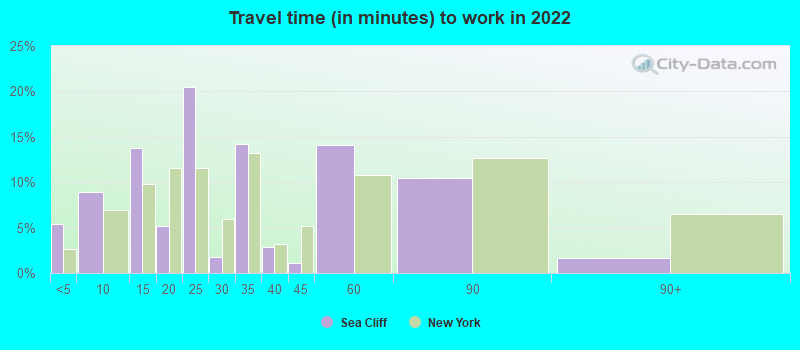
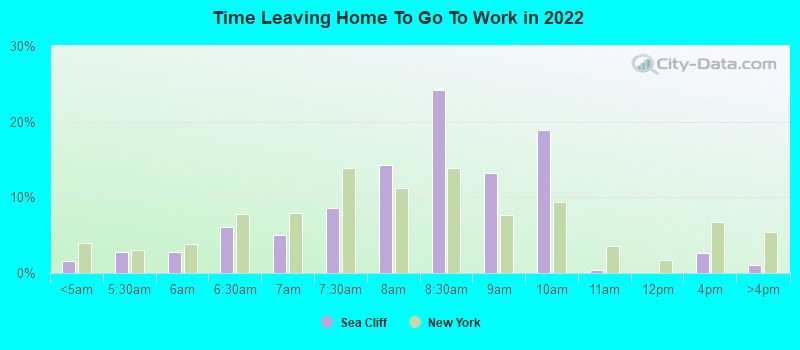
Travel time to work (commute)
- Less than 5 minutes: 89
- 5 to 9 minutes: 127
- 10 to 14 minutes: 196
- 15 to 19 minutes: 108
- 20 to 24 minutes: 191
- 25 to 29 minutes: 184
- 30 to 34 minutes: 223
- 35 to 39 minutes: 64
- 40 to 44 minutes: 119
- 45 to 59 minutes: 101
- 60 to 89 minutes: 256
- 90 or more minutes: 196
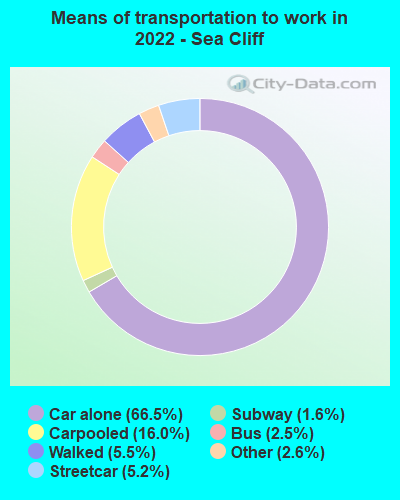
Means of transportation to work:
- Drove a car alone: 639 (44.7%)
- Carpooled: 149 (10.4%)
- Bus: 23 (1.6%)
- Subway or elevated rail: 44 (3.1%)
- Long-distance train or commuter rail: 13 (0.9%)
- Taxi: 36 (2.5%)
- Walked: 57 (4.0%)
- Worked at home: 512 (35.9%)
- Unemployment by race in 2022
- Unemployment rate for White non-Hispanic residents
- 10.3%Males
- 11.1%Females
- Unemployment rate for other race residents
- 100.0%Males

- Year of entry for the foreign-born population in Sea Cliff, New York
- 402010 or later
- 2792000 to 2009
- 661990 to 1999
- 1151980 to 1989
- 891970 to 1979
- 384Before 1970
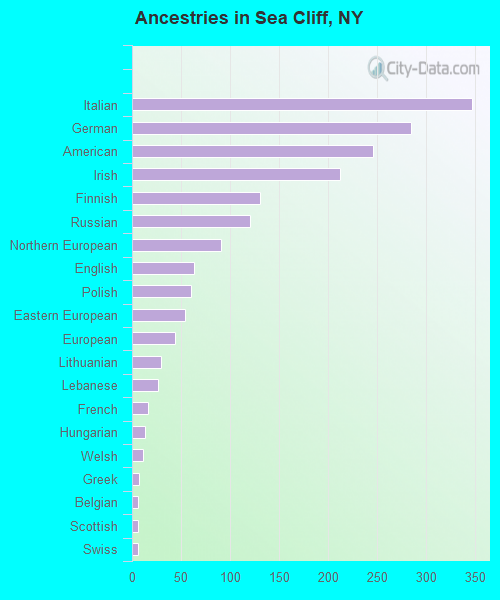
First ancestries reported:
- Italian: 347 (17.8%)
- German: 285 (14.6%)
- American: 246 (12.6%)
- Irish: 212 (10.9%)
- Finnish: 131 (6.7%)
- Russian: 120 (6.1%)
- Northern European: 91 (4.7%)
- English: 63 (3.2%)
- Polish: 60 (3.1%)
- Eastern European: 54 (2.8%)
- European: 44 (2.3%)
- Lithuanian: 30 (1.5%)
- Lebanese: 27 (1.4%)
- French: 16 (0.8%)
- Hungarian: 13 (0.7%)
- Welsh: 11 (0.6%)
- Greek: 7 (0.4%)
- Belgian: 6 (0.3%)
- Scottish: 6 (0.3%)
- Swiss: 6 (0.3%)
Most common places of birth for foreign-born residents (%):
| Sea Cliff: | 24.7% (138) |
| New York: | 0.0% (1,885) |
| Sea Cliff: | 7.0% (39) |
| New York: | 1.7% (78,421) |
| Sea Cliff: | 5.6% (31) |
| New York: | 0.2% (8,766) |
| Sea Cliff: | 5.6% (31) |
| New York: | 0.2% (10,005) |
| Sea Cliff: | 4.7% (26) |
| New York: | 0.1% (2,564) |
| Sea Cliff: | 4.5% (25) |
| New York: | 0.2% (8,026) |
| Sea Cliff: | 3.4% (19) |
| New York: | 1.7% (75,802) |
| Sea Cliff: | 3.0% (17) |
| New York: | 9.1% (410,910) |
| Sea Cliff: | 2.9% (16) |
| New York: | 0.1% (3,487) |
| Sea Cliff: | 2.9% (16) |
| New York: | 0.9% (42,220) |
| Sea Cliff: | 2.7% (15) |
| New York: | 0.8% (33,869) |
| Sea Cliff: | 2.7% (15) |
| New York: | 1.3% (59,107) |
| Sea Cliff: | 2.5% (14) |
| New York: | 0.7% (30,173) |
| Sea Cliff: | 2.5% (14) |
| New York: | 0.9% (38,713) |
| Sea Cliff: | 2.2% (12) |
| New York: | 1.4% (65,102) |
| Sea Cliff: | 2.2% (12) |
| New York: | 1.2% (54,759) |
| Sea Cliff: | 2.0% (11) |
| New York: | 0.5% (23,058) |
| Sea Cliff: | 2.0% (11) |
| New York: | 0.5% (23,242) |
| Sea Cliff: | 2.0% (11) |
| New York: | 2.0% (91,428) |
| Sea Cliff: | 1.8% (10) |
| New York: | 0.4% (19,652) |
| Sea Cliff: | 1.6% (9) |
| New York: | 0.1% (4,960) |
| Sea Cliff: | 1.6% (9) |
| New York: | 0.6% (28,604) |
Place of birth for U.S.-born residents:
- This state: 3,704
- Other state: 621
- Northeast: 219
- Midwest: 85
- South: 200
- West: 117
82.6% of Sea Cliff residents lived in the same house 1 years ago.
Out of people who lived in different houses, 45.8% lived in this county.
Out of people who lived in different counties, 75.8% lived in New York.
| Sea Cliff: | 82.6% |
| State average: | 89.6% |
Education attainment for males 25 years and older:
- No schooling: 27
- Nursery to 4th grade: 8
- 5th and 6th grade: 0
- 7th and 8th grade: 0
- 9th grade: 0
- 10th grade: 0
- 11th grade: 0
- 12th grade, no diploma: 0
- High school graduate (or equivalency): 188
- Less than 1 year of college: 33
- Some college more than 1 year, no degree: 127
- Associate degree: 215
- Bachelor's degree: 524
- Master's degree: 282
- Professional school degree: 159
- Doctorate degree: 147

Education attainment for females 25 years and older:
- No schooling: 33
- Nursery to 4th grade: 0
- 5th and 6th grade: 2
- 7th and 8th grade: 0
- 9th grade: 0
- 10th grade: 18
- 11th grade: 0
- 12th grade, no diploma: 21
- High school graduate (or equivalency): 470
- Less than 1 year of college: 65
- Some college more than 1 year, no degree: 130
- Associate degree: 18
- Bachelor's degree: 368
- Master's degree: 580
- Professional school degree: 73
- Doctorate degree: 33


Housing units in structures:
- One, detached: 1,707
- One, attached: 51
- Two: 80
- 3 or 4: 111
- 5 to 9: 56
House/condo owner moved in on average 18 years ago
Renter moved in on average 4 years ago

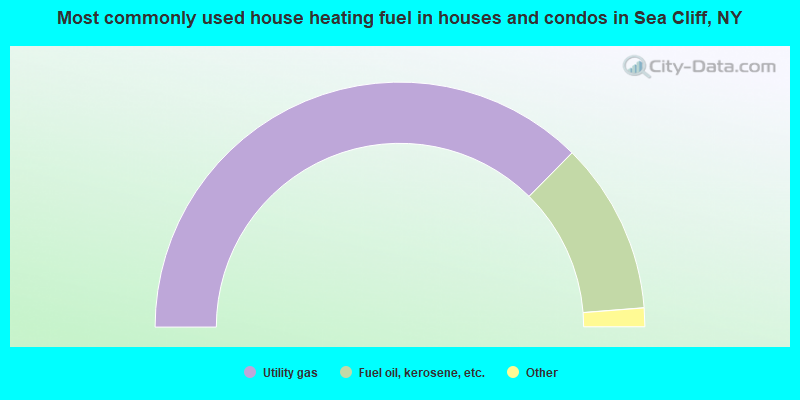
- 74.9%Utility gas
- 22.7%Fuel oil, kerosene, etc.
- 1.9%Bottled, tank, or LP gas
- 0.5%Electricity
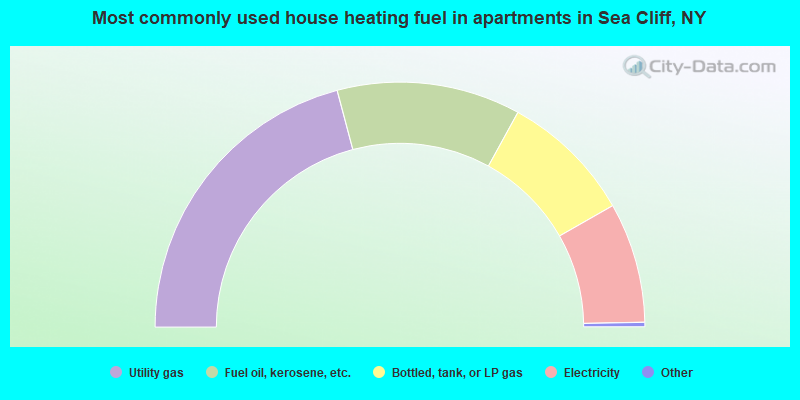
- 42.0%Utility gas
- 24.4%Fuel oil, kerosene, etc.
- 17.6%Bottled, tank, or LP gas
- 16.0%Electricity
Private vs. public school enrollment:
| Here: | 1.7% |
| New York: | 15.6% |
| Here: | 14.1% |
| New York: | 15.0% |
| Here: | 23.4% |
| New York: | 39.2% |


