Seatonville, IL (Illinois) Houses and Residents
| Seatonville: | $99,546 |
| Illinois: | $251,600 |
Mean price in 2022:
Detached houses: $139,329
Here: $139,329 State: $310,164
Total population: 311 (Urban population: 0, Rural population: 319 (2 farm, 317 nonfarm))
Houses: 206 (192 occupied: 165 owner occupied, 29 renter occupied)
| % of renters here: | 15% |
| State: | 33% |
Housing density: 424 houses/condos per square mile
Median price asked for vacant for-sale houses and condos in 2022: $113,873.
Median contract rent in 2022: $336 (lower quartile is $317, upper quartile is $543)
Median rent asked for vacant for-rent units in 2022: $360
Median gross rent in Seatonville, IL in 2022: $672
Housing units in Seatonville with a mortgage: 97 (5 second mortgage, 0 home equity loan, 4 both second mortgage and home equity loan)
Houses without a mortgage: 0
Median household income for houses/condos with a mortgage: $55,690
Median household income for apartments without a mortgage: $56,066
Median monthly housing costs: $701
Compare current foreclosures near Seatonville, IL:
| Photo | Address | Area | Beds / Baths | Price | Details |
|---|---|---|---|---|---|

|
#1
Lincoln St
Seatonville, IL 61359
|
2,308 sq. feet
|
3 baths 4 beds |
show details | |

|
#2
E Main St
Granville, IL 61326
|
2,691 sq. feet
|
3 baths 5 beds |
show details | |

|
#3
2nd St
La Salle, IL 61301
|
- sq. feet
|
2 baths 3 beds |
show details | |

|
#4
E 4th St
Spring Valley, IL 61362
|
- sq. feet
|
1 baths 3 beds |
show details | |

|
#5
E Marion St
Princeton, IL 61356
|
1,268 sq. feet
|
1 baths 2 beds |
show details | |

|
#6
2150 East St
Tiskilwa, IL 61368
|
1,630 sq. feet
|
2 baths 3 beds |
show details | |

|
#7
2400 North Ave # -
La Moille, IL 61330
|
1,700 sq. feet
|
1 baths 4 beds |
show details | |

|
#8
14th Ave
Mendota, IL 61342
|
1,726 sq. feet
|
- baths - beds |
show details | |

|
#9
Garfield Ave
La Salle, IL 61301
|
1,325 sq. feet
|
- baths - beds |
show details | |

|
#10
8th St
La Salle, IL 61301
|
1,286 sq. feet
|
- baths - beds |
show details |
| Photo | Address | Area | Beds / Baths | Price | Details |
|---|---|---|---|---|---|

|
#11
9th St
La Salle, IL 61301
|
2,771 sq. feet
|
- baths - beds |
show details | |

|
#12
11th St
La Salle, IL 61301
|
1,596 sq. feet
|
- baths - beds |
show details | |

|
#13
Crosat St
La Salle, IL 61301
|
1,220 sq. feet
|
- baths - beds |
show details | |

|
#14
Wynnwood Ln
Peru, IL 61354
|
1,280 sq. feet
|
- baths - beds |
show details | |

|
#15
Pike St
Peru, IL 61354
|
672 sq. feet
|
- baths - beds |
show details | |

|
#16
Oconor Ave
La Salle, IL 61301
|
2,228 sq. feet
|
- baths - beds |
show details | |

|
#17
Todd St
La Salle, IL 61301
|
936 sq. feet
|
- baths - beds |
show details | |

|
#18
N Church St
Princeton, IL 61356
|
- sq. feet
|
2 baths 4 beds |
show details | |

|
#19
N 2150th Rd
Oglesby, IL 61348
|
1,680 sq. feet
|
- baths - beds |
show details | |

|
#20
3rd St Apt 4
La Salle, IL 61301
|
- sq. feet
|
- baths - beds |
show details |
| Photo | Address | Area | Beds / Baths | Price | Details |
|---|---|---|---|---|---|

|
#21
13th Ave # D
Mendota, IL 61342
|
- sq. feet
|
- baths - beds |
show details | |

|
#22
8th Ave
Mendota, IL 61342
|
- sq. feet
|
- baths - beds |
show details | |

|
#23
8th Ave
Mendota, IL 61342
|
- sq. feet
|
- baths - beds |
show details | |

|
#24
2nd St
Mendota, IL 61342
|
- sq. feet
|
- baths - beds |
show details | |

|
#25
S 9th Ave Apt 135
Mendota, IL 61342
|
- sq. feet
|
- baths - beds |
show details | |

|
#26
E 450th Rd
Oglesby, IL 61348
|
- sq. feet
|
- baths - beds |
show details | |

|
#27
W Clark St
Princeton, IL 61356
|
- sq. feet
|
- baths - beds |
show details | |

|
#28
Grant Ave Apt 114
La Salle, IL 61301
|
- sq. feet
|
- baths - beds |
show details | |

|
#29
Cedar St
Cedar Point, IL 61316
|
- sq. feet
|
- baths - beds |
show details | |

|
#30
1/2 W Marquette St
Princeton, IL 61356
|
- sq. feet
|
- baths - beds |
show details |
| Photo | Address | Area | Beds / Baths | Price | Details |
|---|---|---|---|---|---|

|
#31
N Mercer St
Princeton, IL 61356
|
- sq. feet
|
- baths - beds |
show details | |

|
#32
2nd St
La Salle, IL 61301
|
- sq. feet
|
- baths - beds |
show details | |

|
#33
W 2nd St
Oglesby, IL 61348
|
- sq. feet
|
- baths - beds |
show details | |

|
#34
Crosat St
La Salle, IL 61301
|
- sq. feet
|
- baths - beds |
show details | |

|
#35
N 1st St
Princeton, IL 61356
|
- sq. feet
|
- baths - beds |
show details | |

|
#36
Claire Ln
Utica, IL 61373
|
- sq. feet
|
- baths - beds |
show details | |

|
#37
Oak Ridge Dr
La Salle, IL 61301
|
- sq. feet
|
- baths - beds |
show details | |

|
#38
Cerulla Cir
Oglesby, IL 61348
|
- sq. feet
|
- baths - beds |
show details | |

|
#39
N Chestnut St
Princeton, IL 61356
|
- sq. feet
|
- baths - beds |
show details | |

|
#40
E 1st St
Oglesby, IL 61348
|
- sq. feet
|
- baths - beds |
show details |
| Photo | Address | Area | Beds / Baths | Price | Details |
|---|---|---|---|---|---|

|
#41
Field Ave
Oglesby, IL 61348
|
- sq. feet
|
- baths - beds |
show details | |

|
#42
11th St
Peru, IL 61354
|
- sq. feet
|
- baths - beds |
show details | |

|
#43
8th St
Peru, IL 61354
|
- sq. feet
|
- baths - beds |
show details | |

|
#44
2nd Ave
Mendota, IL 61342
|
- sq. feet
|
- baths - beds |
show details | |

|
#45
E 4th St
Depue, IL 61322
|
- sq. feet
|
- baths - beds |
show details | |

|
#46
E 4th St
Depue, IL 61322
|
- sq. feet
|
- baths - beds |
show details | |

|
#47
E 6th St
Spring Valley, IL 61362
|
- sq. feet
|
- baths - beds |
show details | |

|
#48
E 5th St
Spring Valley, IL 61362
|
- sq. feet
|
- baths - beds |
show details | |

|
#49
E 1st St
Spring Valley, IL 61362
|
- sq. feet
|
- baths - beds |
show details | |

|
Check over 1 million property listings on Foreclosure.com!
|
browse all offers | |||


Median year apartment built: 1982
Household type by relationship:
Households: 426- Male householders: 104 (55 living alone), Female householders: 84 (13 living alone)
80 spouses (80 opposite-sex spouses), 12 unmarried partners, (12 opposite-sex unmarried partners), 125 children (115 natural, 3 adopted, 5 stepchildren), 1 grandchildren, 1 brothers or sisters, 10 parents, 0 foster children, 0 other relatives, 2 non-relatives
Size of family households: 56 2-persons, 30 3-persons, 9 4-persons, 16 5-persons, 7 7-or-more-persons.
Size of nonfamily households: 72 1-person, 2 2-persons.
52 married couples with children.
41 single-parent households (13 men, 28 women).
94.7% of residents of Seatonville speak English at home.
0.8% of residents speak Spanish at home (100% speak English very well).
2.3% of residents speak Asian or Pacific Island language at home (100% speak English very well).
2.8% of residents speak other language at home (82% speak English very well, 18% speak English well).
Foreign born population: 13 (3.1%)
(23.1% of them are naturalized citizens)
| Here: | 6.1 |
| State: | 6.4 |
| Here: | 4.0 |
| State: | 4.1 |

- Bedrooms in owner-occupied houses and condos in Seatonville, Illinois
- 0no bedroom
- 71 bedroom
- 692 bedrooms
- 593 bedrooms
- 184 bedrooms
- 125+ bedrooms

- Bedrooms in renter-occupied apartments in Seatonville, Illinois
- 0no bedroom
- 21 bedroom
- 242 bedrooms
- 33 bedrooms
- 04 bedrooms
- 05+ bedrooms

- Cars and other vehicles available in Seatonville in owner-occupied houses/condos
- 2no vehicle
- 661 vehicle
- 502 vehicles
- 343 vehicles
- 114 vehicles
- 35+ vehicles

- Cars and other vehicles available in Seatonville in renter-occupied apartments
- 0no vehicle
- 51 vehicle
- 232 vehicles
- 13 vehicles
- 04 vehicles
- 05+ vehicles

- Rooms in owner-occupied houses in Seatonville, Illinois
- 01 room
- 22 rooms
- 53 rooms
- 94 rooms
- 235 rooms
- 686 rooms
- 217 rooms
- 108 rooms
- 269+ rooms

- Rooms in renter-occupied apartments in Seatonville, Illinois
- 01 room
- 02 rooms
- 03 rooms
- 234 rooms
- 05 rooms
- 46 rooms
- 27 rooms
- 08 rooms
- 09+ rooms


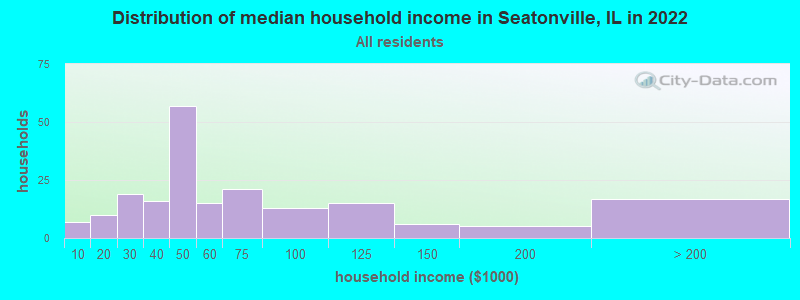
Seatonville, IL household income distribution

- 7Less than $10,000
- 10$10,000 to $19,999
- 19$20,000 to $29,999
- 16$30,000 to $39,999
- 57$40,000 to $49,999
- 15$50,000 to $59,999
- 21$60,000 to $74,999
- 13$75,000 to $99,999
- 15$100,000 to $124,999
- 6$125,000 to $149,999
- 5$150,000 to $199,999
- 17$200,000 or more
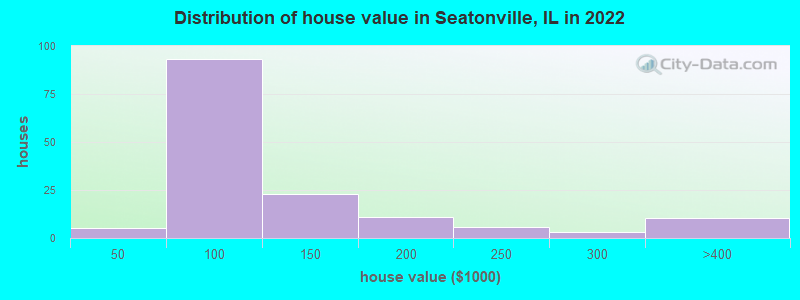
Home value of owner - occupied houses in 2022 in Seatonville, IL
-
- 3$10,000 to $14,999
- 1$40,000 to $49,999
- 17$50,000 to $59,999
- 11$60,000 to $69,999
- 21$70,000 to $79,999
- 1$80,000 to $89,999
- 40$90,000 to $99,999
- 16$100,000 to $124,999
- 6$125,000 to $149,999
- 8$150,000 to $174,999
- 2$175,000 to $199,999
- 5$200,000 to $249,999
- 3$250,000 to $299,999
- 10$300,000 to $399,999
Rent paid by renters in 2022 in Seatonville, IL
-
- 18$300 to $349
- 2$400 to $449
- 2$500 to $549
- 2$600 to $649
- 4$650 to $699
- 0$700 to $749


Percentage of workers working in this county: 53.2%
Number of people working at home: 13 (7.0% of all workers)
Travel time to work (commute)
- Less than 5 minutes: 0
- 5 to 9 minutes: 26
- 10 to 14 minutes: 43
- 15 to 19 minutes: 44
- 20 to 24 minutes: 34
- 25 to 29 minutes: 2
- 30 to 34 minutes: 7
- 35 to 39 minutes: 0
- 40 to 44 minutes: 0
- 45 to 59 minutes: 9
- 60 to 89 minutes: 0
- 90 or more minutes: 0
Means of transportation to work:
- Drove a car alone: 128 (88.3%)
- Carpooled: 8 (5.5%)
- Ferryboat: 2 (1.4%)
- Walked: 2 (1.4%)
- Worked at home: 5 (3.4%)

- Unemployment by race in 2022
- Unemployment rate for White non-Hispanic residents
- 5.7%Males
- 10.2%Females
- Unemployment rate for two or more race residents
- 5.3%Males

- Year of entry for the foreign-born population in Seatonville, Illinois
- 02010 or later
- 62000 to 2009
- 11990 to 1999
- 01980 to 1989
- 01970 to 1979
- 0Before 1970

First ancestries reported:
- German: 46 (31.0%)
- Italian: 21 (14.1%)
- Polish: 14 (9.4%)
- Scotch-Irish: 11 (7.4%)
- American: 5 (3.4%)
- Dutch: 4 (2.7%)
- English: 4 (2.7%)
- Irish: 4 (2.7%)
- Finnish: 3 (2.0%)
- Norwegian: 1 (0.7%)
- Serbian: 1 (0.7%)
Most common places of birth for foreign-born residents (%):
| Seatonville: | 38.5% (5) |
| Illinois: | 0.1% (1,630) |
| Seatonville: | 30.8% (4) |
| Illinois: | 0.2% (3,512) |
| Seatonville: | 7.7% (1) |
| Illinois: | 0.6% (10,943) |
Place of birth for U.S.-born residents:
- This state: 379
- Other state: 31
- Northeast: 0
- Midwest: 21
- South: 4
- West: 6
88.9% of Seatonville residents lived in the same house 1 years ago.
Out of people who lived in different houses, 0.0% lived in this county.
Out of people who lived in different counties, 5.9% lived in Illinois.
| Seatonville: | 88.9% |
| State average: | 88.3% |
Education attainment for males 25 years and older:
- No schooling: 2
- Nursery to 4th grade: 0
- 5th and 6th grade: 0
- 7th and 8th grade: 0
- 9th grade: 2
- 10th grade: 0
- 11th grade: 11
- 12th grade, no diploma: 3
- High school graduate (or equivalency): 84
- Less than 1 year of college: 17
- Some college more than 1 year, no degree: 12
- Associate degree: 14
- Bachelor's degree: 10
- Master's degree: 0
- Professional school degree: 0
- Doctorate degree: 0

Education attainment for females 25 years and older:
- No schooling: 0
- Nursery to 4th grade: 0
- 5th and 6th grade: 0
- 7th and 8th grade: 3
- 9th grade: 0
- 10th grade: 0
- 11th grade: 3
- 12th grade, no diploma: 0
- High school graduate (or equivalency): 51
- Less than 1 year of college: 24
- Some college more than 1 year, no degree: 11
- Associate degree: 29
- Bachelor's degree: 4
- Master's degree: 9
- Professional school degree: 0
- Doctorate degree: 0


Housing units in structures:
- One, detached: 191
- One, attached: 2
- Mobile homes: 13
Median worth of mobile homes: $65,974
Housing units lacking complete kitchen facilities in 2022: 2.9%
House/condo owner moved in on average 11 years ago
Renter moved in on average 7 years ago

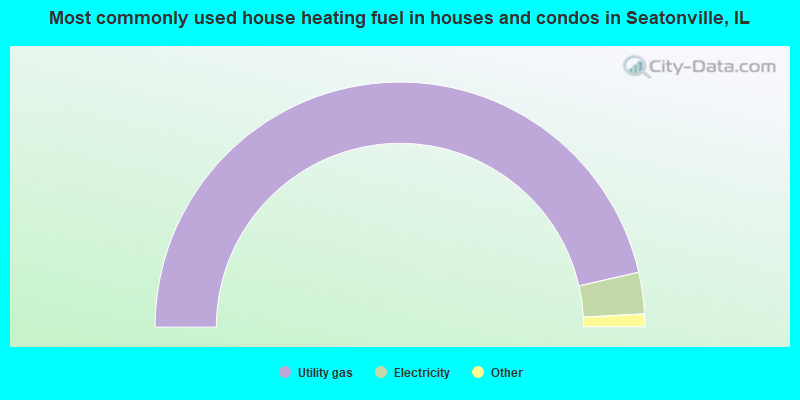
- 93.3%Utility gas
- 5.5%Electricity
- 0.6%Bottled, tank, or LP gas
- 0.6%Wood
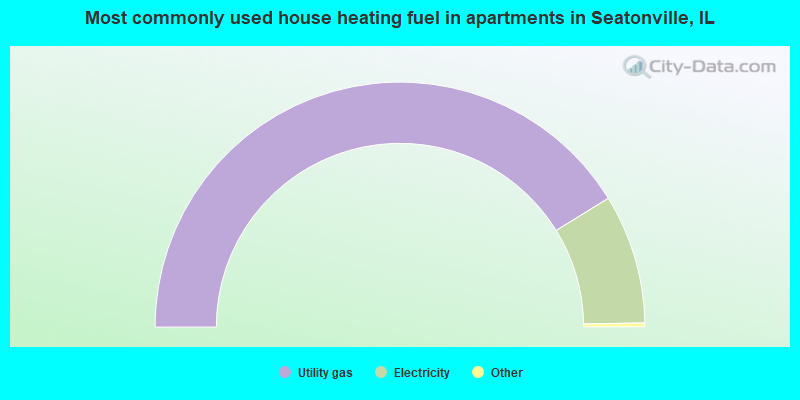
- 82.8%Utility gas
- 17.2%Electricity
Private vs. public school enrollment:
| Here: | 19.4% |
| Illinois: | 13.3% |
| Here: | 10.3% |
| Illinois: | 9.9% |
| Here: | 0.0% |
| Illinois: | 27.4% |


