Selden, NY (New York) Houses and Residents
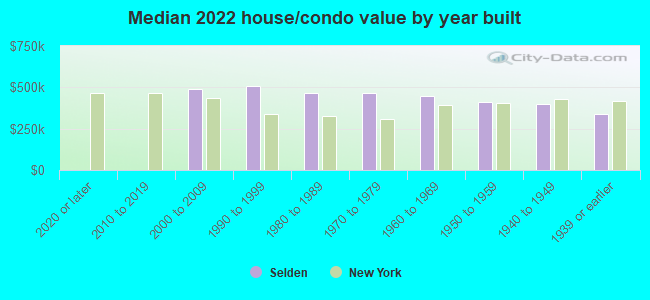
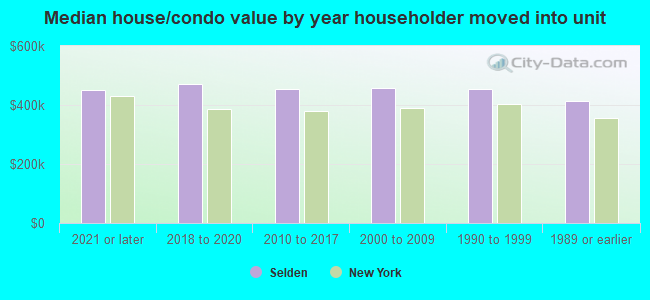
Estimated median house or condo value in 2022: $452,860 (it was $147,100 in 2000 )
Selden:
$452,860New York:
$400,400
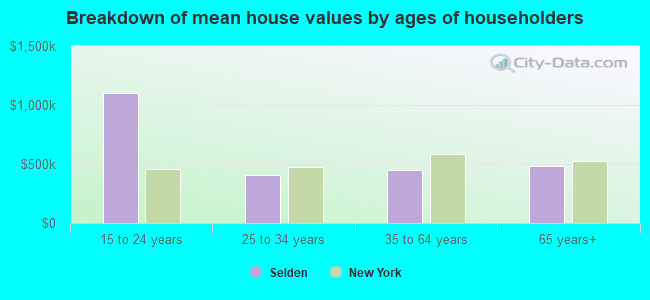
Lower value quartile - upper value quartile: $365,258 - $500,481Mean price in 2022: Detached houses: $413,768 Here:
$413,768State:
$476,719
Townhouses or other attached units: $593,149 Here:
$593,149State:
$699,270
In 2-unit structures: $589,816 Here:
$589,816State:
$713,077
In 5-or-more-unit structures: $592,256 Here:
$592,256State:
$912,009
Total population: 19,851 (All urban)
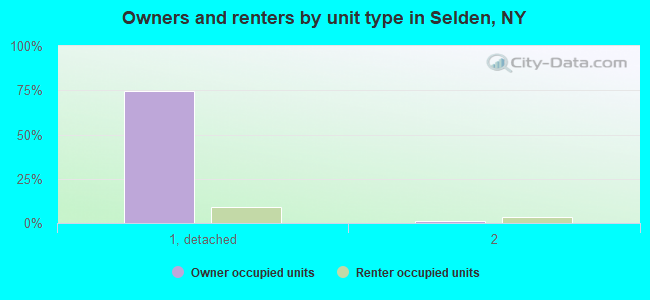
Houses: 7,196 (6,909 occupied: 5,930 owner occupied, 975 renter occupied )
% of renters here:
14%State:
46%
Housing density: 1,546 houses/condos per square mile
Median price asked for vacant for-sale houses and condos in 2022: $721,382.
Median contract rent in 2022: over $2,000 (lower quartile is $1,423, upper quartile is over $2,000)
Median rent asked for vacant for-rent units in 2022: $6,255
Median gross rent in Selden, NY in 2022: over $2,000
Housing units in Selden with a mortgage: 4,351 (434 second mortgage, 0 home equity loan, 368 both second mortgage and home equity loan )Houses without a mortgage: 146
Median household income for houses/condos with a mortgage: $132,443
Median household income for apartments without a mortgage: $83,477
Median monthly housing costs: $2,378
Data:
Median house or condo value ($)
Median house or condo value ($ change since 2000)
Median house or condo value ($) - White
Median house or condo value ($) - Black or African American
Median house or condo value ($) - Asian
Median house or condo value ($) - Hispanic or Latino
Median house or condo value ($) - American Indian and Alaska Native
Median house or condo value ($) - Multirace
Median house or condo value ($) - Other Race
Median price asked for mobile homes ($)
Household density (households per square mile)
Mean house or condo value by units in structure - 1, detached ($)
Mean house or condo value by units in structure - 1, attached ($)
Mean house or condo value by units in structure - 2 ($)
Mean house or condo value by units in structure by units in structure - 3 or 4 ($)
Mean house or condo value by units in structure - 5 or more ($)
Mean house or condo value by units in structure - Boat, RV, van, etc. ($)
Mean house or condo value by units in structure - Mobile home ($)
Median contract rent ($)
Median contract rent - Lower quartile ($)
Median contract rent - Upper quartile ($)
Median gross rent ($)
Urban houses (%)
Rural houses (%)
Houses occupied (%)
Houses occupied (% change since 2000)
Houses owner occupied (%)
Houses owner occupied (% change since 2000)
Houses renter occupied (%)
Houses renter occupied (% change since 2000)
Vacant housing units - For rent (%)
Vacant housing units - For rent (% change since 2000)
Vacant housing units - For sale only (%)
Vacant housing units - For sale only (% change since 2000)
Vacant housing units - Rented or sold, not occupied (%)
Vacant housing units - Rented or sold, not occupied (% change since 2000)
Vacant housing units - For seasonal, recreational, or occasional use (%)
Vacant housing units - For seasonal, recreational, or occasional use (% change since 2000)
Vacant housing units - For migrant workers (%)
Vacant housing units - For migrant workers (% change since 2000)
Vacant housing units - Other vacant (%)
Vacant housing units - Other vacant (% change since 2000)
Median monthly housing costs ($)
Median household income for houses/condos with a mortgage ($)
Median household income for houses/condos without a mortgage ($)
Median household income ($)
Median household income ($) - White
Median household income ($) - Black or African American
Median household income ($) - Asian
Median household income ($) - Hispanic or Latino
Median household income ($) - American Indian and Alaska Native
Median household income ($) - Multirace
Median household income ($) - Other Race
Mortgage status - with mortgage (%)
Mortgage status - with second mortgage (%)
Mortgage status - with home equity loan (%)
Mortgage status - with both second mortgage and home equity loan (%)
Mortgage status - without a mortgage (%)
Median year house/condo built
Median year apartment built
Household type by relationship - Male householder living alone (%)
Household type by relationship - Male householder not living alone (%)
Household type by relationship - Female householder living alone (%)
Household type by relationship - Female householder not living alone (%)
Household type by relationship - Opposite-Sex spouse (%)
Household type by relationship - Same-Sex spouse (%)
Household type by relationship - Opposite-Sex unmarried partner (%)
Household type by relationship - Same-Sex unmarried partner (%)
Household type by relationship - In group quarters (%)
Size of family households - 2-person household (%)
Size of family households - 3-person household (%)
Size of family households - 4-person household (%)
Size of family households - 5-person household (%)
Size of family households - 6-person household (%)
Size of family households - 7-or-more-person household (%)
Size of nonfamily households - 1-person household (%)
Size of nonfamily households - 2-person household (%)
Size of nonfamily households - 3-person household (%)
Size of nonfamily households - 4-person household (%)
Size of nonfamily households - 5-person household (%)
Size of nonfamily households - 6-person household (%)
Size of nonfamily households - 7-or-moreperson household (%)
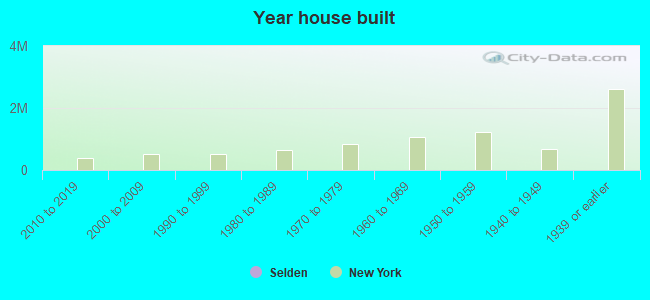
Year house built - Built 2010 or later (%)
Year house built - Built 2000 to 2009 (%)
Year house built - Built 1990 to 1999 (%)
Year house built - Built 1980 to 1989 (%)
Year house built - Built 1970 to 1979 (%)
Year house built - Built 1960 to 1969 (%)
Year house built - Built 1950 to 1959 (%)
Year house built - Built 1940 to 1949 (%)
Year house built - Built 1939 or earlier (%)
Median number of rooms in houses and condos
Median number of rooms in apartments
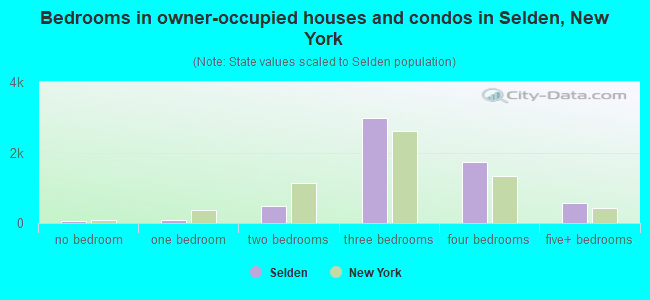
Median number of bedrooms in owner occupied houses
Mean number of bedrooms in owner occupied houses
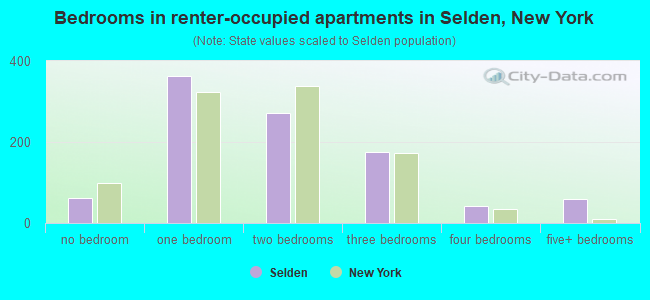
Median number of bedrooms in renter occupied houses
Mean number of bedrooms in renter occupied houses
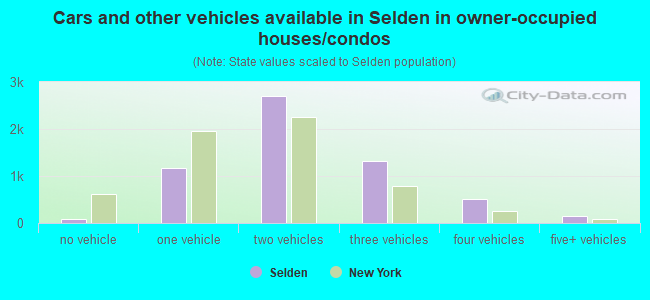
Median number of vehichles in owner occupied houses
Mean number of vehichles in owner occupied houses
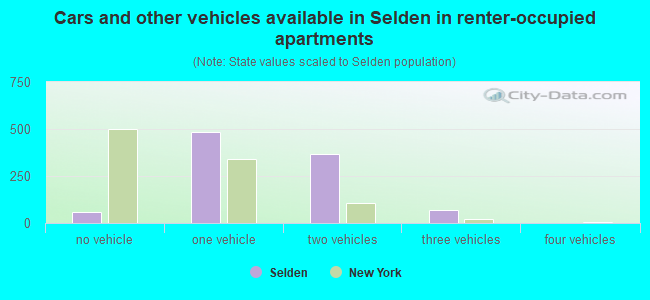
Median number of vehichles in renter occupied houses
Mean number of vehichles in renter occupied houses
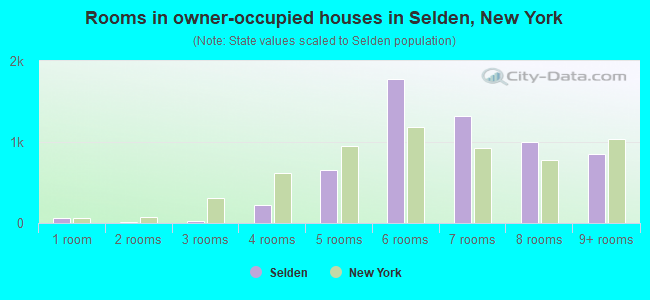
Rooms in owner-occupied houses - 1 room (%)
Rooms in owner-occupied houses - 2 rooms (%)
Rooms in owner-occupied houses - 3 rooms (%)
Rooms in owner-occupied houses - 4 rooms (%)
Rooms in owner-occupied houses - 5 rooms (%)
Rooms in owner-occupied houses - 6 rooms (%)
Rooms in owner-occupied houses - 7 rooms (%)
Rooms in owner-occupied houses - 8 rooms (%)
Rooms in owner-occupied houses - 9+ rooms (%)
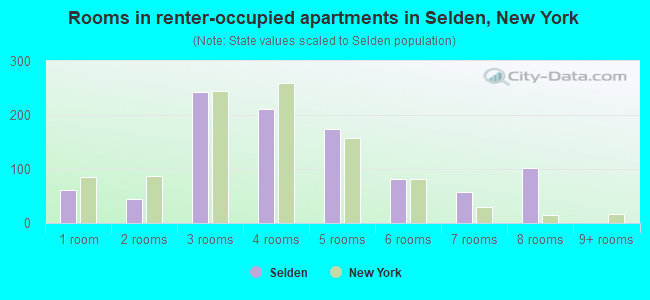
Rooms in renter-occupied houses - 1 room (%)
Rooms in renter-occupied houses - 2 rooms (%)
Rooms in renter-occupied houses - 3 rooms (%)
Rooms in renter-occupied houses - 4 rooms (%)
Rooms in renter-occupied houses - 5 rooms (%)
Rooms in renter-occupied houses - 6 rooms (%)
Rooms in renter-occupied houses - 7 rooms (%)
Rooms in renter-occupied houses - 8 rooms (%)
Rooms in renter-occupied houses - 9+ rooms (%)
Bedrooms in owner-occupied houses - no bedrooms (%)
Bedrooms in owner-occupied houses - 1 bedroom (%)
Bedrooms in owner-occupied houses - 2 bedrooms (%)
Bedrooms in owner-occupied houses - 3 bedrooms (%)
Bedrooms in owner-occupied houses - 4 bedrooms (%)
Bedrooms in owner-occupied houses - 5+ bedrooms (%)
Bedrooms in renter-occupied houses - no bedrooms (%)
Bedrooms in renter-occupied houses - 1 bedroom (%)
Bedrooms in renter-occupied houses - 2 bedrooms (%)
Bedrooms in renter-occupied houses - 3 bedrooms (%)
Bedrooms in renter-occupied houses - 4 bedrooms (%)
Bedrooms in renter-occupied houses - 5+ bedrooms (%)
Vehicles available in owner-occupied houses - no vehicle available (%)
Vehicles available in owner-occupied houses - 1 vehicle available(%)
Vehicles available in owner-occupied houses - 2 Vehicles available (%)
Vehicles available in owner-occupied houses - 3 Vehicles available (%)
Vehicles available in owner-occupied houses - 4 Vehicles available (%)
Vehicles available in owner-occupied houses - 5+ Vehicles available (%)
Vehicles available in renter-occupied houses - no vehicle available (%)
Vehicles available in renter-occupied houses - 1 vehicle available (%)
Vehicles available in renter-occupied houses - 2 Vehicles available (%)
Vehicles available in renter-occupied houses - 3 Vehicles available (%)
Vehicles available in renter-occupied houses - 4 Vehicles available (%)
Vehicles available in renter-occupied houses - 5+ Vehicles available (%)
Housing units in structures - 1, detached (%)
Housing units in structures - 1, attached (%)
Housing units in structures - 2 (%)
Housing units in structures - 3 or 4 (%)
Housing units in structures - 5 to 9 (%)
Housing units in structures - 10 to 19 (%)
Housing units in structures - 20 to 49 (%)
Housing units in structures - 50 or more (%)
Housing units in structures - Mobile home (%)
Housing units in structures - Boat, RV, van, etc. (%)
Housing units in structures - Owners - 1, detached (%)
Housing units in structures - Owners - 1, attached (%)
Housing units in structures - Owners - 2 (%)
Housing units in structures - Owners - 3 or 4 (%)
Housing units in structures - Owners - 5 to 9 (%)
Housing units in structures - Owners - 10 to 19 (%)
Housing units in structures - Owners - 20 to 49 (%)
Housing units in structures - Owners - 50 or more (%)
Housing units in structures - Owners - Mobile home (%)
Housing units in structures - Owners - Boat, RV, van, etc. (%)
Housing units in structures - Renters - 1, detached (%)
Housing units in structures - Renters - 1, attached (%)
Housing units in structures - Renters - 2 (%)
Housing units in structures - Renters - 3 or 4 (%)
Housing units in structures - Renters - 5 to 9 (%)
Housing units in structures - Renters - 10 to 19 (%)
Housing units in structures - Renters - 20 to 49 (%)
Housing units in structures - Renters - 50 or more (%)
Housing units in structures - Renters - Mobile home (%)
Housing units in structures - Renters - Boat, RV, van, etc. (%)
House/condo owner moved in on average (years ago)
Renter moved in on average (years ago)
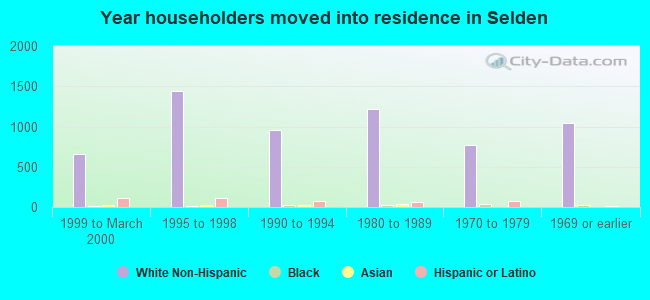
Year householder moved into unit - Moved in 1999 to March 2000 (%)
Year householder moved into unit - Moved in 1999 to March 2000 (%) - White
Year householder moved into unit - Moved in 1999 to March 2000 (%) - Black or African American
Year householder moved into unit - Moved in 1999 to March 2000 (%) - Asian
Year householder moved into unit - Moved in 1999 to March 2000 (%) - Hispanic or Latino
Year householder moved into unit - Moved in 1999 to March 2000 (%) - American Indian and Alaska Native
Year householder moved into unit - Moved in 1999 to March 2000 (%) - Multirace
Year householder moved into unit - Moved in 1999 to March 2000 (%) - Other Race
Year householder moved into unit - Moved in 1995 to 1998 (%)
Year householder moved into unit - Moved in 1995 to 1998 (%) - White
Year householder moved into unit - Moved in 1995 to 1998 (%) - Black or African American
Year householder moved into unit - Moved in 1995 to 1998 (%) - Asian
Year householder moved into unit - Moved in 1995 to 1998 (%) - Hispanic or Latino
Year householder moved into unit - Moved in 1995 to 1998 (%) - American Indian and Alaska Native
Year householder moved into unit - Moved in 1995 to 1998 (%) - Multirace
Year householder moved into unit - Moved in 1995 to 1998 (%) - Other Race
Year householder moved into unit - Moved in 1990 to 1994 (%)
Year householder moved into unit - Moved in 1990 to 1994 (%) - White
Year householder moved into unit - Moved in 1990 to 1994 (%) - Black or African American
Year householder moved into unit - Moved in 1990 to 1994 (%) - Asian
Year householder moved into unit - Moved in 1990 to 1994 (%) - Hispanic or Latino
Year householder moved into unit - Moved in 1990 to 1994 (%) - American Indian and Alaska Native
Year householder moved into unit - Moved in 1990 to 1994 (%) - Multirace
Year householder moved into unit - Moved in 1990 to 1994 (%) - Other Race
Year householder moved into unit - Moved in 1980 to 1989 (%)
Year householder moved into unit - Moved in 1980 to 1989 (%) - White
Year householder moved into unit - Moved in 1980 to 1989 (%) - Black or African American
Year householder moved into unit - Moved in 1980 to 1989 (%) - Asian
Year householder moved into unit - Moved in 1980 to 1989 (%) - Hispanic or Latino
Year householder moved into unit - Moved in 1980 to 1989 (%) - American Indian and Alaska Native
Year householder moved into unit - Moved in 1980 to 1989 (%) - Multirace
Year householder moved into unit - Moved in 1980 to 1989 (%) - Other Race
Year householder moved into unit - Moved in 1970 to 1979 (%)
Year householder moved into unit - Moved in 1970 to 1979 (%) - White
Year householder moved into unit - Moved in 1970 to 1979 (%) - Black or African American
Year householder moved into unit - Moved in 1970 to 1979 (%) - Asian
Year householder moved into unit - Moved in 1970 to 1979 (%) - Hispanic or Latino
Year householder moved into unit - Moved in 1970 to 1979 (%) - American Indian and Alaska Native
Year householder moved into unit - Moved in 1970 to 1979 (%) - Multirace
Year householder moved into unit - Moved in 1970 to 1979 (%) - Other Race
Year householder moved into unit - Moved in 1969 or earlier (%)
Year householder moved into unit - Moved in 1969 or earlier (%) - White
Year householder moved into unit - Moved in 1969 or earlier (%) - Black or African American
Year householder moved into unit - Moved in 1969 or earlier (%) - Asian
Year householder moved into unit - Moved in 1969 or earlier (%) - Hispanic or Latino
Year householder moved into unit - Moved in 1969 or earlier (%) - American Indian and Alaska Native
Year householder moved into unit - Moved in 1969 or earlier (%) - Multirace
Year householder moved into unit - Moved in 1969 or earlier (%) - Other Race
Housing units lacking complete plumbing facilities (%)
Housing units lacking complete kitchen facilities (%)
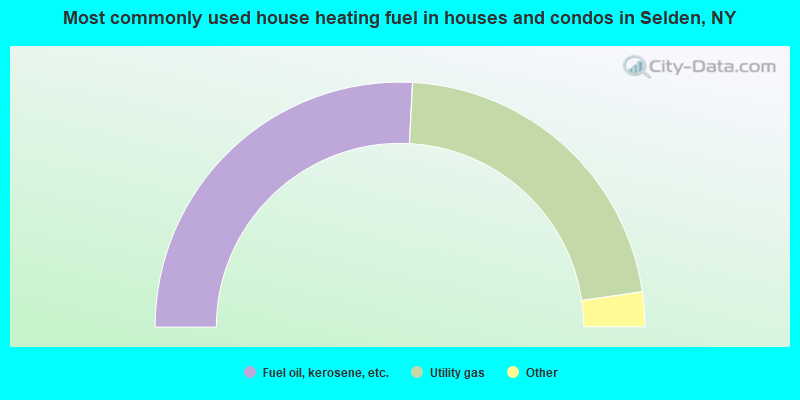
House heating fuel used in houses and condos - Utility gas (%)
House heating fuel used in houses and condos - Bottled, tank, or LP gas (%)
House heating fuel used in houses and condos - Electricity (%)
House heating fuel used in houses and condos - Fuel oil, kerosene, etc. (%)
House heating fuel used in houses and condos - Coal or coke (%)
House heating fuel used in houses and condos - Wood (%)
House heating fuel used in houses and condos - Solar energy (%)
House heating fuel used in houses and condos - Other fuel (%)
House heating fuel used in houses and condos - No fuel used (%)
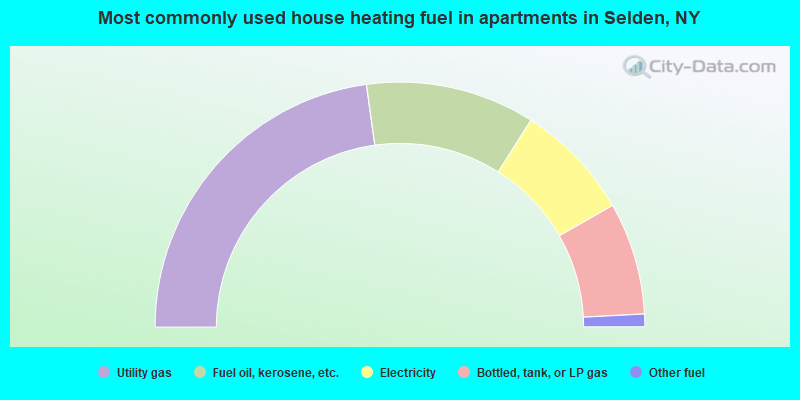
House heating fuel used in apartments - Utility gas (%)
House heating fuel used in apartments - Bottled, tank, or LP gas (%)
House heating fuel used in apartments - Electricity (%)
House heating fuel used in apartments - Fuel oil, kerosene, etc. (%)
House heating fuel used in apartments - Coal or coke (%)
House heating fuel used in apartments - Wood (%)
House heating fuel used in apartments - Solar energy (%)
House heating fuel used in apartments - Other fuel (%)
House heating fuel used in apartments - No fuel used (%)
Latest news about housing in Selden, NY collected exclusively by city-data.com from local newspapers, TV, and radio stations
Median year house/condo built: 1966Median year apartment built: 1976Household type by relationship:
Households: 21,772
Male householders: 3,455 (355 living alone ), Female householders: 3,438 (682 living alone )4,058 spouses (4,037 opposite-sex spouses ), 449 unmarried partners , (431 opposite-sex unmarried partners ), 7,746 children (7,400 natural , 127 adopted , 219 stepchildren ), 624 grandchildren , 325 brothers or sisters , 698 parents , 0 foster children , 434 other relatives , 476 non-relatives In group quarters: 66
Size of family households: 1,760 2-persons , 1,519 3-persons , 1,153 4-persons , 848 5-persons , 163 6-persons , 56 7-or-more-persons .
Size of nonfamily households: 1,045 1-person , 243 2-persons , 27 3-persons , 15 4-persons .
3,221 married couples with children. single-parent households (305 men , 424 women ).
78.8% of residents of Selden speak English at home. of residents speak Spanish at home (74% speak English very well , 15% speak English well , 9% speak English not well , 2% don't speak English at all ).of residents speak other Indo-European language at home (69% speak English very well , 20% speak English well , 9% speak English not well , 2% don't speak English at all ).of residents speak Asian or Pacific Island language at home (53% speak English very well , 34% speak English well , 10% speak English not well , 3% don't speak English at all ).of residents speak other language at home (88% speak English very well , 12% speak English not well ).
Foreign born population: 2,956 (13.6%)of them are naturalized citizens )
Median number of rooms in houses and condos:
Median number of rooms in apartments
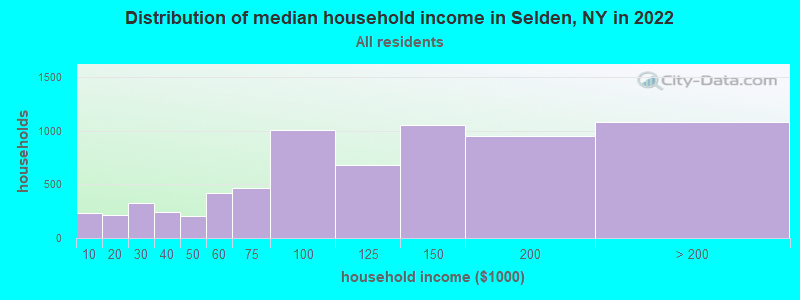
Selden, NY household income distribution 234 Less than $10,000210 $10,000 to $19,999329 $20,000 to $29,999241 $30,000 to $39,999206 $40,000 to $49,999423 $50,000 to $59,999462 $60,000 to $74,9991,005 $75,000 to $99,999681 $100,000 to $124,9991,054 $125,000 to $149,999949 $150,000 to $199,9991,080 $200,000 or more
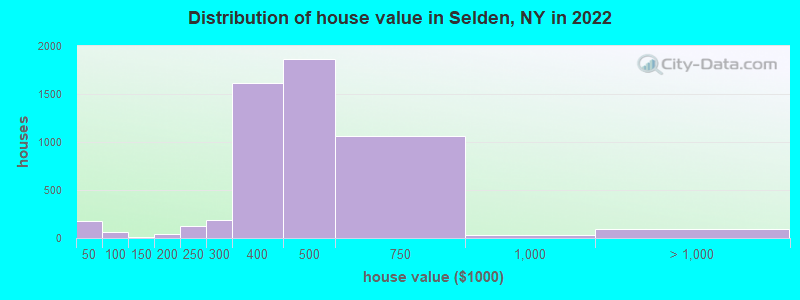
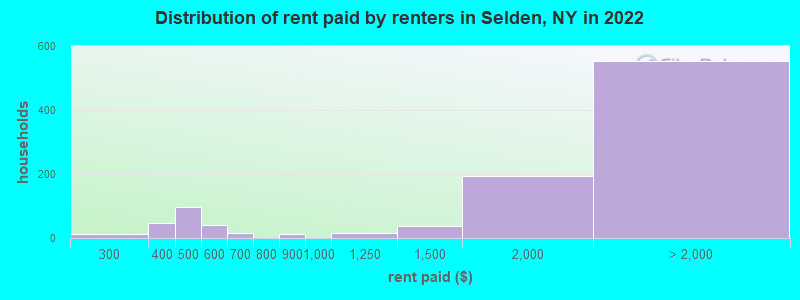
Home value of owner - occupied houses in 2022 in Selden, NY 64 Less than $10,0002 $15,000 to $19,99913 $25,000 to $29,99930 $35,000 to $39,99961 $40,000 to $49,9998 $100,000 to $124,99944 $175,000 to $199,999123 $200,000 to $249,999190 $250,000 to $299,9991,610 $300,000 to $399,9991,868 $400,000 to $499,9991,061 $500,000 to $749,99935 $750,000 to $999,99990 $2,000,000 or moreRent paid by renters in 2022 in Selden, NY 11 $200 to $2497 $300 to $34940 $350 to $39948 $400 to $44949 $450 to $49940 $500 to $5499 $600 to $6495 $650 to $69912 $800 to $89914 $1,000 to $1,24939 $1,250 to $1,499193 $1,500 to $1,999274 $2,000 to $2,499171 $2,500 to $2,99918 $3,000 to $3,49956 $3,500 or more32 No cash rent
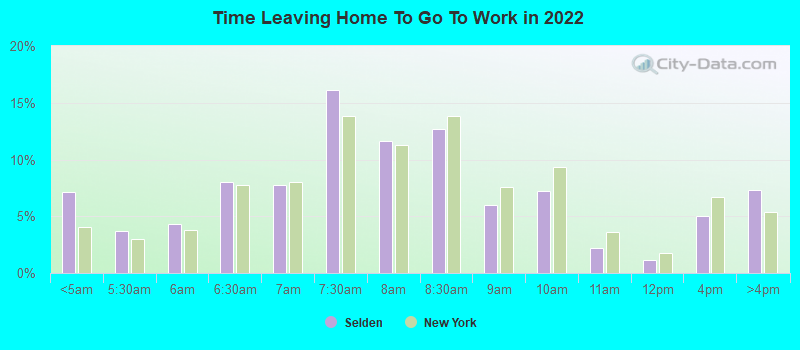
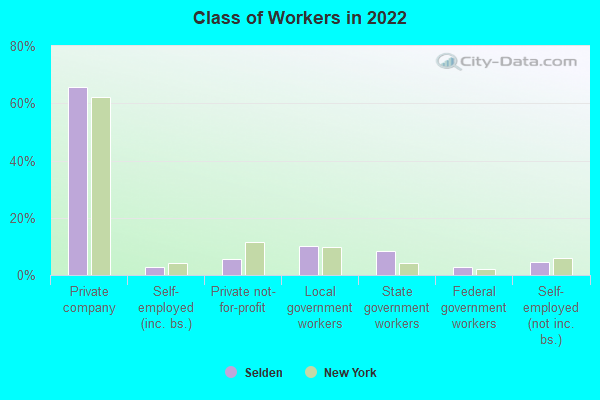
Percentage of workers working in this county: 86.6%Number of people working at home: 928 (8.6% of all workers )
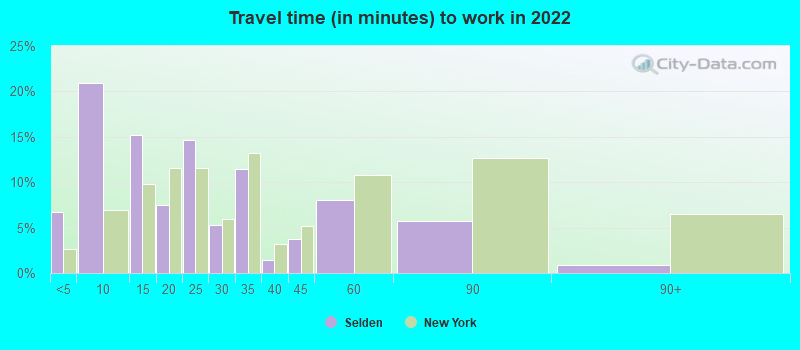
Travel time to work (commute)
Less than 5 minutes: 2065 to 9 minutes: 97110 to 14 minutes: 1,23515 to 19 minutes: 1,72920 to 24 minutes: 1,22725 to 29 minutes: 45230 to 34 minutes: 1,39535 to 39 minutes: 30440 to 44 minutes: 39145 to 59 minutes: 74860 to 89 minutes: 59290 or more minutes: 508
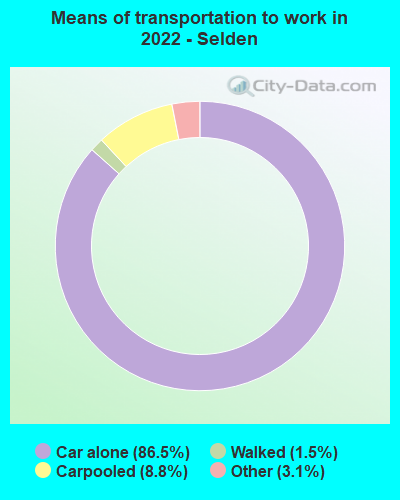
Means of transportation to work:
Drove a car alone: 3,932 (71.4%)Carpooled: 459 (8.3%)Taxi: 178 (3.2%)Walked: 74 (1.3%)Worked at home: 928 (16.8%)
Unemployment by race in 2022
Unemployment rate for White non-Hispanic residents 3.3% Males3.0% FemalesUnemployment rate for Black residents 6.7% Males8.9% FemalesUnemployment rate for Asian residents 6.7% Males5.6% FemalesUnemployment rate for other race residents 6.9% MalesUnemployment rate for two or more race residents 1.5% Males13.3% FemalesUnemployment rate for Hispanic or Latino residents 5.4% Males1.9% Females
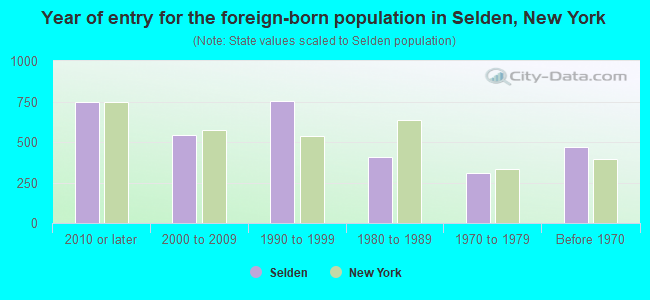
Year of entry for the foreign-born population in Selden, New York
744 2010 or later 545 2000 to 2009 756 1990 to 1999 406 1980 to 1989 309 1970 to 1979 468 Before 1970
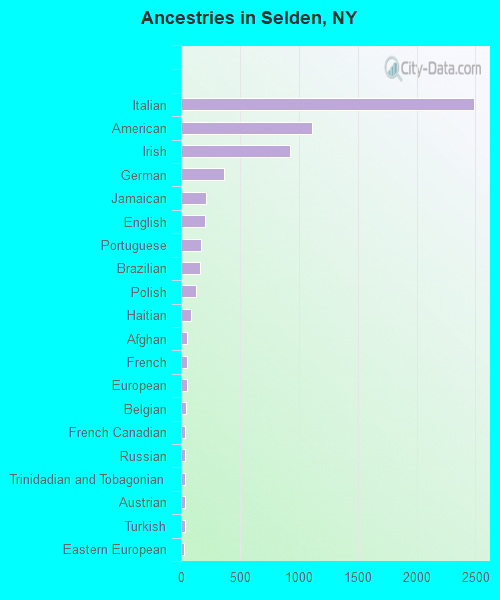
First ancestries reported:
Italian: 2,491 (23.9%)
American: 1,116 (10.7%)
Irish: 928 (8.9%)
German: 361 (3.5%)
Jamaican: 209 (2.0%)
English: 202 (1.9%)
Portuguese: 173 (1.7%)
Brazilian: 159 (1.5%)
Polish: 127 (1.2%)
Haitian: 81 (0.8%)
Afghan: 55 (0.5%)
French: 50 (0.5%)
European: 49 (0.5%)
Belgian: 40 (0.4%)
French Canadian: 38 (0.4%)
Russian: 38 (0.4%)
Trinidadian and Tobagonian: 37 (0.4%)
Austrian: 31 (0.3%)
Turkish: 31 (0.3%)
Eastern European: 26 (0.2%)
Hungarian: 20 (0.2%)
Egyptian: 19 (0.2%)
Guyanese: 16 (0.2%)
Norwegian: 14 (0.1%)
Cypriot: 13 (0.1%)
Scottish: 10 (0.10%)
West Indian: 10 (0.10%)
Slovak: 8 (0.08%)
Czech: 6 (0.06%) Most common places of birth for foreign-born residents (%): Pakistan Selden:
10.2% (277)New York:
1.4% (62,442)
Peru Selden:
8.9% (244)New York:
1.2% (54,759)
Ecuador Selden:
8.3% (226)New York:
3.9% (177,448)
Dominican Republic Selden:
6.7% (184)New York:
11.1% (501,040)
Bangladesh Selden:
6.1% (165)New York:
2.6% (117,288)
Guyana Selden:
4.9% (133)New York:
3.8% (172,129)
India Selden:
4.4% (119)New York:
3.5% (158,432)
El Salvador Selden:
4.0% (108)New York:
2.4% (108,067)
Italy Selden:
3.9% (105)New York:
1.8% (81,374)
Haiti Selden:
3.6% (99)New York:
2.8% (126,936)
Jamaica Selden:
3.6% (97)New York:
5.0% (227,557)
Portugal Selden:
3.3% (89)New York:
0.2% (10,519)
Philippines Selden:
3.2% (88)New York:
2.0% (91,070)
Brazil Selden:
2.6% (70)New York:
0.7% (30,658)
Colombia Selden:
2.3% (63)New York:
2.5% (111,920)
Guatemala Selden:
2.2% (60)New York:
1.4% (61,245)
Honduras Selden:
2.1% (58)New York:
1.2% (55,571)
Place of birth for U.S.-born residents:
This state: 17,508Other state: 1,052Northeast: 579Midwest: 212South: 177West: 78 91.4% of Selden residents lived in the same house 1 years ago.
Out of people who lived in different houses, 43.6% lived in this county.
Out of people who lived in different counties, 91.2% lived in New York.
Selden:
91.4%State average:
89.6%
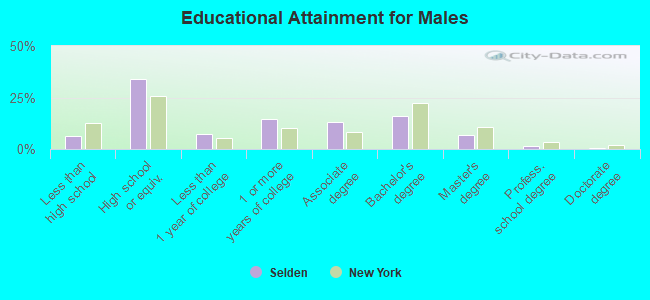
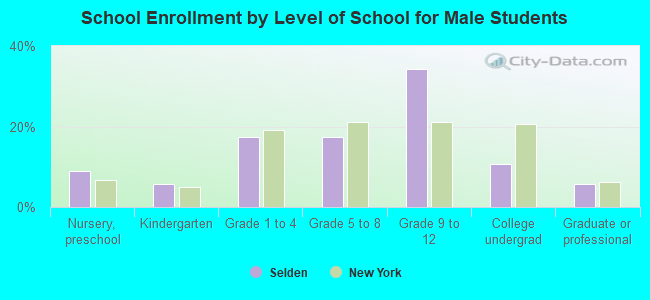
Education attainment for males 25 years and older:
No schooling: 86Nursery to 4th grade: 125th and 6th grade: 767th and 8th grade: 449th grade: 6210th grade: 3011th grade: 5012th grade, no diploma: 122High school graduate (or equivalency): 2,531Less than 1 year of college: 524Some college more than 1 year, no degree: 1,093Associate degree: 964Bachelor's degree: 1,202Master's degree: 499Professional school degree: 92Doctorate degree: 32
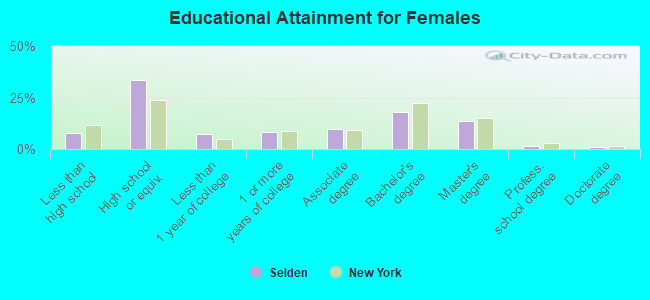
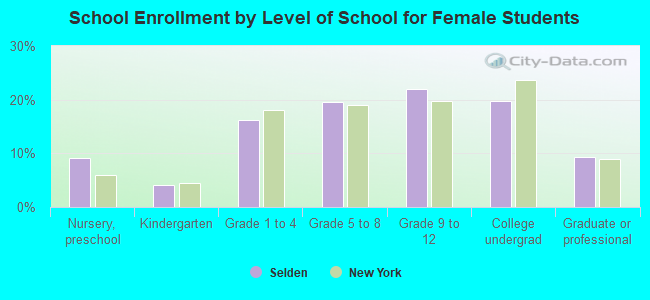
Education attainment for females 25 years and older:
No schooling: 85Nursery to 4th grade: 195th and 6th grade: 357th and 8th grade: 459th grade: 1110th grade: 10411th grade: 12012th grade, no diploma: 179High school graduate (or equivalency): 2,576Less than 1 year of college: 540Some college more than 1 year, no degree: 622Associate degree: 733Bachelor's degree: 1,364Master's degree: 1,050Professional school degree: 114Doctorate degree: 56
Housing units in structures:
One, detached: 6,294One, attached: 122Two: 1143 or 4: 1985 to 9: 24010 to 19: 10320 to 49: 750 or more: 116Housing units lacking complete plumbing facilities in 2022: 0.2%Housing units lacking complete kitchen facilities in 2022: 0.2%House/condo owner moved in on average 19 years ago
Renter moved in on average 3 years ago
Private vs. public school enrollment:
Students in private schools in grades 1 to 8 (elementary and middle school): 23 Students in private schools in grades 9 to 12 (high school): 9 Students in private undergraduate colleges: 142