Selinsgrove, PA (Pennsylvania) Houses and Residents
| Selinsgrove: | $209,684 |
| Pennsylvania: | $245,500 |
Mean price in 2022:
Detached houses: $238,908
Here: $238,908 State: $317,202 Townhouses or other attached units: $121,509
Here: $121,509 State: $254,369 In 2-unit structures: $263,401
Here: $263,401 State: $249,182
Total population: 5,790 (Urban population: 5,383 (all inside urban clusters), Rural population: 0)
Houses: 1,938 (1,753 occupied: 891 owner occupied, 876 renter occupied)
| % of renters here: | 50% |
| State: | 31% |
Housing density: 1,005 houses/condos per square mile
Median price asked for vacant for-sale houses and condos in 2022: $465,203.
Median contract rent in 2022: $704 (lower quartile is $580, upper quartile is $912)
Median rent asked for vacant for-rent units in 2022: $3,186
Median gross rent in Selinsgrove, PA in 2022: $914
Housing units in Selinsgrove with a mortgage: 439 (20 second mortgage, 0 home equity loan, 20 both second mortgage and home equity loan)
Houses without a mortgage: 35
Median household income for houses/condos with a mortgage: $98,992
Median household income for apartments without a mortgage: $56,737
Median monthly housing costs: $873
Compare current foreclosures near Selinsgrove, PA:
| Photo | Address | Area | Beds / Baths | Price | Details |
|---|---|---|---|---|---|

|
#1
N Old Trl
Selinsgrove, PA 17870
|
- sq. feet
|
- baths - beds |
show details | |

|
#2
Twin Oaks Ln
Selinsgrove, PA 17870
|
- sq. feet
|
- baths - beds |
show details | |

|
#3
Sunset Dr
Selinsgrove, PA 17870
|
- sq. feet
|
- baths - beds |
show details | |

|
#4
Devon Ct
Selinsgrove, PA 17870
|
- sq. feet
|
- baths - beds |
show details | |

|
#5
Scholls Aly
Selinsgrove, PA 17870
|
- sq. feet
|
- baths - beds |
show details | |

|
#6
Avenue F
Danville, PA 17821
|
1,600 sq. feet
|
2 baths 3 beds |
$279,500
|
show details |

|
#7
Pleasant Dr
Selinsgrove, PA 17870
|
- sq. feet
|
- baths - beds |
show details | |

|
#8
Old School Rd
Selinsgrove, PA 17870
|
- sq. feet
|
- baths - beds |
show details | |

|
#9
Hawk Ln
Selinsgrove, PA 17870
|
- sq. feet
|
- baths - beds |
show details | |

|
#10
Grayson View Ct
Selinsgrove, PA 17870
|
- sq. feet
|
- baths - beds |
show details |
| Photo | Address | Area | Beds / Baths | Price | Details |
|---|---|---|---|---|---|

|
#11
N Market St
Selinsgrove, PA 17870
|
- sq. feet
|
- baths - beds |
show details | |

|
#12
S Market St
Selinsgrove, PA 17870
|
- sq. feet
|
- baths - beds |
show details | |

|
#13
W Library Ave
Danville, PA 17821
|
1,191 sq. feet
|
1 baths 2 beds |
show details | |

|
#14
Merand Ln
Mifflinburg, PA 17844
|
1,565 sq. feet
|
2 baths 3 beds |
show details | |

|
#15
Jpm Rd
Lewisburg, PA 17837
|
1,922 sq. feet
|
2 baths 5 beds |
show details | |

|
#16
E Cameron St
Shamokin, PA 17872
|
1,072 sq. feet
|
1 baths 3 beds |
show details | |

|
#17
East Market Street
Gratz, PA 17030
|
- sq. feet
|
2 baths 3 beds |
show details | |

|
#18
Ridge Rd
Klingerstown, PA 17941
|
1,248 sq. feet
|
1 baths 3 beds |
show details | |

|
#19
Luxemburg Rd
Elizabethville, PA 17023
|
2,244 sq. feet
|
2 baths 2 beds |
show details | |

|
#20
N Star Blvd
Milton, PA 17847
|
- sq. feet
|
- baths - beds |
show details |
| Photo | Address | Area | Beds / Baths | Price | Details |
|---|---|---|---|---|---|

|
#21
N Crossroads Rd
Elizabethville, PA 17023
|
- sq. feet
|
- baths - beds |
show details | |

|
#22
State Route 225
Elizabethville, PA 17023
|
- sq. feet
|
- baths - beds |
show details | |

|
#23
Thomas St
Mifflinburg, PA 17844
|
- sq. feet
|
- baths - beds |
show details | |

|
#24
Aspen St
Mifflinburg, PA 17844
|
- sq. feet
|
- baths - beds |
show details | |

|
#25
W Montgomery St
Coal Township, PA 17866
|
- sq. feet
|
- baths - beds |
show details | |

|
#26
Mainzer Hill Rd
Danville, PA 17821
|
- sq. feet
|
- baths - beds |
show details | |

|
#27
Sunbury Rd
Danville, PA 17821
|
- sq. feet
|
- baths - beds |
show details | |

|
#28
Kellys Dam Rd # 312
Danville, PA 17821
|
- sq. feet
|
- baths - beds |
show details | |

|
#29
Specktown Rd
Lykens, PA 17048
|
- sq. feet
|
- baths - beds |
show details | |

|
#30
W Chestnut St
Shamokin, PA 17872
|
- sq. feet
|
- baths - beds |
show details |
| Photo | Address | Area | Beds / Baths | Price | Details |
|---|---|---|---|---|---|

|
#31
N 6th St
Shamokin, PA 17872
|
- sq. feet
|
- baths - beds |
show details | |

|
#32
Cummings St
Milton, PA 17847
|
- sq. feet
|
- baths - beds |
show details | |

|
#33
Hillside Ave
Elysburg, PA 17824
|
- sq. feet
|
- baths - beds |
show details | |

|
#34
Grand St
Danville, PA 17821
|
- sq. feet
|
- baths - beds |
show details | |

|
#35
N 3rd St Apt 2
Lewisburg, PA 17837
|
- sq. feet
|
- baths - beds |
show details | |

|
#36
E Front St
Danville, PA 17821
|
- sq. feet
|
- baths - beds |
show details | |

|
#37
State Route 61
Sunbury, PA 17801
|
- sq. feet
|
- baths - beds |
show details | |

|
#38
Reagan St # B
Sunbury, PA 17801
|
- sq. feet
|
- baths - beds |
show details | |

|
#39
Brush Valley Rd
Sunbury, PA 17801
|
- sq. feet
|
- baths - beds |
show details | |

|
#40
Fisher Ave
Lewisburg, PA 17837
|
- sq. feet
|
- baths - beds |
show details |
| Photo | Address | Area | Beds / Baths | Price | Details |
|---|---|---|---|---|---|

|
#41
Susquehanna Rd
Northumberland, PA 17857
|
- sq. feet
|
- baths - beds |
show details | |

|
#42
N 8th St
Trevorton, PA 17881
|
- sq. feet
|
- baths - beds |
show details | |

|
#43
N 7th St
Shamokin, PA 17872
|
- sq. feet
|
- baths - beds |
show details | |

|
#44
Fairmount Ave
Sunbury, PA 17801
|
- sq. feet
|
- baths - beds |
show details | |

|
#45
Edison Ave
Sunbury, PA 17801
|
- sq. feet
|
- baths - beds |
show details | |

|
#46
W Pine St
Coal Township, PA 17866
|
- sq. feet
|
- baths - beds |
show details | |

|
#47
W Mulberry St
Shamokin, PA 17872
|
- sq. feet
|
- baths - beds |
show details | |

|
#48
Reagan St
Sunbury, PA 17801
|
- sq. feet
|
- baths - beds |
show details | |

|
#49
N 6th St
Shamokin, PA 17872
|
- sq. feet
|
- baths - beds |
show details | |

|
Check over 1 million property listings on Foreclosure.com!
|
browse all offers | |||

Latest news about housing in Selinsgrove, PA collected exclusively by city-data.com from local newspapers, TV, and radio stations

 | Affordable "small" towns with beautiful houses and downtowns? (58 replies) |
| Should I move to Shamokin? (20 replies) |
| Selinsgrove Nursing Homes (9 replies) |
| Shamokin, Pennsylvania (36 replies) |
| "On the Strip in Selinsgrove" (617 replies) |
| Selinsgrove Area Indoor Motor Home Storage (0 replies) |

Median year apartment built: 1954
Household type by relationship:
Households: 5,702- Male householders: 799 (337 living alone), Female householders: 932 (483 living alone)
596 spouses (591 opposite-sex spouses), 142 unmarried partners, (121 opposite-sex unmarried partners), 668 children (550 natural, 45 adopted, 71 stepchildren), 0 grandchildren, 97 brothers or sisters, 0 parents, 19 foster children, 44 other relatives, 10 non-relatives
- In group quarters: 2,388
Size of family households: 493 2-persons, 163 3-persons, 93 4-persons, 43 5-persons.
Size of nonfamily households: 848 1-person, 141 2-persons.
230 married couples with children.
232 single-parent households (35 men, 197 women).
91.9% of residents of Selinsgrove speak English at home.
2.6% of residents speak Spanish at home (81% speak English very well, 19% speak English well).
2.6% of residents speak other Indo-European language at home (100% speak English very well).
1.6% of residents speak Asian or Pacific Island language at home (100% speak English very well).
0.8% of residents speak other language at home (100% speak English very well).
Foreign born population: 89 (1.6%)
(51.7% of them are naturalized citizens)
| Here: | 6.6 |
| State: | 6.8 |
| Here: | 4.1 |
| State: | 4.3 |

- Bedrooms in owner-occupied houses and condos in Selinsgrove, Pennsylvania
- 0no bedroom
- 91 bedroom
- 1292 bedrooms
- 4843 bedrooms
- 2544 bedrooms
- 155+ bedrooms

- Bedrooms in renter-occupied apartments in Selinsgrove, Pennsylvania
- 46no bedroom
- 2251 bedroom
- 3292 bedrooms
- 2283 bedrooms
- 484 bedrooms
- 05+ bedrooms

- Cars and other vehicles available in Selinsgrove in owner-occupied houses/condos
- 22no vehicle
- 2971 vehicle
- 4072 vehicles
- 943 vehicles
- 604 vehicles
- 125+ vehicles

- Cars and other vehicles available in Selinsgrove in renter-occupied apartments
- 168no vehicle
- 4671 vehicle
- 2422 vehicles
- 03 vehicles
- 04 vehicles
- 05+ vehicles

- Rooms in owner-occupied houses in Selinsgrove, Pennsylvania
- 01 room
- 02 rooms
- 03 rooms
- 584 rooms
- 1275 rooms
- 2476 rooms
- 1397 rooms
- 1498 rooms
- 1729+ rooms

- Rooms in renter-occupied apartments in Selinsgrove, Pennsylvania
- 461 room
- 762 rooms
- 1023 rooms
- 3674 rooms
- 805 rooms
- 706 rooms
- 157 rooms
- 728 rooms
- 489+ rooms


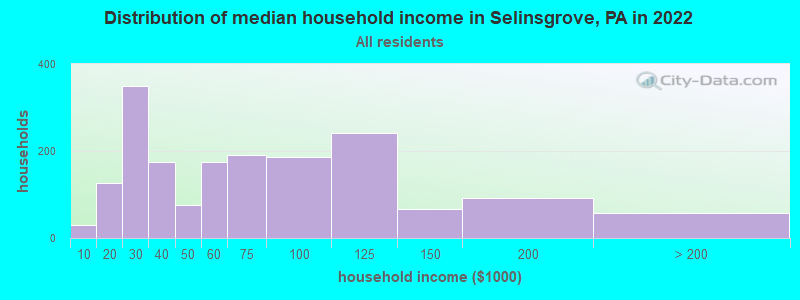
Selinsgrove, PA household income distribution

- 30Less than $10,000
- 126$10,000 to $19,999
- 350$20,000 to $29,999
- 174$30,000 to $39,999
- 76$40,000 to $49,999
- 174$50,000 to $59,999
- 191$60,000 to $74,999
- 186$75,000 to $99,999
- 242$100,000 to $124,999
- 67$125,000 to $149,999
- 92$150,000 to $199,999
- 57$200,000 or more
Home value of owner - occupied houses in 2022 in Selinsgrove, PA
-
- 8$15,000 to $19,999
- 11$60,000 to $69,999
- 12$70,000 to $79,999
- 10$80,000 to $89,999
- 22$90,000 to $99,999
- 83$100,000 to $124,999
- 56$125,000 to $149,999
- 82$150,000 to $174,999
- 144$175,000 to $199,999
- 185$200,000 to $249,999
- 52$250,000 to $299,999
- 146$300,000 to $399,999
- 19$400,000 to $499,999
- 3$2,000,000 or more
Rent paid by renters in 2022 in Selinsgrove, PA
-
- 7$250 to $299
- 34$300 to $349
- 32$400 to $449
- 61$450 to $499
- 8$500 to $549
- 64$550 to $599
- 54$600 to $649
- 159$650 to $699
- 77$700 to $749
- 16$750 to $799
- 97$800 to $899
- 26$900 to $999
- 119$1,000 to $1,249
- 5$1,250 to $1,499
- 44$1,500 to $1,999
- 58No cash rent


Percentage of workers working in this county: 83.0%
Number of people working at home: 309 (10.5% of all workers)
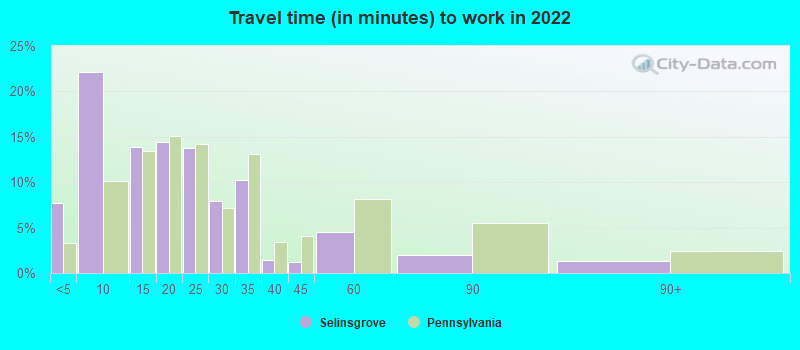
Travel time to work (commute)
- Less than 5 minutes: 331
- 5 to 9 minutes: 898
- 10 to 14 minutes: 378
- 15 to 19 minutes: 231
- 20 to 24 minutes: 393
- 25 to 29 minutes: 55
- 30 to 34 minutes: 104
- 35 to 39 minutes: 11
- 40 to 44 minutes: 69
- 45 to 59 minutes: 101
- 60 to 89 minutes: 15
- 90 or more minutes: 23
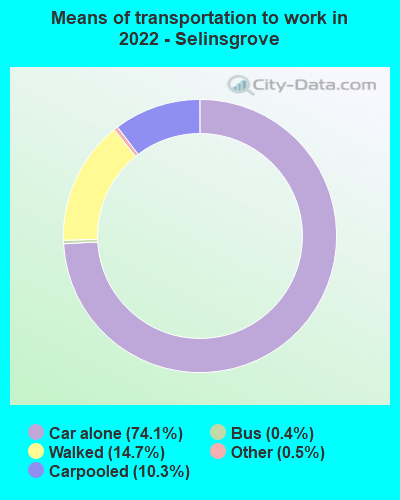
Means of transportation to work:
- Drove a car alone: 3,535 (68.3%)
- Carpooled: 489 (9.5%)
- Bus: 13 (0.3%)
- Taxi: 28 (0.5%)
- Bicycle: 2 (0.0%)
- Walked: 704 (13.6%)
- Worked at home: 309 (6.0%)

- Unemployment by race in 2022
- Unemployment rate for White non-Hispanic residents
- 0.4%Males
- 1.5%Females
- Unemployment rate for two or more race residents
- 14.1%Males
- Unemployment rate for Hispanic or Latino residents
- 27.4%Males

- Year of entry for the foreign-born population in Selinsgrove, Pennsylvania
- 512010 or later
- 432000 to 2009
- 01990 to 1999
- 461980 to 1989
- 01970 to 1979
- 24Before 1970

First ancestries reported:
- German: 834 (42.1%)
- English: 131 (6.6%)
- American: 128 (6.5%)
- Irish: 115 (5.8%)
- Greek: 71 (3.6%)
- Scottish: 61 (3.1%)
- Polish: 49 (2.5%)
- Italian: 43 (2.2%)
- French Canadian: 38 (1.9%)
- Pennsylvania German: 32 (1.6%)
- European: 26 (1.3%)
- Welsh: 26 (1.3%)
- Russian: 21 (1.1%)
- British: 14 (0.7%)
- Danish: 10 (0.5%)
- Austrian: 9 (0.5%)
- Dutch: 9 (0.5%)
- Scotch-Irish: 9 (0.5%)
- Swedish: 8 (0.4%)
- Czech: 7 (0.4%)
- Swiss: 6 (0.3%)
- Nigerian: 5 (0.3%)
- Portuguese: 4 (0.2%)
Most common places of birth for foreign-born residents (%):
| Selinsgrove: | 103.4% (92) |
| Pennsylvania: | 0.0% (270) |
| Selinsgrove: | 49.4% (44) |
| Pennsylvania: | 7.2% (67,704) |
Place of birth for U.S.-born residents:
- This state: 3,986
- Other state: 1,587
- Northeast: 846
- Midwest: 170
- South: 494
- West: 72
61.5% of Selinsgrove residents lived in the same house 1 years ago.
Out of people who lived in different houses, 27.9% lived in this county.
Out of people who lived in different counties, 56.4% lived in Pennsylvania.
| Selinsgrove: | 61.5% |
| State average: | 89.3% |
Education attainment for males 25 years and older:
- No schooling: 28
- Nursery to 4th grade: 0
- 5th and 6th grade: 0
- 7th and 8th grade: 47
- 9th grade: 4
- 10th grade: 0
- 11th grade: 45
- 12th grade, no diploma: 0
- High school graduate (or equivalency): 356
- Less than 1 year of college: 44
- Some college more than 1 year, no degree: 136
- Associate degree: 223
- Bachelor's degree: 304
- Master's degree: 107
- Professional school degree: 7
- Doctorate degree: 30

Education attainment for females 25 years and older:
- No schooling: 0
- Nursery to 4th grade: 0
- 5th and 6th grade: 0
- 7th and 8th grade: 41
- 9th grade: 0
- 10th grade: 71
- 11th grade: 18
- 12th grade, no diploma: 0
- High school graduate (or equivalency): 407
- Less than 1 year of college: 104
- Some college more than 1 year, no degree: 134
- Associate degree: 100
- Bachelor's degree: 309
- Master's degree: 219
- Professional school degree: 35
- Doctorate degree: 20


Housing units in structures:
- One, detached: 1,070
- One, attached: 240
- Two: 250
- 3 or 4: 164
- 5 to 9: 33
- 10 to 19: 83
- 20 to 49: 39
- 50 or more: 45
- Mobile homes: 10
Housing units lacking complete kitchen facilities in 2022: 2.2%
House/condo owner moved in on average 18 years ago
Renter moved in on average 1 years ago

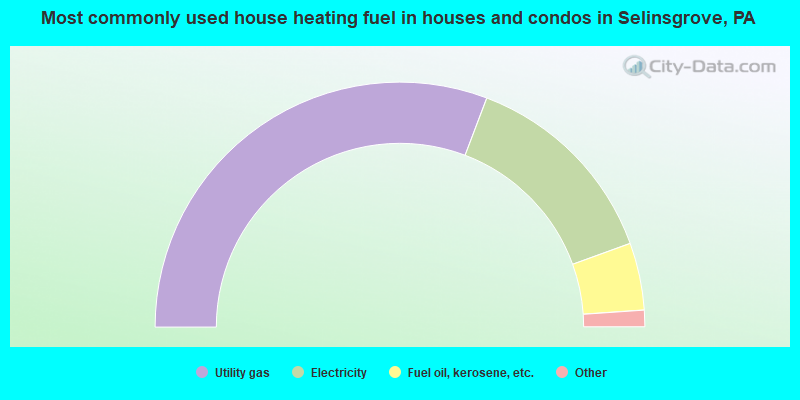
- 61.6%Utility gas
- 27.4%Electricity
- 8.9%Fuel oil, kerosene, etc.
- 1.3%Other fuel
- 0.8%Bottled, tank, or LP gas
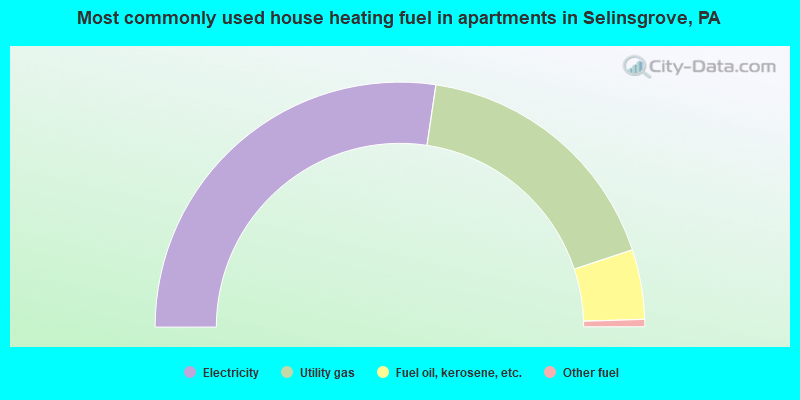
- 54.7%Electricity
- 35.1%Utility gas
- 9.2%Fuel oil, kerosene, etc.
- 1.0%Other fuel
Private vs. public school enrollment:
| Here: | 0.0% |
| Pennsylvania: | 15.7% |
| Here: | 0.0% |
| Pennsylvania: | 13.4% |
| Here: | 99.0% |
| Pennsylvania: | 39.8% |


