Selma, AL (Alabama) Houses and Residents
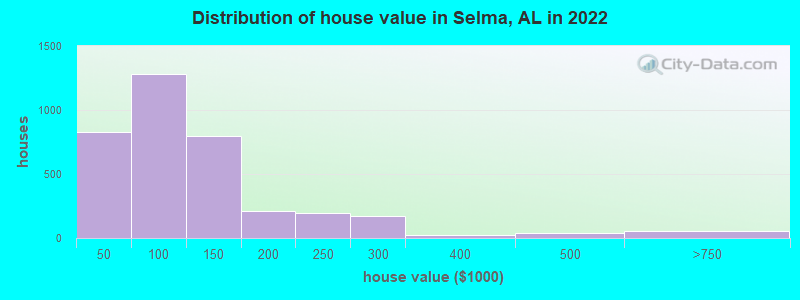
Estimated median house or condo value in 2022: $103,810 (it was $61,800 in 2000 )
Selma:
$103,810Alabama:
$200,900
Lower value quartile - upper value quartile: $53,832 - $154,272Total population: 19,814 (All urban)
Houses: 9,493 (7,594 occupied: 3,636 owner occupied, 4,141 renter occupied )
% of renters here:
53%State:
30%
Housing density: 685 houses/condos per square mile
Median price asked for vacant for-sale houses and condos in 2022: $89,482.
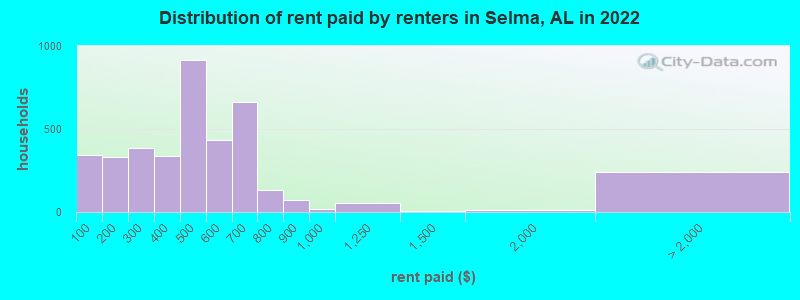
Median contract rent in 2022: $446 (lower quartile is $277, upper quartile is $605)
Median rent asked for vacant for-rent units in 2022: $465
Median gross rent in Selma, AL in 2022: $670
Housing units in Selma with a mortgage: 1,433 (50 second mortgage, 0 home equity loan, 23 both second mortgage and home equity loan )Houses without a mortgage: 58
Median household income for houses/condos with a mortgage: $64,458
Median household income for apartments without a mortgage: $39,531
Median monthly housing costs: $632
Data:
Median house or condo value ($)
Median house or condo value ($ change since 2000)
Median house or condo value ($) - White
Median house or condo value ($) - Black or African American
Median house or condo value ($) - Asian
Median house or condo value ($) - Hispanic or Latino
Median house or condo value ($) - American Indian and Alaska Native
Median house or condo value ($) - Multirace
Median house or condo value ($) - Other Race
Median price asked for mobile homes ($)
Household density (households per square mile)
Mean house or condo value by units in structure - 1, detached ($)
Mean house or condo value by units in structure - 1, attached ($)
Mean house or condo value by units in structure - 2 ($)
Mean house or condo value by units in structure by units in structure - 3 or 4 ($)
Mean house or condo value by units in structure - 5 or more ($)
Mean house or condo value by units in structure - Boat, RV, van, etc. ($)
Mean house or condo value by units in structure - Mobile home ($)
Median contract rent ($)
Median contract rent - Lower quartile ($)
Median contract rent - Upper quartile ($)
Median gross rent ($)
Urban houses (%)
Rural houses (%)
Houses occupied (%)
Houses occupied (% change since 2000)
Houses owner occupied (%)
Houses owner occupied (% change since 2000)
Houses renter occupied (%)
Houses renter occupied (% change since 2000)
Vacant housing units - For rent (%)
Vacant housing units - For rent (% change since 2000)
Vacant housing units - For sale only (%)
Vacant housing units - For sale only (% change since 2000)
Vacant housing units - Rented or sold, not occupied (%)
Vacant housing units - Rented or sold, not occupied (% change since 2000)
Vacant housing units - For seasonal, recreational, or occasional use (%)
Vacant housing units - For seasonal, recreational, or occasional use (% change since 2000)
Vacant housing units - For migrant workers (%)
Vacant housing units - For migrant workers (% change since 2000)
Vacant housing units - Other vacant (%)
Vacant housing units - Other vacant (% change since 2000)
Median monthly housing costs ($)
Median household income for houses/condos with a mortgage ($)
Median household income for houses/condos without a mortgage ($)
Median household income ($)
Median household income ($) - White
Median household income ($) - Black or African American
Median household income ($) - Asian
Median household income ($) - Hispanic or Latino
Median household income ($) - American Indian and Alaska Native
Median household income ($) - Multirace
Median household income ($) - Other Race
Mortgage status - with mortgage (%)
Mortgage status - with second mortgage (%)
Mortgage status - with home equity loan (%)
Mortgage status - with both second mortgage and home equity loan (%)
Mortgage status - without a mortgage (%)
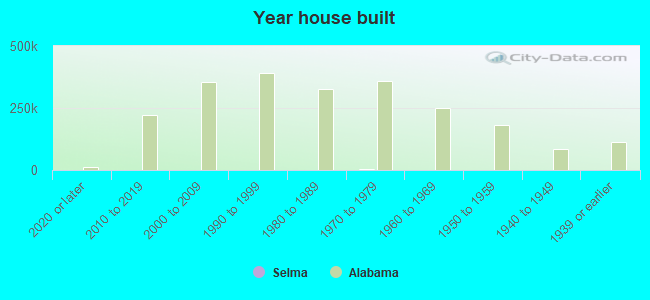
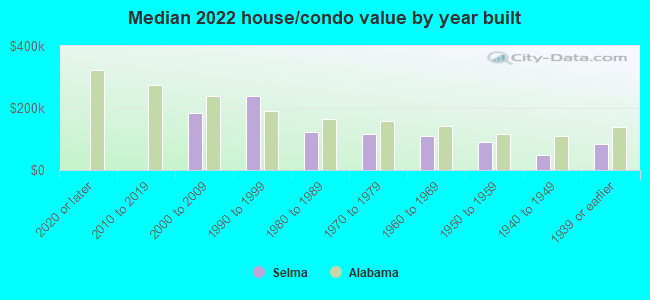
Median year house/condo built
Median year apartment built
Household type by relationship - Male householder living alone (%)
Household type by relationship - Male householder not living alone (%)
Household type by relationship - Female householder living alone (%)
Household type by relationship - Female householder not living alone (%)
Household type by relationship - Opposite-Sex spouse (%)
Household type by relationship - Same-Sex spouse (%)
Household type by relationship - Opposite-Sex unmarried partner (%)
Household type by relationship - Same-Sex unmarried partner (%)
Household type by relationship - In group quarters (%)
Size of family households - 2-person household (%)
Size of family households - 3-person household (%)
Size of family households - 4-person household (%)
Size of family households - 5-person household (%)
Size of family households - 6-person household (%)
Size of family households - 7-or-more-person household (%)
Size of nonfamily households - 1-person household (%)
Size of nonfamily households - 2-person household (%)
Size of nonfamily households - 3-person household (%)
Size of nonfamily households - 4-person household (%)
Size of nonfamily households - 5-person household (%)
Size of nonfamily households - 6-person household (%)
Size of nonfamily households - 7-or-moreperson household (%)
Year house built - Built 2010 or later (%)
Year house built - Built 2000 to 2009 (%)
Year house built - Built 1990 to 1999 (%)
Year house built - Built 1980 to 1989 (%)
Year house built - Built 1970 to 1979 (%)
Year house built - Built 1960 to 1969 (%)
Year house built - Built 1950 to 1959 (%)
Year house built - Built 1940 to 1949 (%)
Year house built - Built 1939 or earlier (%)
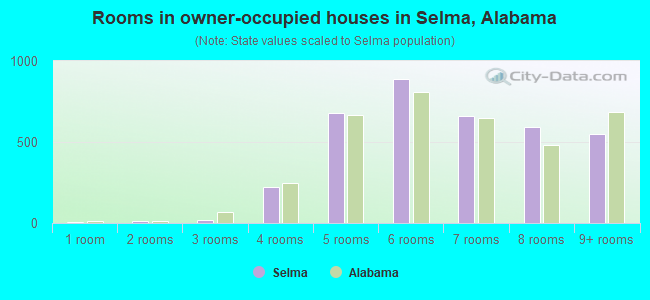
Median number of rooms in houses and condos
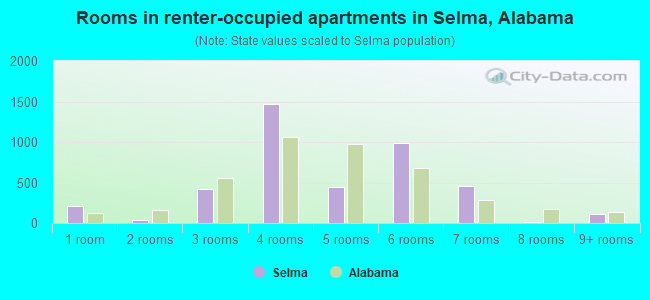
Median number of rooms in apartments
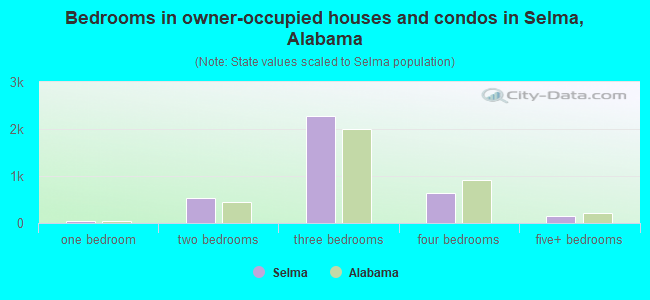
Median number of bedrooms in owner occupied houses
Mean number of bedrooms in owner occupied houses
Median number of bedrooms in renter occupied houses
Mean number of bedrooms in renter occupied houses
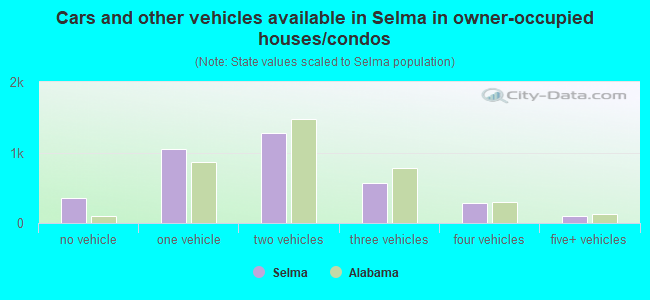
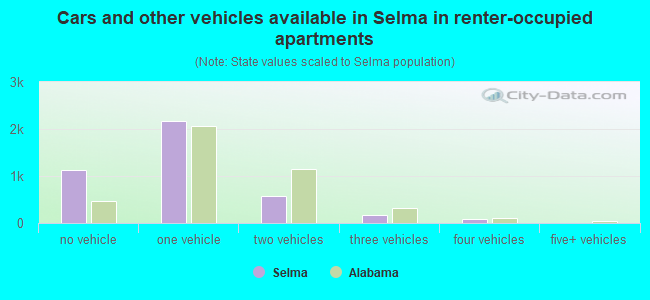
Median number of vehichles in owner occupied houses
Mean number of vehichles in owner occupied houses
Median number of vehichles in renter occupied houses
Mean number of vehichles in renter occupied houses
Rooms in owner-occupied houses - 1 room (%)
Rooms in owner-occupied houses - 2 rooms (%)
Rooms in owner-occupied houses - 3 rooms (%)
Rooms in owner-occupied houses - 4 rooms (%)
Rooms in owner-occupied houses - 5 rooms (%)
Rooms in owner-occupied houses - 6 rooms (%)
Rooms in owner-occupied houses - 7 rooms (%)
Rooms in owner-occupied houses - 8 rooms (%)
Rooms in owner-occupied houses - 9+ rooms (%)
Rooms in renter-occupied houses - 1 room (%)
Rooms in renter-occupied houses - 2 rooms (%)
Rooms in renter-occupied houses - 3 rooms (%)
Rooms in renter-occupied houses - 4 rooms (%)
Rooms in renter-occupied houses - 5 rooms (%)
Rooms in renter-occupied houses - 6 rooms (%)
Rooms in renter-occupied houses - 7 rooms (%)
Rooms in renter-occupied houses - 8 rooms (%)
Rooms in renter-occupied houses - 9+ rooms (%)
Bedrooms in owner-occupied houses - no bedrooms (%)
Bedrooms in owner-occupied houses - 1 bedroom (%)
Bedrooms in owner-occupied houses - 2 bedrooms (%)
Bedrooms in owner-occupied houses - 3 bedrooms (%)
Bedrooms in owner-occupied houses - 4 bedrooms (%)
Bedrooms in owner-occupied houses - 5+ bedrooms (%)
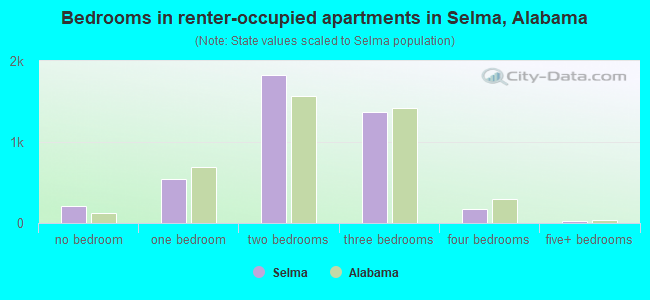
Bedrooms in renter-occupied houses - no bedrooms (%)
Bedrooms in renter-occupied houses - 1 bedroom (%)
Bedrooms in renter-occupied houses - 2 bedrooms (%)
Bedrooms in renter-occupied houses - 3 bedrooms (%)
Bedrooms in renter-occupied houses - 4 bedrooms (%)
Bedrooms in renter-occupied houses - 5+ bedrooms (%)
Vehicles available in owner-occupied houses - no vehicle available (%)
Vehicles available in owner-occupied houses - 1 vehicle available(%)
Vehicles available in owner-occupied houses - 2 Vehicles available (%)
Vehicles available in owner-occupied houses - 3 Vehicles available (%)
Vehicles available in owner-occupied houses - 4 Vehicles available (%)
Vehicles available in owner-occupied houses - 5+ Vehicles available (%)
Vehicles available in renter-occupied houses - no vehicle available (%)
Vehicles available in renter-occupied houses - 1 vehicle available (%)
Vehicles available in renter-occupied houses - 2 Vehicles available (%)
Vehicles available in renter-occupied houses - 3 Vehicles available (%)
Vehicles available in renter-occupied houses - 4 Vehicles available (%)
Vehicles available in renter-occupied houses - 5+ Vehicles available (%)
Housing units in structures - 1, detached (%)
Housing units in structures - 1, attached (%)
Housing units in structures - 2 (%)
Housing units in structures - 3 or 4 (%)
Housing units in structures - 5 to 9 (%)
Housing units in structures - 10 to 19 (%)
Housing units in structures - 20 to 49 (%)
Housing units in structures - 50 or more (%)
Housing units in structures - Mobile home (%)
Housing units in structures - Boat, RV, van, etc. (%)
Housing units in structures - Owners - 1, detached (%)
Housing units in structures - Owners - 1, attached (%)
Housing units in structures - Owners - 2 (%)
Housing units in structures - Owners - 3 or 4 (%)
Housing units in structures - Owners - 5 to 9 (%)
Housing units in structures - Owners - 10 to 19 (%)
Housing units in structures - Owners - 20 to 49 (%)
Housing units in structures - Owners - 50 or more (%)
Housing units in structures - Owners - Mobile home (%)
Housing units in structures - Owners - Boat, RV, van, etc. (%)
Housing units in structures - Renters - 1, detached (%)
Housing units in structures - Renters - 1, attached (%)
Housing units in structures - Renters - 2 (%)
Housing units in structures - Renters - 3 or 4 (%)
Housing units in structures - Renters - 5 to 9 (%)
Housing units in structures - Renters - 10 to 19 (%)
Housing units in structures - Renters - 20 to 49 (%)
Housing units in structures - Renters - 50 or more (%)
Housing units in structures - Renters - Mobile home (%)
Housing units in structures - Renters - Boat, RV, van, etc. (%)
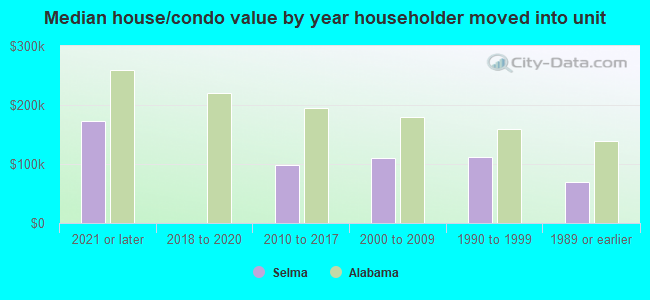
House/condo owner moved in on average (years ago)
Renter moved in on average (years ago)
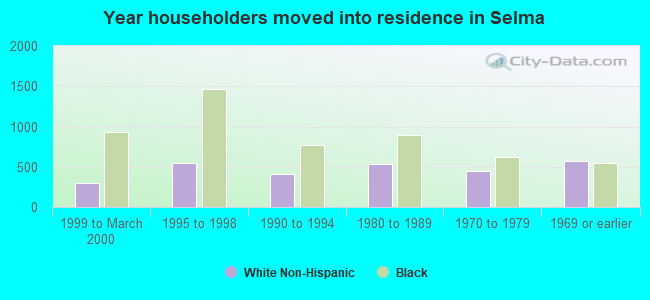
Year householder moved into unit - Moved in 1999 to March 2000 (%)
Year householder moved into unit - Moved in 1999 to March 2000 (%) - White
Year householder moved into unit - Moved in 1999 to March 2000 (%) - Black or African American
Year householder moved into unit - Moved in 1999 to March 2000 (%) - Asian
Year householder moved into unit - Moved in 1999 to March 2000 (%) - Hispanic or Latino
Year householder moved into unit - Moved in 1999 to March 2000 (%) - American Indian and Alaska Native
Year householder moved into unit - Moved in 1999 to March 2000 (%) - Multirace
Year householder moved into unit - Moved in 1999 to March 2000 (%) - Other Race
Year householder moved into unit - Moved in 1995 to 1998 (%)
Year householder moved into unit - Moved in 1995 to 1998 (%) - White
Year householder moved into unit - Moved in 1995 to 1998 (%) - Black or African American
Year householder moved into unit - Moved in 1995 to 1998 (%) - Asian
Year householder moved into unit - Moved in 1995 to 1998 (%) - Hispanic or Latino
Year householder moved into unit - Moved in 1995 to 1998 (%) - American Indian and Alaska Native
Year householder moved into unit - Moved in 1995 to 1998 (%) - Multirace
Year householder moved into unit - Moved in 1995 to 1998 (%) - Other Race
Year householder moved into unit - Moved in 1990 to 1994 (%)
Year householder moved into unit - Moved in 1990 to 1994 (%) - White
Year householder moved into unit - Moved in 1990 to 1994 (%) - Black or African American
Year householder moved into unit - Moved in 1990 to 1994 (%) - Asian
Year householder moved into unit - Moved in 1990 to 1994 (%) - Hispanic or Latino
Year householder moved into unit - Moved in 1990 to 1994 (%) - American Indian and Alaska Native
Year householder moved into unit - Moved in 1990 to 1994 (%) - Multirace
Year householder moved into unit - Moved in 1990 to 1994 (%) - Other Race
Year householder moved into unit - Moved in 1980 to 1989 (%)
Year householder moved into unit - Moved in 1980 to 1989 (%) - White
Year householder moved into unit - Moved in 1980 to 1989 (%) - Black or African American
Year householder moved into unit - Moved in 1980 to 1989 (%) - Asian
Year householder moved into unit - Moved in 1980 to 1989 (%) - Hispanic or Latino
Year householder moved into unit - Moved in 1980 to 1989 (%) - American Indian and Alaska Native
Year householder moved into unit - Moved in 1980 to 1989 (%) - Multirace
Year householder moved into unit - Moved in 1980 to 1989 (%) - Other Race
Year householder moved into unit - Moved in 1970 to 1979 (%)
Year householder moved into unit - Moved in 1970 to 1979 (%) - White
Year householder moved into unit - Moved in 1970 to 1979 (%) - Black or African American
Year householder moved into unit - Moved in 1970 to 1979 (%) - Asian
Year householder moved into unit - Moved in 1970 to 1979 (%) - Hispanic or Latino
Year householder moved into unit - Moved in 1970 to 1979 (%) - American Indian and Alaska Native
Year householder moved into unit - Moved in 1970 to 1979 (%) - Multirace
Year householder moved into unit - Moved in 1970 to 1979 (%) - Other Race
Year householder moved into unit - Moved in 1969 or earlier (%)
Year householder moved into unit - Moved in 1969 or earlier (%) - White
Year householder moved into unit - Moved in 1969 or earlier (%) - Black or African American
Year householder moved into unit - Moved in 1969 or earlier (%) - Asian
Year householder moved into unit - Moved in 1969 or earlier (%) - Hispanic or Latino
Year householder moved into unit - Moved in 1969 or earlier (%) - American Indian and Alaska Native
Year householder moved into unit - Moved in 1969 or earlier (%) - Multirace
Year householder moved into unit - Moved in 1969 or earlier (%) - Other Race
Housing units lacking complete plumbing facilities (%)
Housing units lacking complete kitchen facilities (%)
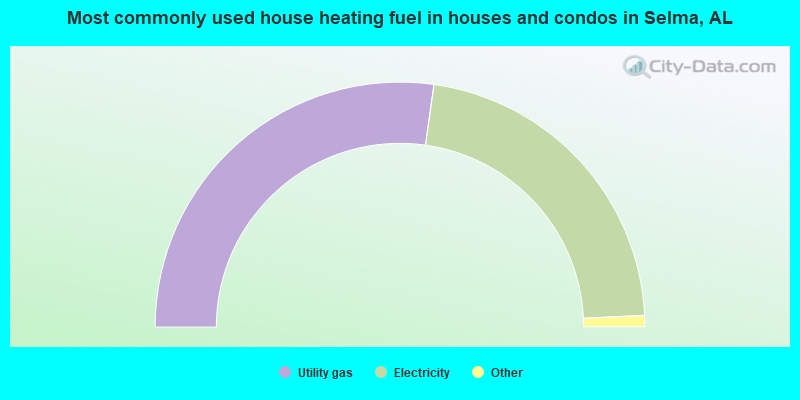
House heating fuel used in houses and condos - Utility gas (%)
House heating fuel used in houses and condos - Bottled, tank, or LP gas (%)
House heating fuel used in houses and condos - Electricity (%)
House heating fuel used in houses and condos - Fuel oil, kerosene, etc. (%)
House heating fuel used in houses and condos - Coal or coke (%)
House heating fuel used in houses and condos - Wood (%)
House heating fuel used in houses and condos - Solar energy (%)
House heating fuel used in houses and condos - Other fuel (%)
House heating fuel used in houses and condos - No fuel used (%)
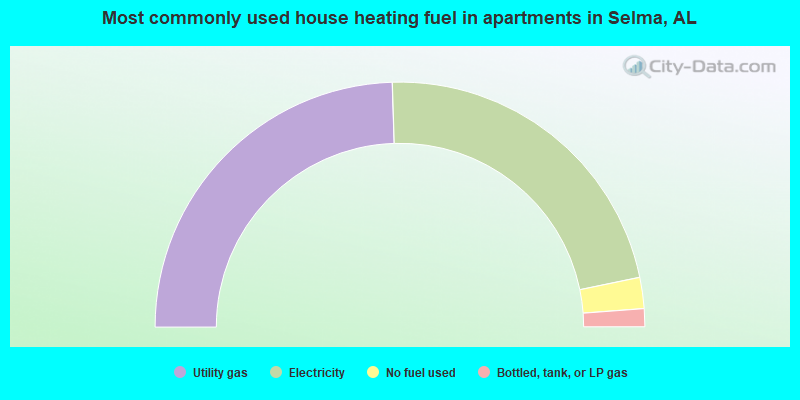
House heating fuel used in apartments - Utility gas (%)
House heating fuel used in apartments - Bottled, tank, or LP gas (%)
House heating fuel used in apartments - Electricity (%)
House heating fuel used in apartments - Fuel oil, kerosene, etc. (%)
House heating fuel used in apartments - Coal or coke (%)
House heating fuel used in apartments - Wood (%)
House heating fuel used in apartments - Solar energy (%)
House heating fuel used in apartments - Other fuel (%)
House heating fuel used in apartments - No fuel used (%)
Latest news about housing in Selma, AL collected exclusively by city-data.com from local newspapers, TV, and radio stations
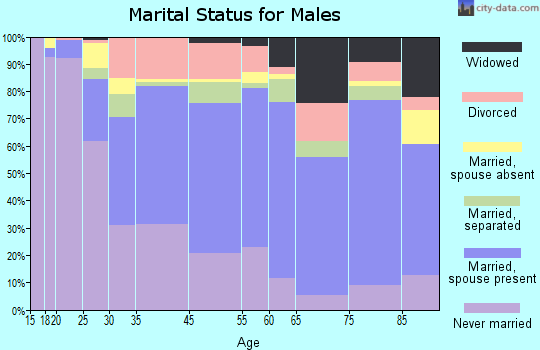
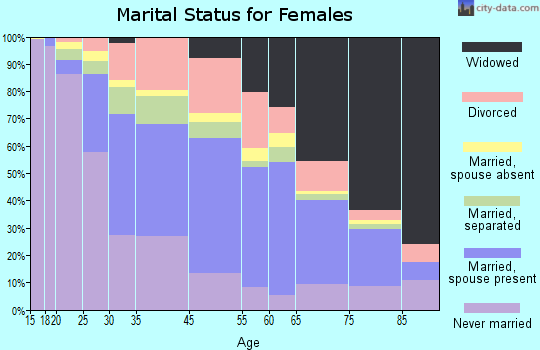
Median year house/condo built: 1965Median year apartment built: 1971Household type by relationship:
Households: 18,039
Male householders: 2,592 (1,059 living alone ), Female householders: 4,931 (2,553 living alone )1,586 spouses (1,575 opposite-sex spouses ), 218 unmarried partners , (211 opposite-sex unmarried partners ), 5,549 children (5,406 natural , 0 adopted , 143 stepchildren ), 1,293 grandchildren , 438 brothers or sisters , 143 parents , 74 foster children , 462 other relatives , 265 non-relatives In group quarters: 481
Size of family households: 1,887 2-persons , 1,173 3-persons , 336 4-persons , 337 5-persons , 67 6-persons , 64 7-or-more-persons .
Size of nonfamily households: 3,735 1-person , 201 2-persons .
773 married couples with children. single-parent households (105 men , 2,175 women ).
97.7% of residents of Selma speak English at home. of residents speak Spanish at home (35% speak English very well , 27% speak English well , 38% speak English not well ).of residents speak other Indo-European language at home (70% speak English very well , 30% speak English well ).of residents speak Asian or Pacific Island language at home (18% speak English well , 60% speak English not well , 23% don't speak English at all ).of residents speak other language at home (85% speak English very well , 15% speak English well ).
Foreign born population: 475 (2.6%)of them are naturalized citizens )
Median number of rooms in houses and condos:
Median number of rooms in apartments
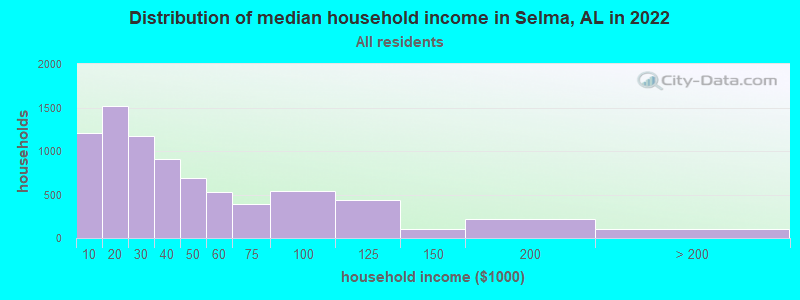
Selma, AL household income distribution 1,202 Less than $10,0001,513 $10,000 to $19,9991,167 $20,000 to $29,999907 $30,000 to $39,999687 $40,000 to $49,999528 $50,000 to $59,999388 $60,000 to $74,999545 $75,000 to $99,999436 $100,000 to $124,999105 $125,000 to $149,999218 $150,000 to $199,999109 $200,000 or more
Home value of owner - occupied houses in 2022 in Selma, AL 31 Less than $10,000126 $10,000 to $14,99912 $15,000 to $19,999108 $20,000 to $24,999143 $25,000 to $29,99930 $30,000 to $34,99980 $35,000 to $39,999290 $40,000 to $49,999179 $50,000 to $59,999154 $60,000 to $69,999171 $70,000 to $79,999286 $80,000 to $89,999198 $90,000 to $99,999492 $100,000 to $124,999302 $125,000 to $149,999137 $150,000 to $174,99972 $175,000 to $199,999192 $200,000 to $249,999168 $250,000 to $299,99922 $300,000 to $399,99936 $400,000 to $499,99933 $500,000 to $749,99918 $750,000 to $999,999Rent paid by renters in 2022 in Selma, AL 340 Less than $100198 $100 to $149133 $150 to $199108 $200 to $249273 $250 to $299201 $300 to $349137 $350 to $399575 $400 to $449338 $450 to $499303 $500 to $549128 $550 to $599458 $600 to $649203 $650 to $69948 $700 to $74984 $750 to $79971 $800 to $89920 $900 to $99951 $1,000 to $1,2495 $1,250 to $1,4999 $1,500 to $1,999239 No cash rent
Percentage of workers working in this county: 75.8%Number of people working at home: 371 (5.8% of all workers )
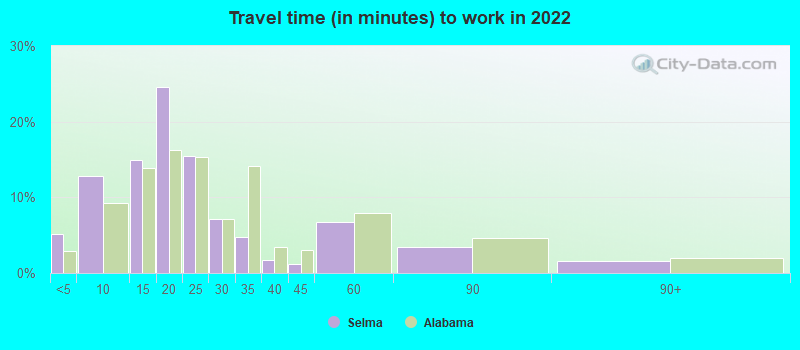
Travel time to work (commute)
Less than 5 minutes: 3435 to 9 minutes: 83210 to 14 minutes: 84315 to 19 minutes: 1,32520 to 24 minutes: 53825 to 29 minutes: 16230 to 34 minutes: 36335 to 39 minutes: 25440 to 44 minutes: 24445 to 59 minutes: 36560 to 89 minutes: 55990 or more minutes: 89
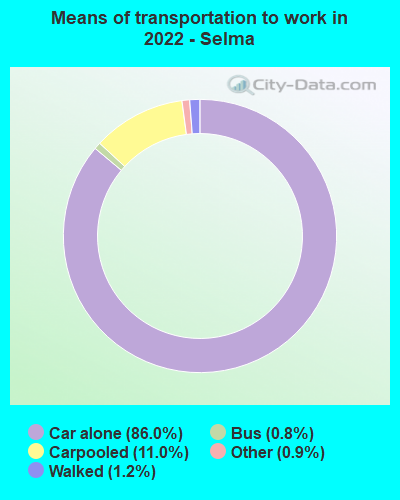
Means of transportation to work:
Drove a car alone: 6,920 (80.9%)Carpooled: 889 (10.4%)Bus : 57 (0.7%)Long-distance train or commuter rail : 8 (0.1%)Taxi: 96 (1.1%)Walked: 108 (1.3%)Worked at home: 371 (4.3%)
Unemployment by race in 2022
Unemployment rate for Black residents 9.4% Males18.2% FemalesUnemployment rate for American Indian and Alaska Native residents 100.0% FemalesUnemployment rate for Hispanic or Latino residents 42.4% Males
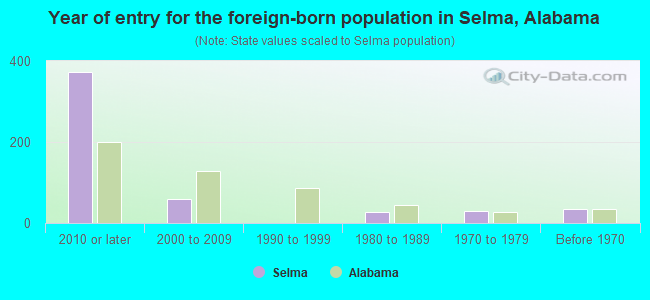
Year of entry for the foreign-born population in Selma, Alabama
373 2010 or later 60 2000 to 2009 0 1990 to 1999 26 1980 to 1989 30 1970 to 1979 34 Before 1970
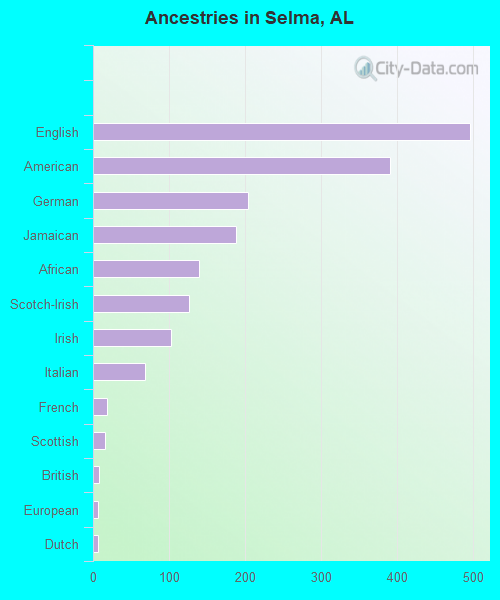
First ancestries reported:
English: 496 (3.7%)
American: 390 (2.9%)
German: 204 (1.5%)
Jamaican: 188 (1.4%)
African: 139 (1.0%)
Scotch-Irish: 126 (0.9%)
Irish: 103 (0.8%)
Italian: 69 (0.5%)
French: 19 (0.1%)
Scottish: 16 (0.1%)
British: 8 (0.06%)
European: 7 (0.05%)
Dutch: 6 (0.04%)
Swedish: 2 (0.01%) Most common places of birth for foreign-born residents (%): India Selma:
23.4% (105)Alabama:
5.5% (9,672)
Jamaica Selma:
22.7% (102)Alabama:
1.3% (2,382)
Germany Selma:
19.4% (87)Alabama:
3.9% (6,831)
Vietnam Selma:
13.6% (61)Alabama:
3.6% (6,414)
Ethiopia Selma:
4.9% (22)Alabama:
0.2% (319)
Canada Selma:
4.5% (20)Alabama:
2.3% (4,000)
Pakistan Selma:
3.6% (16)Alabama:
1.1% (2,005)
Other Eastern Africa Selma:
2.9% (13)Alabama:
0.1% (260)
United Kingdom, excluding England and Scotland Selma:
1.6% (7)Alabama:
1.2% (2,088)
Place of birth for U.S.-born residents:
This state: 15,302Other state: 2,059Northeast: 286Midwest: 597South: 733West: 427 85.9% of Selma residents lived in the same house 1 years ago.
Out of people who lived in different houses, 39.5% lived in this county.
Out of people who lived in different counties, 36.6% lived in Alabama.
Selma:
85.9%State average:
87.6%
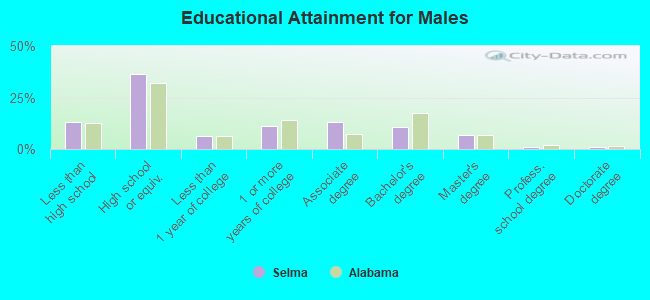
Education attainment for males 25 years and older:
No schooling: 56Nursery to 4th grade: 375th and 6th grade: 377th and 8th grade: 19th grade: 5810th grade: 10911th grade: 26812th grade, no diploma: 79High school graduate (or equivalency): 1,749Less than 1 year of college: 309Some college more than 1 year, no degree: 532Associate degree: 633Bachelor's degree: 524Master's degree: 335Professional school degree: 52Doctorate degree: 57
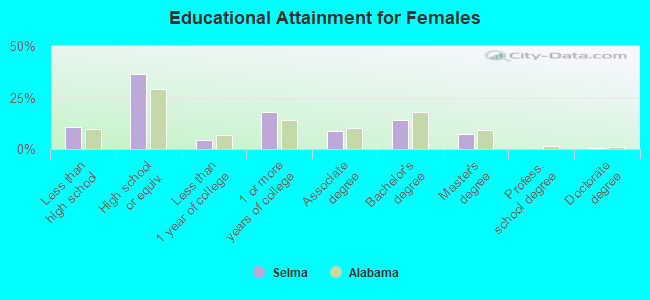
Education attainment for females 25 years and older:
No schooling: 87Nursery to 4th grade: 115th and 6th grade: 387th and 8th grade: 1069th grade: 8210th grade: 15511th grade: 10412th grade, no diploma: 159High school graduate (or equivalency): 2,542Less than 1 year of college: 308Some college more than 1 year, no degree: 1,235Associate degree: 616Bachelor's degree: 967Master's degree: 512Professional school degree: 0Doctorate degree: 31
Housing units in structures:
One, detached: 6,210One, attached: 81Two: 8673 or 4: 1,3855 to 9: 56710 to 19: 7520 to 49: 13050 or more: 113Mobile homes: 56Boats, RVs, vans, etc.: 6Housing units lacking complete plumbing facilities in 2022: 5.8%Housing units lacking complete kitchen facilities in 2022: 12.5%House/condo owner moved in on average 18 years ago
Renter moved in on average 7 years ago
Private vs. public school enrollment:
Students in private schools in grades 1 to 8 (elementary and middle school): 135 Students in private schools in grades 9 to 12 (high school): 292 Students in private undergraduate colleges: 38