Seven Oaks, SC (South Carolina) Houses and Residents
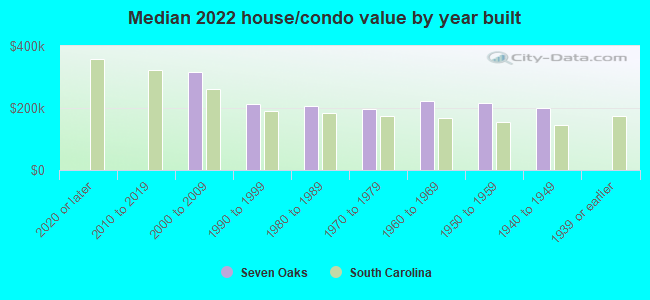
| Seven Oaks: | $204,513 |
| South Carolina: | $254,600 |
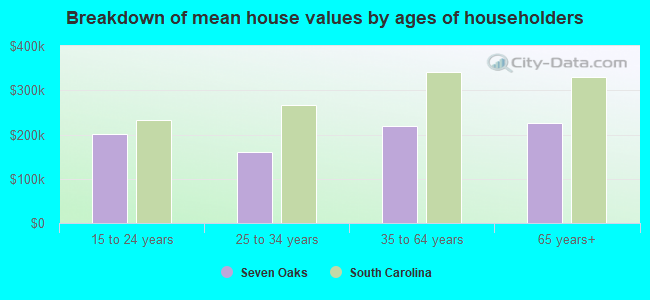
Mean price in 2022:
Detached houses: $229,960
Here: $229,960 State: $368,255 Townhouses or other attached units: $100,612
Here: $100,612 State: $292,023 In 5-or-more-unit structures: $99,358
Here: $99,358 State: $326,361 Mobile homes: $22,532
Here: $22,532 State: $102,531
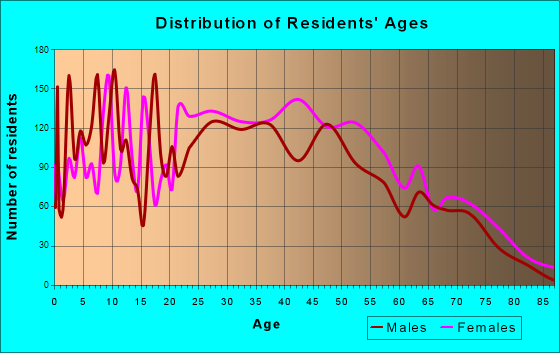
Total population: 15,144 (All urban)
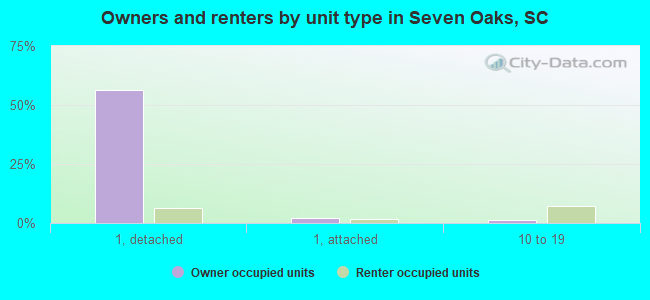
Houses: 7,481 (7,090 occupied: 4,397 owner occupied, 2,688 renter occupied)
| % of renters here: | 38% |
| State: | 28% |
Housing density: 953 houses/condos per square mile
Median price asked for vacant for-sale houses and condos in 2022 in this county: $361,416.
Median contract rent in 2022: $1,016 (lower quartile is $853, upper quartile is $1,147)
Median rent asked for vacant for-rent units in 2022: $914
Median gross rent in Seven Oaks, SC in 2022: $1,109
Housing units in Seven Oaks with a mortgage: 2,936 (280 second mortgage, 0 home equity loan, 257 both second mortgage and home equity loan)
Houses without a mortgage: 78
Median household income for houses/condos with a mortgage: $74,575
Median household income for apartments without a mortgage: $75,501
Median monthly housing costs: $1,020
Compare current foreclosures near Seven Oaks, SC:
| Photo | Address | Area | Beds / Baths | Price | Details |
|---|---|---|---|---|---|

|
#1
Brookview Rd
Columbia, SC 29212
|
1,721 sq. feet
|
2 baths 3 beds |
$275,000
|
show details |

|
#2
Boyd Shumpert Rd
Gaston, SC 29053
|
1,716 sq. feet
|
2 baths 4 beds |
$260,000
|
show details |

|
#3
Clover Bay Dr
Columbia, SC 29203
|
- sq. feet
|
2 baths 3 beds |
$99,000
|
show details |

|
#4
Hilton Village Dr
Chapin, SC 29036
|
3,239 sq. feet
|
3 baths 4 beds |
show details | |

|
#5
Madera Dr
Columbia, SC 29203
|
1,751 sq. feet
|
1 baths 3 beds |
show details | |

|
#6
Danby Ct
Columbia, SC 29212
|
2,044 sq. feet
|
2 baths 3 beds |
show details | |

|
#7
Bailey Island Cir
Lexington, SC 29072
|
1,763 sq. feet
|
2 baths 3 beds |
show details | |

|
#8
Overbranch Dr
Columbia, SC 29223
|
3,175 sq. feet
|
2 baths 3 beds |
show details | |

|
#9
Risdon Way
Columbia, SC 29223
|
1,262 sq. feet
|
2 baths 3 beds |
show details | |

|
#10
Crassula Dr
Lexington, SC 29073
|
1,362 sq. feet
|
2 baths 3 beds |
show details |
| Photo | Address | Area | Beds / Baths | Price | Details |
|---|---|---|---|---|---|

|
#11
Holmes Ave
Columbia, SC 29203
|
1,200 sq. feet
|
1 baths 3 beds |
show details | |

|
#12
Louisa Ln
Lexington, SC 29073
|
1,317 sq. feet
|
2 baths 3 beds |
show details | |

|
#13
Jones Rd
Irmo, SC 29063
|
3,717 sq. feet
|
4 baths 4 beds |
show details | |

|
#14
Frasier Fir Ln
Columbia, SC 29229
|
2,590 sq. feet
|
2 baths 4 beds |
show details | |

|
#15
Kennerly Rd
Irmo, SC 29063
|
2,967 sq. feet
|
2 baths 3 beds |
show details | |

|
#16
Ithica St
Columbia, SC 29204
|
2,046 sq. feet
|
2 baths 4 beds |
show details | |

|
#17
Wallace Cir
Lexington, SC 29073
|
1,596 sq. feet
|
2 baths 3 beds |
show details | |

|
#18
Ashley St
Columbia, SC 29203
|
875 sq. feet
|
1 baths 2 beds |
show details | |

|
#19
Emanuel Church Rd
West Columbia, SC 29170
|
1,419 sq. feet
|
2 baths 3 beds |
show details | |

|
#20
Foley Ln
Lexington, SC 29072
|
2,796 sq. feet
|
3 baths 6 beds |
show details |
| Photo | Address | Area | Beds / Baths | Price | Details |
|---|---|---|---|---|---|

|
#21
Tamara Ln
Gaston, SC 29053
|
2,128 sq. feet
|
3 baths 4 beds |
show details | |

|
#22
Duchess Trl
Lexington, SC 29073
|
2,083 sq. feet
|
3 baths 5 beds |
show details | |

|
#23
N High Duck Trl
Blythewood, SC 29016
|
3,800 sq. feet
|
3 baths 4 beds |
show details | |

|
#24
Common Reed Dr
Gilbert, SC 29054
|
1,793 sq. feet
|
2 baths 3 beds |
show details | |

|
#25
Ambergate Ln
Columbia, SC 29229
|
2,448 sq. feet
|
3 baths 5 beds |
show details | |

|
#26
Shawn Ct
Irmo, SC 29063
|
1,801 sq. feet
|
3 baths 4 beds |
show details | |

|
#27
Wilkinson Dr
Columbia, SC 29229
|
1,989 sq. feet
|
2 baths 4 beds |
show details | |

|
#28
Greenbank Dr
Lexington, SC 29073
|
1,582 sq. feet
|
2 baths 3 beds |
show details | |

|
#29
Appletree Ln
West Columbia, SC 29170
|
2,073 sq. feet
|
2 baths 3 beds |
show details | |

|
#30
Cross Field Rd
Gaston, SC 29053
|
1,960 sq. feet
|
2 baths 3 beds |
show details |
| Photo | Address | Area | Beds / Baths | Price | Details |
|---|---|---|---|---|---|

|
#31
Swanhaven Dr
Lexington, SC 29073
|
4,261 sq. feet
|
4 baths 5 beds |
show details | |

|
#32
Morningwood Dr
Lexington, SC 29073
|
1,995 sq. feet
|
3 baths 3 beds |
show details | |

|
#33
Fox Squirrel Cir
Columbia, SC 29209
|
1,693 sq. feet
|
2 baths 3 beds |
show details | |

|
#34
Stoneridge Ct
Blythewood, SC 29016
|
3,599 sq. feet
|
4 baths 5 beds |
show details | |

|
#35
Rainbow Cir
West Columbia, SC 29170
|
1,456 sq. feet
|
1 baths 2 beds |
show details | |

|
#36
Superior Cir
Chapin, SC 29036
|
2,342 sq. feet
|
2 baths 3 beds |
show details | |

|
#37
Clive St
Columbia, SC 29204
|
1,858 sq. feet
|
2 baths 3 beds |
show details | |

|
#38
Seabury St
Columbia, SC 29203
|
900 sq. feet
|
1 baths 3 beds |
show details | |

|
#39
Orangeburg St
Columbia, SC 29204
|
1,150 sq. feet
|
1 baths 3 beds |
show details | |

|
#40
Eldorado Ct
Columbia, SC 29203
|
1,978 sq. feet
|
2 baths 3 beds |
show details |
| Photo | Address | Area | Beds / Baths | Price | Details |
|---|---|---|---|---|---|

|
#41
Arrow Shores Cir
Chapin, SC 29036
|
1,563 sq. feet
|
1 baths 3 beds |
show details | |

|
#42
Founders Ridge Rd
Columbia, SC 29229
|
2,510 sq. feet
|
2 baths 3 beds |
show details | |

|
#43
Windsor Lake Blvd
Columbia, SC 29223
|
1,734 sq. feet
|
2 baths 3 beds |
show details | |

|
#44
Rosewood Ln
Lexington, SC 29072
|
1,138 sq. feet
|
2 baths 3 beds |
show details | |

|
#45
Double Eagle Cir
Lexington, SC 29073
|
1,506 sq. feet
|
2 baths 3 beds |
show details | |

|
#46
Cape Jasmine Way
Lexington, SC 29073
|
2,184 sq. feet
|
2 baths 3 beds |
show details | |

|
#47
Savannah Hills Dr
Lexington, SC 29073
|
1,305 sq. feet
|
2 baths 3 beds |
show details | |

|
#48
Brenda Rd
Columbia, SC 29204
|
1,584 sq. feet
|
1 baths 3 beds |
show details | |

|
#49
Kyzer Rd
Lexington, SC 29073
|
2,128 sq. feet
|
2 baths 3 beds |
show details | |

|
Check over 1 million property listings on Foreclosure.com!
|
browse all offers | |||


 | Moving to SC - Columbia Area - any recommendations? (41 replies) |
| Columbia - general (5183 replies) |
| In your opinion, which is better...? (16 replies) |
| Moving to Irmo (20 replies) |
| Retiring - We Need Your Help! (6 replies) |
| Costco construction in Columbia? (162 replies) |
Median year apartment built: 1976
Household type by relationship:
Households: 16,299- Male householders: 3,264 (847 living alone), Female householders: 3,779 (1,231 living alone)
2,672 spouses (2,630 opposite-sex spouses), 595 unmarried partners, (588 opposite-sex unmarried partners), 4,198 children (4,020 natural, 85 adopted, 91 stepchildren), 410 grandchildren, 239 brothers or sisters, 135 parents, 0 foster children, 89 other relatives, 757 non-relatives
- In group quarters: 155
Size of family households: 1,967 2-persons, 1,449 3-persons, 794 4-persons, 273 5-persons, 33 6-persons, 52 7-or-more-persons.
Size of nonfamily households: 2,025 1-person, 394 2-persons, 85 3-persons, 23 4-persons.
1,373 married couples with children.
1,270 single-parent households (201 men, 1,069 women).
87.6% of residents of Seven Oaks speak English at home.
2.1% of residents speak Spanish at home (83% speak English very well, 17% speak English not well).
2.8% of residents speak other Indo-European language at home (61% speak English very well, 37% speak English well, 2% speak English not well).
1.0% of residents speak Asian or Pacific Island language at home (35% speak English very well, 53% speak English well, 11% speak English not well).
5.8% of residents speak other language at home (95% speak English very well, 2% speak English well, 2% speak English not well).
Foreign born population: 1,356 (8.3%)
(70.1% of them are naturalized citizens)
| Here: | 7.0 |
| State: | 6.4 |
| Here: | 4.2 |
| State: | 4.5 |
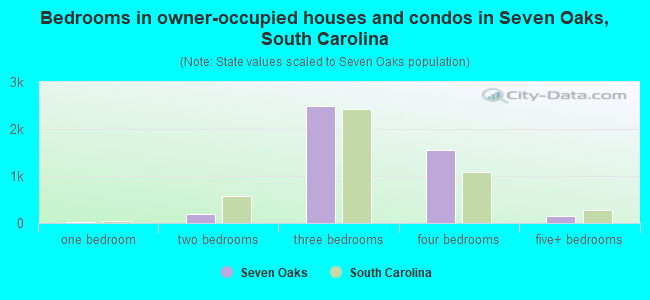
- Bedrooms in owner-occupied houses and condos in Seven Oaks, South Carolina
- 0no bedroom
- 251 bedroom
- 2012 bedrooms
- 2,4883 bedrooms
- 1,5444 bedrooms
- 1405+ bedrooms
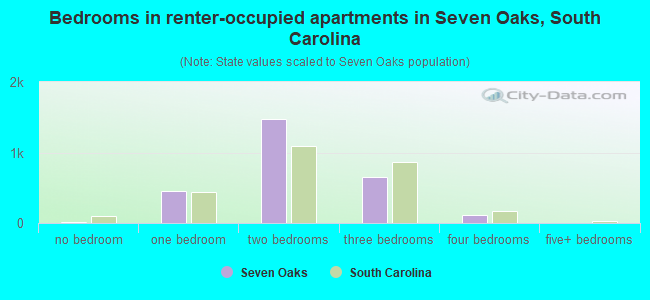
- Bedrooms in renter-occupied apartments in Seven Oaks, South Carolina
- 8no bedroom
- 4481 bedroom
- 1,4692 bedrooms
- 6483 bedrooms
- 1154 bedrooms
- 05+ bedrooms
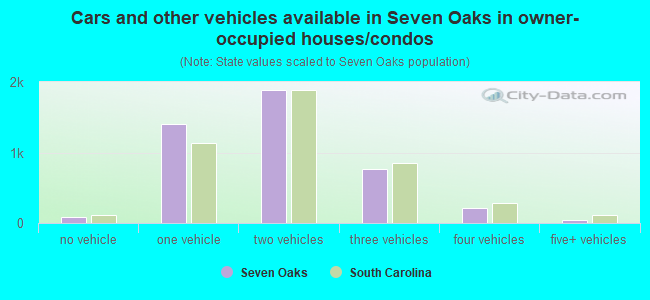
- Cars and other vehicles available in Seven Oaks in owner-occupied houses/condos
- 84no vehicle
- 1,4111 vehicle
- 1,8822 vehicles
- 7673 vehicles
- 2064 vehicles
- 485+ vehicles
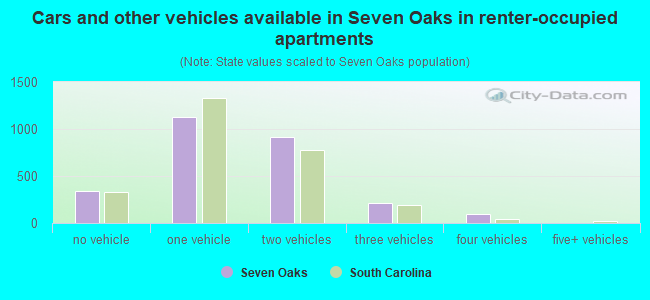
- Cars and other vehicles available in Seven Oaks in renter-occupied apartments
- 339no vehicle
- 1,1251 vehicle
- 9152 vehicles
- 2173 vehicles
- 934 vehicles
- 05+ vehicles
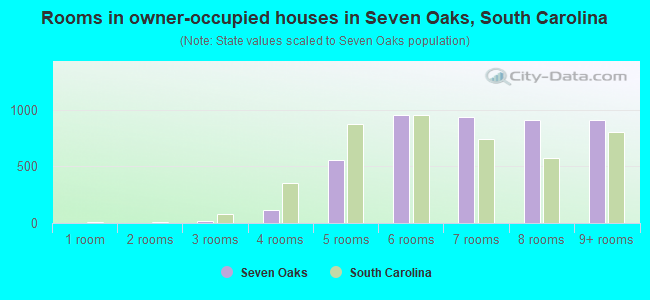
- Rooms in owner-occupied houses in Seven Oaks, South Carolina
- 01 room
- 02 rooms
- 163 rooms
- 1134 rooms
- 5575 rooms
- 9536 rooms
- 9397 rooms
- 9118 rooms
- 9109+ rooms
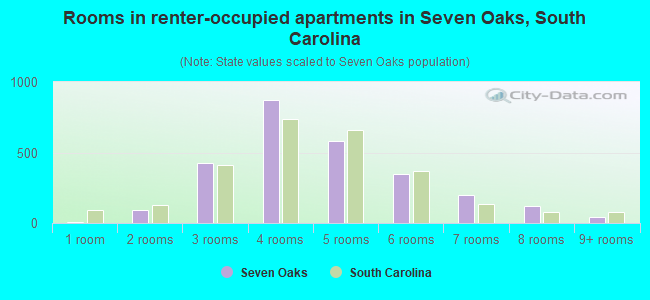
- Rooms in renter-occupied apartments in Seven Oaks, South Carolina
- 81 room
- 892 rooms
- 4253 rooms
- 8734 rooms
- 5825 rooms
- 3496 rooms
- 1977 rooms
- 1218 rooms
- 449+ rooms
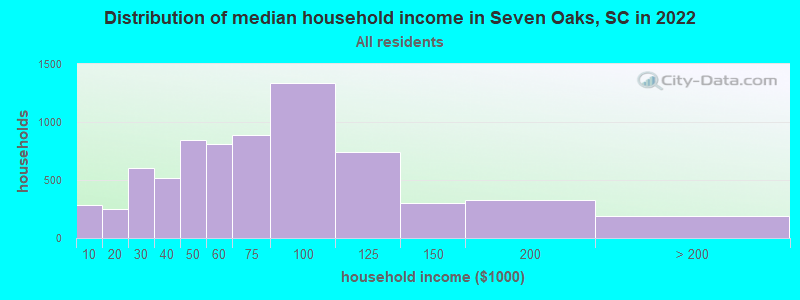
Seven Oaks, SC household income distribution

- 283Less than $10,000
- 250$10,000 to $19,999
- 603$20,000 to $29,999
- 516$30,000 to $39,999
- 841$40,000 to $49,999
- 814$50,000 to $59,999
- 886$60,000 to $74,999
- 1,332$75,000 to $99,999
- 740$100,000 to $124,999
- 298$125,000 to $149,999
- 327$150,000 to $199,999
- 188$200,000 or more
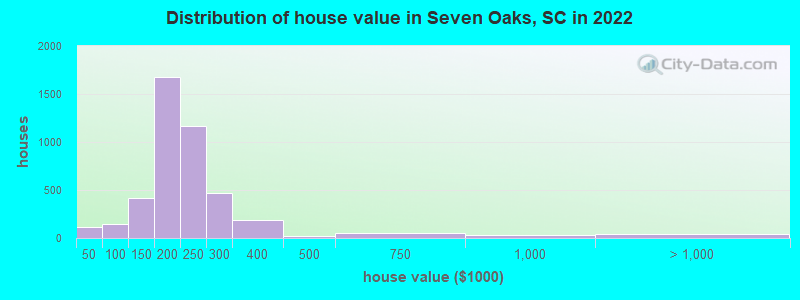
Home value of owner - occupied houses in 2022 in Seven Oaks, SC
-
- 62Less than $10,000
- 16$15,000 to $19,999
- 8$25,000 to $29,999
- 22$35,000 to $39,999
- 8$40,000 to $49,999
- 29$60,000 to $69,999
- 22$70,000 to $79,999
- 29$80,000 to $89,999
- 61$90,000 to $99,999
- 259$100,000 to $124,999
- 155$125,000 to $149,999
- 1,083$150,000 to $174,999
- 597$175,000 to $199,999
- 1,165$200,000 to $249,999
- 467$250,000 to $299,999
- 191$300,000 to $399,999
- 16$400,000 to $499,999
- 53$500,000 to $749,999
- 31$750,000 to $999,999
- 45$1,500,000 to $1,999,999
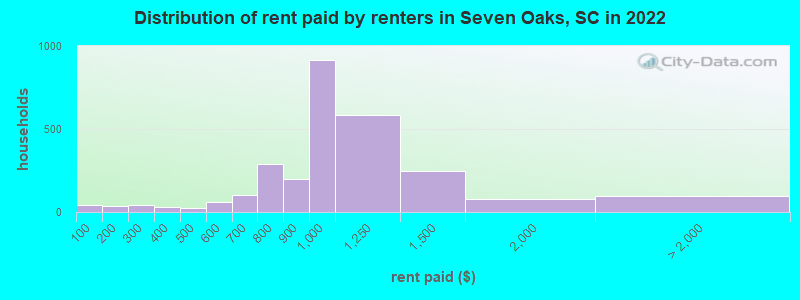
Rent paid by renters in 2022 in Seven Oaks, SC
-
- 40Less than $100
- 30$100 to $149
- 5$150 to $199
- 43$250 to $299
- 31$300 to $349
- 23$450 to $499
- 58$500 to $549
- 7$600 to $649
- 94$650 to $699
- 21$700 to $749
- 267$750 to $799
- 198$800 to $899
- 916$900 to $999
- 583$1,000 to $1,249
- 246$1,250 to $1,499
- 79$1,500 to $1,999
- 11$2,000 to $2,499
- 85No cash rent
Percentage of workers working in this county: 51.6%
Number of people working at home: 807 (9.9% of all workers)
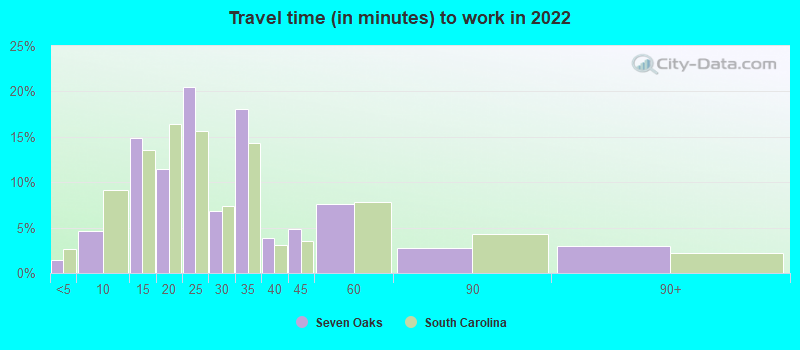
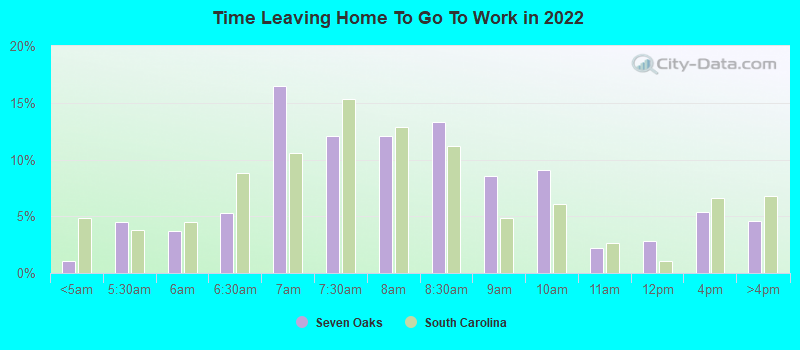
Travel time to work (commute)
- Less than 5 minutes: 88
- 5 to 9 minutes: 569
- 10 to 14 minutes: 1,190
- 15 to 19 minutes: 1,970
- 20 to 24 minutes: 1,699
- 25 to 29 minutes: 511
- 30 to 34 minutes: 782
- 35 to 39 minutes: 73
- 40 to 44 minutes: 157
- 45 to 59 minutes: 81
- 60 to 89 minutes: 95
- 90 or more minutes: 70
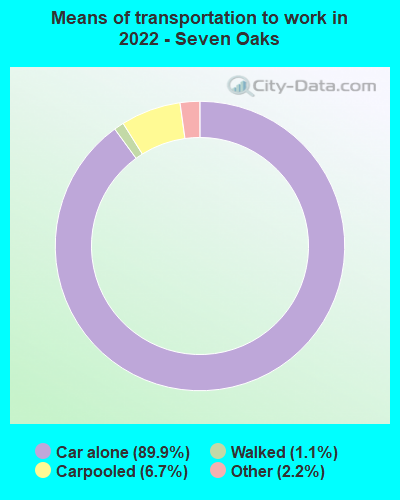
Means of transportation to work:
- Drove a car alone: 6,926 (81.1%)
- Carpooled: 451 (5.3%)
- Bus: 3 (0.0%)
- Taxi: 174 (2.0%)
- Bicycle: 6 (0.1%)
- Walked: 66 (0.8%)
- Worked at home: 807 (9.5%)
- Unemployment by race in 2022
- Unemployment rate for White non-Hispanic residents
- 9.8%Males
- 6.7%Females
- Unemployment rate for Black residents
- 2.7%Females
- Unemployment rate for two or more race residents
- 6.7%Females
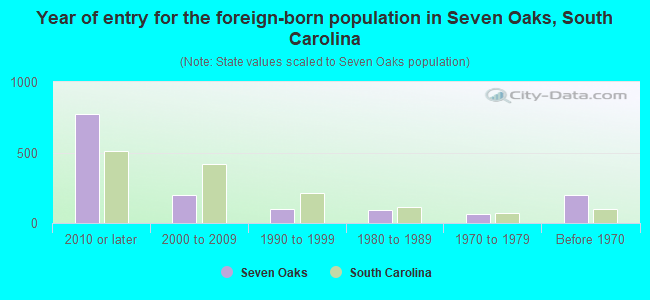
- Year of entry for the foreign-born population in Seven Oaks, South Carolina
- 7732010 or later
- 1992000 to 2009
- 1001990 to 1999
- 911980 to 1989
- 651970 to 1979
- 201Before 1970
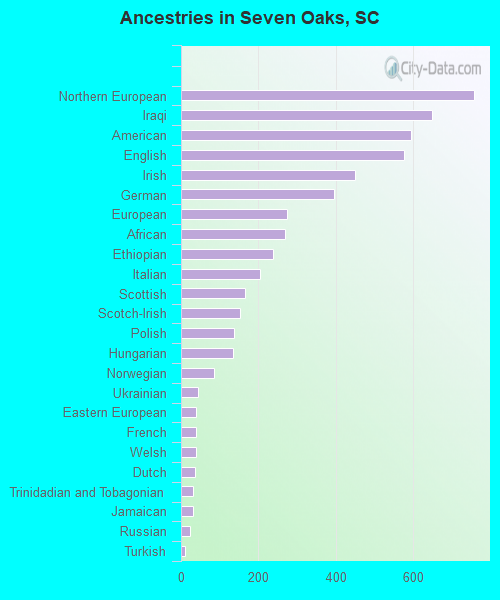
First ancestries reported:
- Northern European: 757 (8.0%)
- Iraqi: 649 (6.9%)
- American: 594 (6.3%)
- English: 575 (6.1%)
- Irish: 449 (4.8%)
- German: 395 (4.2%)
- European: 274 (2.9%)
- African: 268 (2.8%)
- Ethiopian: 238 (2.5%)
- Italian: 203 (2.2%)
- Scottish: 165 (1.7%)
- Scotch-Irish: 153 (1.6%)
- Polish: 136 (1.4%)
- Hungarian: 134 (1.4%)
- Norwegian: 85 (0.9%)
- Ukrainian: 45 (0.5%)
- Eastern European: 39 (0.4%)
- French: 38 (0.4%)
- Welsh: 38 (0.4%)
- Dutch: 36 (0.4%)
- Trinidadian and Tobagonian: 32 (0.3%)
- Jamaican: 30 (0.3%)
- Russian: 24 (0.3%)
- Turkish: 10 (0.1%)
- Slovak: 6 (0.06%)
- British: 5 (0.05%)
Most common places of birth for foreign-born residents (%):
| Seven Oaks: | 30.6% (403) |
| South Carolina: | 0.3% (855) |
| Seven Oaks: | 9.6% (127) |
| South Carolina: | 0.2% (594) |
| Seven Oaks: | 9.0% (119) |
| South Carolina: | 6.8% (18,307) |
| Seven Oaks: | 7.4% (97) |
| South Carolina: | 3.7% (9,982) |
| Seven Oaks: | 5.8% (77) |
| South Carolina: | 0.2% (622) |
| Seven Oaks: | 4.5% (59) |
| South Carolina: | 0.8% (2,055) |
| Seven Oaks: | 4.2% (55) |
| South Carolina: | 22.5% (60,774) |
| Seven Oaks: | 3.9% (51) |
| South Carolina: | 1.5% (3,987) |
| Seven Oaks: | 2.4% (31) |
| South Carolina: | 4.3% (11,533) |
| Seven Oaks: | 2.3% (30) |
| South Carolina: | 0.4% (1,084) |
| Seven Oaks: | 2.2% (29) |
| South Carolina: | 1.7% (4,513) |
| Seven Oaks: | 2.0% (27) |
| South Carolina: | 2.6% (7,073) |
| Seven Oaks: | 1.8% (24) |
| South Carolina: | 0.4% (1,080) |
| Seven Oaks: | 1.7% (22) |
| South Carolina: | 0.7% (1,940) |
| Seven Oaks: | 1.7% (22) |
| South Carolina: | 0.0% (42) |
Place of birth for U.S.-born residents:
- This state: 9,489
- Other state: 5,122
- Northeast: 1,328
- Midwest: 650
- South: 2,745
- West: 387
85.1% of Seven Oaks residents lived in the same house 1 years ago.
Out of people who lived in different houses, 24.1% lived in this county.
Out of people who lived in different counties, 73.0% lived in South Carolina.
| Seven Oaks: | 85.1% |
| State average: | 86.5% |
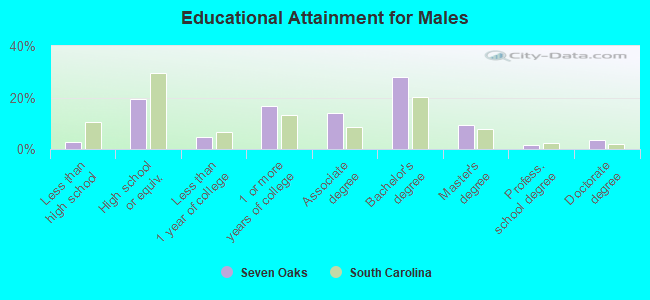
Education attainment for males 25 years and older:
- No schooling: 0
- Nursery to 4th grade: 2
- 5th and 6th grade: 4
- 7th and 8th grade: 46
- 9th grade: 3
- 10th grade: 0
- 11th grade: 39
- 12th grade, no diploma: 60
- High school graduate (or equivalency): 1,056
- Less than 1 year of college: 258
- Some college more than 1 year, no degree: 916
- Associate degree: 751
- Bachelor's degree: 1,525
- Master's degree: 496
- Professional school degree: 82
- Doctorate degree: 191
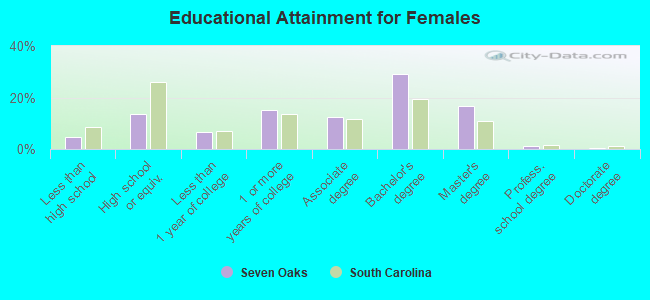
Education attainment for females 25 years and older:
- No schooling: 14
- Nursery to 4th grade: 11
- 5th and 6th grade: 46
- 7th and 8th grade: 2
- 9th grade: 29
- 10th grade: 15
- 11th grade: 62
- 12th grade, no diploma: 113
- High school graduate (or equivalency): 844
- Less than 1 year of college: 415
- Some college more than 1 year, no degree: 933
- Associate degree: 760
- Bachelor's degree: 1,804
- Master's degree: 1,047
- Professional school degree: 79
- Doctorate degree: 36
Housing units in structures:
- One, detached: 4,874
- One, attached: 331
- Two: 53
- 3 or 4: 511
- 5 to 9: 689
- 10 to 19: 677
- 20 to 49: 241
- 50 or more: 22
- Mobile homes: 78
Housing units lacking complete kitchen facilities in 2022: 1.0%
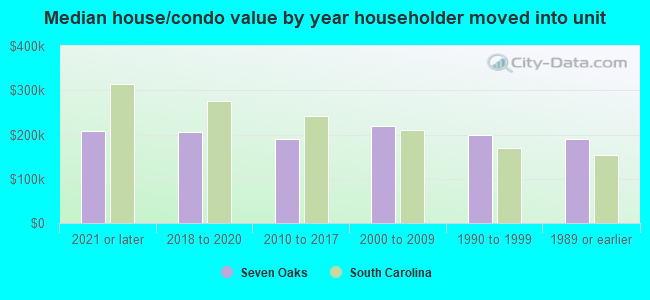
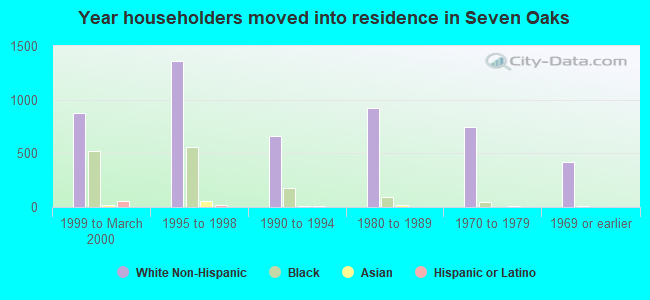
House/condo owner moved in on average 13 years ago
Renter moved in on average 2 years ago
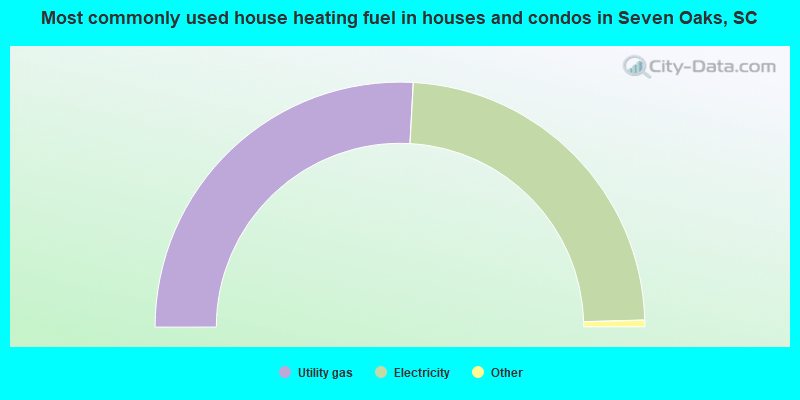
- 51.8%Utility gas
- 47.4%Electricity
- 0.4%Bottled, tank, or LP gas
- 0.4%Solar energy
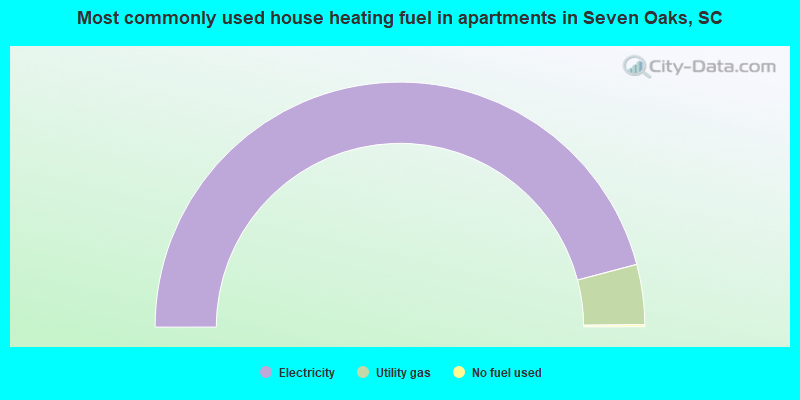
- 91.8%Electricity
- 7.9%Utility gas
- 0.3%No fuel used
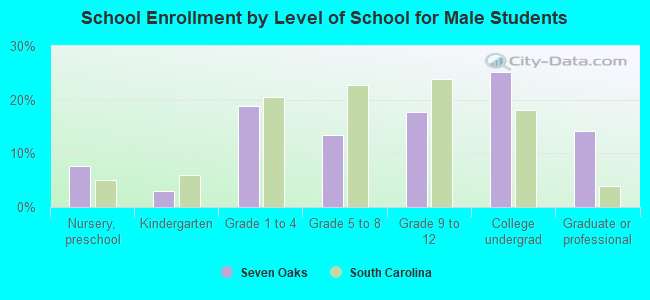
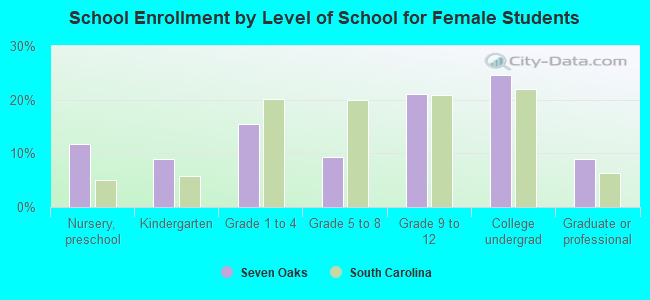
Private vs. public school enrollment:
| Here: | 0.6% |
| South Carolina: | 14.4% |
| Here: | 1.5% |
| South Carolina: | 11.1% |
| Here: | 31.3% |
| South Carolina: | 21.9% |