Shady Side, MD (Maryland) Houses and Residents
| Shady Side: | $416,509 |
| Maryland: | $398,100 |
Mean price in 2022:
Detached houses: $434,854
Here: $434,854 State: $526,819
Total population: 5,803 (Urban population: 5,445 (all inside urban clusters), Rural population: 117 (all nonfarm))
Houses: 2,401 (2,036 occupied: 1,834 owner occupied, 215 renter occupied)
| % of renters here: | 10% |
| State: | 32% |
Housing density: 327 houses/condos per square mile
Median price asked for vacant for-sale houses and condos in 2022 in this county: $157,543.
Median contract rent in 2022: $1,903 (lower quartile is $1,564, upper quartile is over $2,000)
Median rent asked for vacant for-rent units in 2022: $2,554
Median gross rent in Shady Side, MD in 2022: over $2,000
Housing units in Shady Side with a mortgage: 1,485 (46 second mortgage, 0 home equity loan, 31 both second mortgage and home equity loan)
Houses without a mortgage: 43
Median household income for houses/condos with a mortgage: $139,049
Median household income for apartments without a mortgage: $90,175
Median monthly housing costs: $2,121
Compare current foreclosures near Shady Side, MD:
| Photo | Address | Area | Beds / Baths | Price | Details |
|---|---|---|---|---|---|

|
#1
Dennis Rd
Shady Side, MD 20764
|
1,376 sq. feet
|
2 baths 3 beds |
show details | |

|
#2
Steamboat Rd
Shady Side, MD 20764
|
1,240 sq. feet
|
1 baths - beds |
show details | |

|
#3
Cedar Ave
Shady Side, MD 20764
|
896 sq. feet
|
1 baths - beds |
show details | |

|
#4
Shady Side Rd
Shady Side, MD 20764
|
1,344 sq. feet
|
2 baths - beds |
show details | |

|
#5
Maryland Ave
Shady Side, MD 20764
|
756 sq. feet
|
1 baths - beds |
show details | |

|
#6
Maryland Ave
Shady Side, MD 20764
|
960 sq. feet
|
1 baths - beds |
show details | |

|
#7
Chestnut Rd
Shady Side, MD 20764
|
- sq. feet
|
- baths - beds |
show details | |

|
#8
Ensleigh Ln
Bowie, MD 20716
|
1,656 sq. feet
|
2 baths 3 beds |
$374,900
|
show details |

|
#9
Bay Ridge Rd
Edgewater, MD 21037
|
2,951 sq. feet
|
3 baths 3 beds |
$615,000
|
show details |

|
#10
Gladys Retreat Cir
Bowie, MD 20720
|
2,880 sq. feet
|
3 baths 3 beds |
$409,900
|
show details |
| Photo | Address | Area | Beds / Baths | Price | Details |
|---|---|---|---|---|---|

|
#11
Hunting Creek Rd
Huntingtown, MD 20639
|
1,170 sq. feet
|
2 baths 2 beds |
$282,150
|
show details |

|
#12
Carousel Ct
Upper Marlboro, MD 20772
|
2,112 sq. feet
|
2 baths 3 beds |
$385,000
|
show details |

|
#13
Heming Ln
Bowie, MD 20716
|
1,800 sq. feet
|
2 baths 3 beds |
$400,000
|
show details |

|
#14
Rolling Meadows Rd
Upper Marlboro, MD 20772
|
2,459 sq. feet
|
2 baths 3 beds |
$405,000
|
show details |

|
#15
Elkhorn Ln
Bowie, MD 20716
|
1,514 sq. feet
|
2 baths 3 beds |
$415,000
|
show details |

|
#16
Silverwood Cir Apt 2
Annapolis, MD 21403
|
1,312 sq. feet
|
2 baths 2 beds |
$249,600
|
show details |

|
#17
Poplar Ave
Shady Side, MD 20764
|
- sq. feet
|
- baths - beds |
show details | |

|
#18
Brooke Ln
Upper Marlboro, MD 20772
|
- sq. feet
|
5 baths 6 beds |
$949,000
|
show details |

|
#19
Deale Rd
Tracys Landing, MD 20779
|
1,472 sq. feet
|
1 baths 3 beds |
show details | |

|
#20
Ripon Pl
Upper Marlboro, MD 20772
|
1,080 sq. feet
|
3 baths 3 beds |
show details |
| Photo | Address | Area | Beds / Baths | Price | Details |
|---|---|---|---|---|---|

|
#21
Chesapeake Ave
Chesapeake Beach, MD 20732
|
776 sq. feet
|
1 baths 2 beds |
show details | |

|
#22
Eddy Rd
Crownsville, MD 21032
|
1,100 sq. feet
|
2 baths 2 beds |
show details | |

|
#23
Newton Ct
Upper Marlboro, MD 20772
|
1,092 sq. feet
|
2 baths 3 beds |
show details | |

|
#24
Hampshire Hall Ct
Upper Marlboro, MD 20772
|
1,500 sq. feet
|
2 baths 2 beds |
show details | |

|
#25
Dennington Dr
Bowie, MD 20721
|
4,164 sq. feet
|
2 baths 4 beds |
show details | |

|
#26
Coronella Ct
Upper Marlboro, MD 20774
|
3,386 sq. feet
|
6 baths 6 beds |
show details | |

|
#27
Sutton Ln
Bowie, MD 20720
|
2,132 sq. feet
|
3 baths 3 beds |
show details | |

|
#28
Two Horse Lane
Huntingtown, MD 20639
|
1,680 sq. feet
|
2 baths - beds |
show details | |

|
#29
Molly Berry Rd
Upper Marlboro, MD 20772
|
1,235 sq. feet
|
2 baths - beds |
show details | |

|
#30
Oaklawn Ave
Annapolis, MD 21401
|
696 sq. feet
|
1 baths - beds |
show details |
| Photo | Address | Area | Beds / Baths | Price | Details |
|---|---|---|---|---|---|

|
#31
Migsby Ct
Upper Marlboro, MD 20774
|
1,560 sq. feet
|
2 baths - beds |
show details | |

|
#32
Pochard Ct
Upper Marlboro, MD 20774
|
3,082 sq. feet
|
3 baths - beds |
show details | |

|
#33
Hampton Rd
Annapolis, MD 21409
|
2,254 sq. feet
|
2 baths - beds |
show details | |

|
#34
Sholton St
Upper Marlboro, MD 20774
|
1,312 sq. feet
|
2 baths - beds |
show details | |

|
#35
Walnut Creek Rd
Huntingtown, MD 20639
|
2,146 sq. feet
|
2 baths - beds |
show details | |

|
#36
Lodge Pole Ct
Annapolis, MD 21409
|
1,526 sq. feet
|
1 baths - beds |
show details | |

|
#37
Isham Ct
Upper Marlboro, MD 20774
|
1,326 sq. feet
|
2 baths - beds |
show details | |

|
#38
Aberdeen Cir
Crofton, MD 21114
|
1,216 sq. feet
|
1 baths - beds |
show details | |

|
#39
Leisure Way
Crofton, MD 21114
|
1,254 sq. feet
|
2 baths - beds |
show details | |

|
#40
London Ln
Bowie, MD 20715
|
1,240 sq. feet
|
2 baths - beds |
show details |
| Photo | Address | Area | Beds / Baths | Price | Details |
|---|---|---|---|---|---|

|
#41
London Ln
Bowie, MD 20715
|
1,200 sq. feet
|
2 baths - beds |
show details | |

|
#42
Brightleaf Dr
Arnold, MD 21012
|
820 sq. feet
|
1 baths - beds |
show details | |

|
#43
New Kent Dr
Upper Marlboro, MD 20772
|
2,420 sq. feet
|
2 baths - beds |
show details | |

|
#44
Cheswicke Ln
Upper Marlboro, MD 20772
|
5,500 sq. feet
|
4 baths - beds |
show details | |

|
#45
Moonbeam Ave
Huntingtown, MD 20639
|
2,856 sq. feet
|
2 baths - beds |
show details | |

|
#46
Aberdeen Cir
Crofton, MD 21114
|
1,444 sq. feet
|
2 baths - beds |
show details | |

|
#47
Little Creek Rd
Chester, MD 21619
|
1,184 sq. feet
|
1 baths - beds |
show details | |

|
#48
Duke St
Stevensville, MD 21666
|
960 sq. feet
|
1 baths - beds |
show details | |

|
#49
Grandview Ct
Upper Marlboro, MD 20772
|
1,468 sq. feet
|
2 baths - beds |
show details | |

|
Check over 1 million property listings on Foreclosure.com!
|
browse all offers | |||


 | Calvert/Anne Arundel County to Camp Springs, suggestions? (10 replies) |
| Considering Shady Side, Maryland (11 replies) |
| Why Did You Move Out Of Maryland.... (272 replies) |
| moving to MD from CA-have no clue where to go-ideas? (3 replies) |
| Moving to Annapolis-- suggestions (22 replies) |
| Recommend places to live in and near Annapolis? Kid and pet friendly (18 replies) |

Median year apartment built: 1993
Household type by relationship:
Households: 5,002- Male householders: 976 (197 living alone), Female householders: 1,049 (204 living alone)
1,266 spouses (1,191 opposite-sex spouses), 34 unmarried partners, (34 opposite-sex unmarried partners), 1,592 children (1,512 natural, 21 adopted, 59 stepchildren), 16 grandchildren, 0 brothers or sisters, 0 parents, 0 foster children, 0 other relatives, 67 non-relatives
Size of family households: 866 2-persons, 334 3-persons, 351 4-persons, 70 5-persons.
Size of nonfamily households: 421 1-person.
705 married couples with children.
227 single-parent households (0 men, 227 women).
95.6% of residents of Shady Side speak English at home.
1.5% of residents speak Spanish at home (100% speak English very well).
1.2% of residents speak other Indo-European language at home (60% speak English very well, 40% speak English well).
0.4% of residents speak Asian or Pacific Island language at home (100% speak English very well).
Foreign born population: 214 (4.3%)
(91.6% of them are naturalized citizens)
| Here: | 6.8 |
| State: | 7.3 |
| Here: | 5.3 |
| State: | 4.2 |

- Bedrooms in owner-occupied houses and condos in Shady Side, Maryland
- 20no bedroom
- 161 bedroom
- 1912 bedrooms
- 1,0143 bedrooms
- 4304 bedrooms
- 1635+ bedrooms

- Bedrooms in renter-occupied apartments in Shady Side, Maryland
- 0no bedroom
- 01 bedroom
- 622 bedrooms
- 1533 bedrooms
- 04 bedrooms
- 05+ bedrooms

- Cars and other vehicles available in Shady Side in owner-occupied houses/condos
- 0no vehicle
- 3561 vehicle
- 7802 vehicles
- 5143 vehicles
- 1474 vehicles
- 375+ vehicles

- Cars and other vehicles available in Shady Side in renter-occupied apartments
- 0no vehicle
- 1271 vehicle
- 892 vehicles
- 03 vehicles
- 04 vehicles
- 05+ vehicles

- Rooms in owner-occupied houses in Shady Side, Maryland
- 201 room
- 02 rooms
- 463 rooms
- 734 rooms
- 2625 rooms
- 4466 rooms
- 2487 rooms
- 2688 rooms
- 4709+ rooms

- Rooms in renter-occupied apartments in Shady Side, Maryland
- 01 room
- 02 rooms
- 173 rooms
- 04 rooms
- 195 rooms
- 1486 rooms
- 177 rooms
- 08 rooms
- 139+ rooms


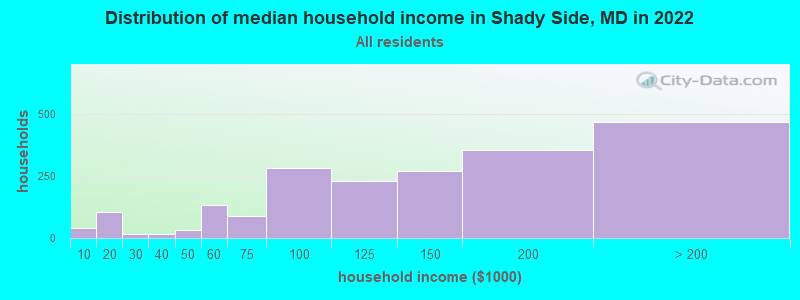
Shady Side, MD household income distribution

- 39Less than $10,000
- 103$10,000 to $19,999
- 16$20,000 to $29,999
- 17$30,000 to $39,999
- 31$40,000 to $49,999
- 133$50,000 to $59,999
- 87$60,000 to $74,999
- 282$75,000 to $99,999
- 231$100,000 to $124,999
- 269$125,000 to $149,999
- 356$150,000 to $199,999
- 467$200,000 or more
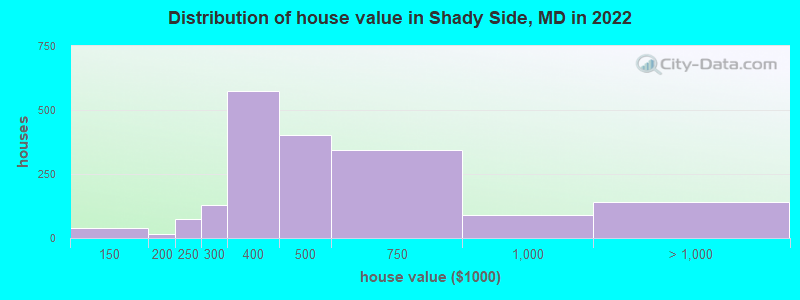
Home value of owner - occupied houses in 2022 in Shady Side, MD
-
- 38$100,000 to $124,999
- 17$150,000 to $174,999
- 75$200,000 to $249,999
- 129$250,000 to $299,999
- 573$300,000 to $399,999
- 403$400,000 to $499,999
- 341$500,000 to $749,999
- 89$750,000 to $999,999
- 124$1,000,000 to $1,499,999
- 16$2,000,000 or more
Rent paid by renters in 2022 in Shady Side, MD
-
- 102$1,500 to $1,999
- 64$2,000 to $2,499
- 13$3,000 to $3,499
- 16No cash rent

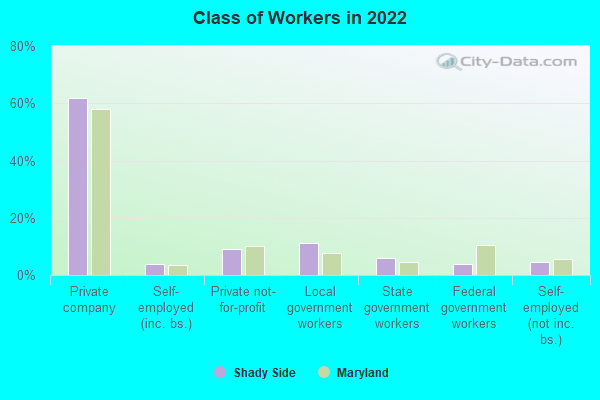
Percentage of workers working in this county: 60.0%
Number of people working at home: 471 (16.1% of all workers)
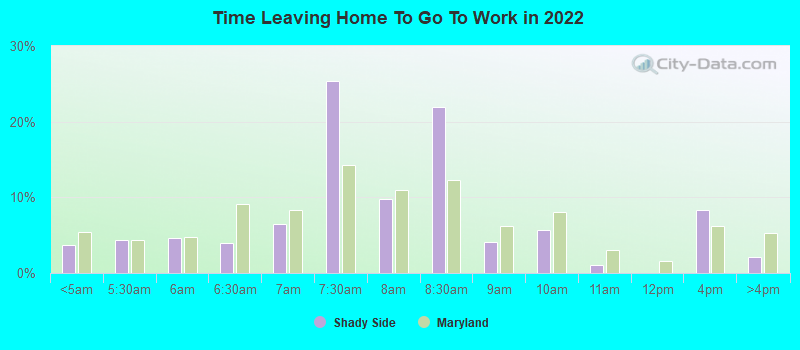
Travel time to work (commute)
- Less than 5 minutes: 9
- 5 to 9 minutes: 0
- 10 to 14 minutes: 84
- 15 to 19 minutes: 129
- 20 to 24 minutes: 232
- 25 to 29 minutes: 67
- 30 to 34 minutes: 514
- 35 to 39 minutes: 184
- 40 to 44 minutes: 63
- 45 to 59 minutes: 520
- 60 to 89 minutes: 433
- 90 or more minutes: 101
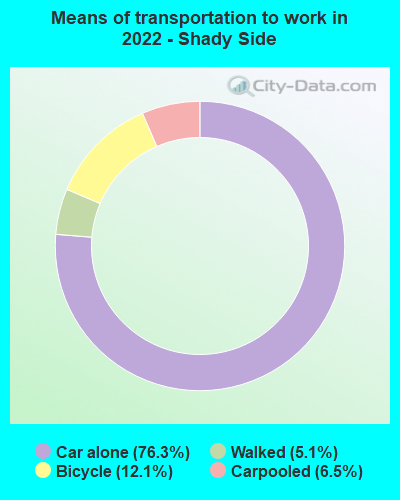
Means of transportation to work:
- Drove a car alone: 370 (45.7%)
- Carpooled: 29 (3.6%)
- Bicycle: 43 (5.3%)
- Walked: 22 (2.7%)
- Worked at home: 900 (111.2%)
- Unemployment by race in 2022
- Unemployment rate for White non-Hispanic residents
- 5.0%Males
- 2.4%Females
- Unemployment rate for Black residents
- 14.8%Males

- Year of entry for the foreign-born population in Shady Side, Maryland
- 222010 or later
- 502000 to 2009
- 591990 to 1999
- 141980 to 1989
- 371970 to 1979
- 63Before 1970

First ancestries reported:
- Irish: 255 (15.5%)
- German: 207 (12.6%)
- English: 111 (6.7%)
- Polish: 69 (4.2%)
- European: 61 (3.7%)
- American: 51 (3.1%)
- British: 49 (3.0%)
- Russian: 32 (1.9%)
- Eastern European: 25 (1.5%)
- French: 25 (1.5%)
- Celtic: 22 (1.3%)
- Guyanese: 21 (1.3%)
- Jamaican: 20 (1.2%)
- Norwegian: 17 (1.0%)
- Slovak: 16 (1.0%)
- Welsh: 15 (0.9%)
- Italian: 10 (0.6%)
- Scotch-Irish: 9 (0.5%)
- Czechoslovakian: 7 (0.4%)
Most common places of birth for foreign-born residents (%):
| Shady Side: | 23.5% (52) |
| Maryland: | 4.4% (42,350) |
| Shady Side: | 12.7% (28) |
| Maryland: | 0.8% (8,109) |
| Shady Side: | 10.9% (24) |
| Maryland: | 2.5% (24,026) |
| Shady Side: | 10.4% (23) |
| Maryland: | 1.0% (9,481) |
| Shady Side: | 9.0% (20) |
| Maryland: | 2.8% (27,444) |
| Shady Side: | 8.6% (19) |
| Maryland: | 0.7% (6,724) |
| Shady Side: | 7.2% (16) |
| Maryland: | 1.2% (11,980) |
| Shady Side: | 6.3% (14) |
| Maryland: | 0.3% (3,199) |
| Shady Side: | 6.3% (14) |
| Maryland: | 3.8% (36,698) |
| Shady Side: | 5.9% (13) |
| Maryland: | 1.2% (11,265) |
Place of birth for U.S.-born residents:
- This state: 2,752
- Other state: 1,951
- Northeast: 505
- Midwest: 135
- South: 1,158
- West: 168
85.7% of Shady Side residents lived in the same house 1 years ago.
Out of people who lived in different houses, 44.0% lived in this county.
Out of people who lived in different counties, 100.0% lived in Maryland.
| Shady Side: | 85.7% |
| State average: | 88.5% |
Education attainment for males 25 years and older:
- No schooling: 0
- Nursery to 4th grade: 0
- 5th and 6th grade: 0
- 7th and 8th grade: 0
- 9th grade: 0
- 10th grade: 11
- 11th grade: 0
- 12th grade, no diploma: 0
- High school graduate (or equivalency): 455
- Less than 1 year of college: 21
- Some college more than 1 year, no degree: 422
- Associate degree: 53
- Bachelor's degree: 576
- Master's degree: 167
- Professional school degree: 7
- Doctorate degree: 65

Education attainment for females 25 years and older:
- No schooling: 21
- Nursery to 4th grade: 0
- 5th and 6th grade: 0
- 7th and 8th grade: 0
- 9th grade: 16
- 10th grade: 0
- 11th grade: 0
- 12th grade, no diploma: 0
- High school graduate (or equivalency): 528
- Less than 1 year of college: 90
- Some college more than 1 year, no degree: 238
- Associate degree: 143
- Bachelor's degree: 484
- Master's degree: 239
- Professional school degree: 98
- Doctorate degree: 33


Housing units in structures:
- One, detached: 2,385
- One, attached: 16
House/condo owner moved in on average 15 years ago
Renter moved in on average 0 years ago

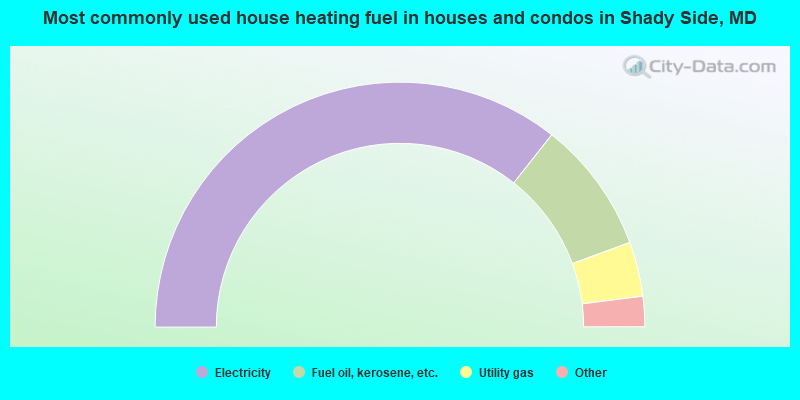
- 71.3%Electricity
- 17.5%Fuel oil, kerosene, etc.
- 7.2%Utility gas
- 3.1%Bottled, tank, or LP gas
- 0.9%Wood
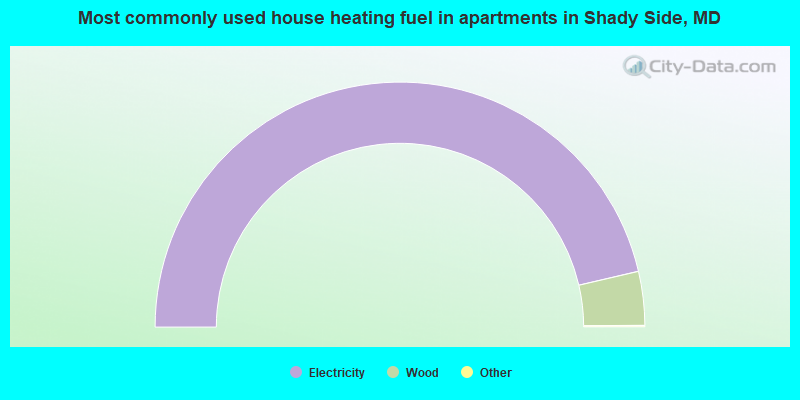
- 92.9%Electricity
- 7.1%Wood
Private vs. public school enrollment:
| Here: | 4.6% |
| Maryland: | 15.2% |
| Here: | 0.0% |
| Maryland: | 14.4% |
| Here: | 16.1% |
| Maryland: | 20.2% |


