Sharon, TN (Tennessee) Houses and Residents
| Sharon: | $114,239 |
| Tennessee: | $284,800 |
Total population: 919 (Urban population: 0, Rural population: 1,001 (9 farm, 992 nonfarm))
Houses: 580 (519 occupied: 307 owner occupied, 221 renter occupied)
| % of renters here: | 42% |
| State: | 33% |
Housing density: 503 houses/condos per square mile
Median price asked for vacant for-sale houses and condos in 2022 in this county: $581,375.
Median contract rent in 2022: $483 (lower quartile is $364, upper quartile is $653)
Median rent asked for vacant for-rent units in 2022: $1,302
Median gross rent in Sharon, TN in 2022: $636
Housing units in Sharon with a mortgage: 77 (15 second mortgage, 0 home equity loan, 15 both second mortgage and home equity loan)
Houses without a mortgage: 0
Median household income for houses/condos with a mortgage: $85,237
Median household income for apartments without a mortgage: $30,357
Median monthly housing costs: $530
Compare current foreclosures near Sharon, TN:
| Photo | Address | Area | Beds / Baths | Price | Details |
|---|---|---|---|---|---|

|
#1
Sharon Rd
Sharon, TN 38255
|
1,548 sq. feet
|
1 baths - beds |
show details | |

|
#2
N Woodlawn Ave
Sharon, TN 38255
|
1,228 sq. feet
|
1 baths - beds |
show details | |

|
#3
Sidonia Rd
Sharon, TN 38255
|
1,120 sq. feet
|
1 baths - beds |
show details | |

|
#4
Sidonia Rd
Sharon, TN 38255
|
1,216 sq. feet
|
- baths - beds |
show details | |

|
#5
Cooper St
Martin, TN 38237
|
1,518 sq. feet
|
1 baths 3 beds |
show details | |

|
#6
N Main St
Dyer, TN 38330
|
- sq. feet
|
2 baths 3 beds |
show details | |

|
#7
W Knox St
Rutherford, TN 38369
|
1,018 sq. feet
|
2 baths 2 beds |
show details | |

|
#8
Currie Rd
Dyer, TN 38330
|
1,048 sq. feet
|
1 baths 2 beds |
show details | |

|
#9
John Martin Rd
Bradford, TN 38316
|
2,850 sq. feet
|
2 baths - beds |
show details | |

|
#10
Fain St
Rutherford, TN 38369
|
950 sq. feet
|
1 baths - beds |
show details |
| Photo | Address | Area | Beds / Baths | Price | Details |
|---|---|---|---|---|---|

|
#11
Mcknight St
Rutherford, TN 38369
|
1,288 sq. feet
|
2 baths - beds |
show details | |

|
#12
Vinson St
Gleason, TN 38229
|
1,120 sq. feet
|
1 baths - beds |
show details | |

|
#13
Holland St
Gleason, TN 38229
|
1,312 sq. feet
|
1 baths - beds |
show details | |

|
#14
West St
Gleason, TN 38229
|
1,108 sq. feet
|
1 baths - beds |
show details | |

|
#15
Chandler Dr
Kenton, TN 38233
|
1,688 sq. feet
|
2 baths - beds |
show details | |

|
#16
Woodlawn St
Kenton, TN 38233
|
1,160 sq. feet
|
1 baths - beds |
show details | |

|
#17
E College St
Bradford, TN 38316
|
1,152 sq. feet
|
1 baths - beds |
show details | |

|
#18
Gleason Como Rd
Gleason, TN 38229
|
1,293 sq. feet
|
2 baths - beds |
show details | |

|
#19
Jan Lynn St
Kenton, TN 38233
|
1,272 sq. feet
|
1 baths - beds |
show details | |

|
#20
Shades Bridge Rd
Bradford, TN 38316
|
1,240 sq. feet
|
1 baths - beds |
show details |
| Photo | Address | Area | Beds / Baths | Price | Details |
|---|---|---|---|---|---|

|
#21
E Main St
Bradford, TN 38316
|
2,816 sq. feet
|
2 baths - beds |
show details | |

|
#22
E Main St
Bradford, TN 38316
|
1,896 sq. feet
|
2 baths - beds |
show details | |

|
#23
Smith St
Bradford, TN 38316
|
1,964 sq. feet
|
2 baths - beds |
show details | |

|
#24
Cash St
Bradford, TN 38316
|
1,390 sq. feet
|
2 baths - beds |
show details | |

|
#25
Tilghman St
Kenton, TN 38233
|
990 sq. feet
|
1 baths - beds |
show details | |

|
#26
S Hall St
Kenton, TN 38233
|
1,112 sq. feet
|
1 baths - beds |
show details | |

|
#27
Keely Mill Rd
Trenton, TN 38382
|
1,890 sq. feet
|
1 baths - beds |
show details | |

|
#28
Unity Rd
Dresden, TN 38225
|
1,152 sq. feet
|
2 baths - beds |
show details | |

|
#29
Luellen Rd
Gleason, TN 38229
|
1,396 sq. feet
|
1 baths - beds |
show details | |

|
#30
S Main St
Dyer, TN 38330
|
1,784 sq. feet
|
2 baths - beds |
show details |
| Photo | Address | Area | Beds / Baths | Price | Details |
|---|---|---|---|---|---|

|
#31
Circle Dr
Union City, TN 38261
|
1,216 sq. feet
|
2 baths - beds |
show details | |

|
#32
Bobby Burgess Rd
Trenton, TN 38382
|
1,760 sq. feet
|
2 baths - beds |
show details | |

|
#33
Bradford Hwy
Trenton, TN 38382
|
880 sq. feet
|
1 baths - beds |
show details | |

|
#34
Byrn St
Union City, TN 38261
|
1,136 sq. feet
|
1 baths - beds |
show details | |

|
#35
Church Rd
Union City, TN 38261
|
720 sq. feet
|
1 baths - beds |
show details | |

|
#36
Burruss St
Union City, TN 38261
|
1,514 sq. feet
|
2 baths - beds |
show details | |

|
#37
Burruss Street Ext
Union City, TN 38261
|
2,076 sq. feet
|
2 baths - beds |
show details | |

|
#38
Old Dyer Trenton Rd
Dyer, TN 38330
|
2,670 sq. feet
|
2 baths - beds |
show details | |

|
#39
Old Turnpike Rd
Kenton, TN 38233
|
2,809 sq. feet
|
3 baths - beds |
show details | |

|
#40
W Broad St
Dyer, TN 38330
|
3,697 sq. feet
|
2 baths - beds |
show details |
| Photo | Address | Area | Beds / Baths | Price | Details |
|---|---|---|---|---|---|

|
#41
Keely Mill Rd
Trenton, TN 38382
|
1,946 sq. feet
|
2 baths - beds |
show details | |

|
#42
Lee St
Dyer, TN 38330
|
1,268 sq. feet
|
1 baths - beds |
show details | |

|
#43
N Main St
Dyer, TN 38330
|
1,203 sq. feet
|
1 baths - beds |
show details | |

|
#44
E College St
Dyer, TN 38330
|
1,224 sq. feet
|
1 baths - beds |
show details | |

|
#45
E Walnut St
Dyer, TN 38330
|
1,480 sq. feet
|
2 baths - beds |
show details | |

|
#46
High St
Dyer, TN 38330
|
1,560 sq. feet
|
1 baths - beds |
show details | |

|
#47
High St
Dyer, TN 38330
|
994 sq. feet
|
1 baths - beds |
show details | |

|
#48
N Poplar St
Dyer, TN 38330
|
1,383 sq. feet
|
1 baths - beds |
show details | |

|
#49
Walker Rd
Dresden, TN 38225
|
1,380 sq. feet
|
1 baths - beds |
show details | |

|
Check over 1 million property listings on Foreclosure.com!
|
browse all offers | |||

Latest news about housing in Sharon, TN collected exclusively by city-data.com from local newspapers, TV, and radio stations

 | Pal Barger Has Passed Away (3 replies) |
| Moving to Paris area from California (huntington beach) (4 replies) |
| Transplant in or around Huntsville Area (1 reply) |
| Sell me Hendersonville (27 replies) |
| Best place to get a burger ? (12 replies) |
| Best alterations place (6 replies) |

Median year apartment built: 1971
Household type by relationship:
Households: 1,189- Male householders: 197 (30 living alone), Female householders: 315 (138 living alone)
249 spouses (245 opposite-sex spouses), 22 unmarried partners, (22 opposite-sex unmarried partners), 310 children (286 natural, 19 adopted, 5 stepchildren), 58 grandchildren, 4 brothers or sisters, 11 parents, 0 foster children, 0 other relatives, 20 non-relatives
Size of family households: 173 2-persons, 87 3-persons, 52 4-persons, 12 5-persons, 8 6-persons, 3 7-or-more-persons.
Size of nonfamily households: 172 1-person, 15 2-persons, 2 3-persons.
69 married couples with children.
104 single-parent households (19 men, 85 women).
90.5% of residents of Sharon speak English at home.
6.7% of residents speak Spanish at home (96% speak English very well, 4% speak English well).
3.9% of residents speak Asian or Pacific Island language at home (35% speak English very well, 65% speak English not well).
Foreign born population: 33 (2.8%)
(78.8% of them are naturalized citizens)
| Here: | 7.2 |
| State: | 6.5 |
| Here: | 4.6 |
| State: | 4.4 |

- Bedrooms in owner-occupied houses and condos in Sharon, Tennessee
- 0no bedroom
- 01 bedroom
- 812 bedrooms
- 1273 bedrooms
- 664 bedrooms
- 345+ bedrooms

- Bedrooms in renter-occupied apartments in Sharon, Tennessee
- 0no bedroom
- 281 bedroom
- 1022 bedrooms
- 723 bedrooms
- 164 bedrooms
- 35+ bedrooms

- Cars and other vehicles available in Sharon in owner-occupied houses/condos
- 13no vehicle
- 1091 vehicle
- 1002 vehicles
- 623 vehicles
- 244 vehicles
- 05+ vehicles

- Cars and other vehicles available in Sharon in renter-occupied apartments
- 16no vehicle
- 871 vehicle
- 1042 vehicles
- 123 vehicles
- 34 vehicles
- 05+ vehicles

- Rooms in owner-occupied houses in Sharon, Tennessee
- 01 room
- 02 rooms
- 73 rooms
- 354 rooms
- 445 rooms
- 246 rooms
- 607 rooms
- 888 rooms
- 499+ rooms

- Rooms in renter-occupied apartments in Sharon, Tennessee
- 01 room
- 132 rooms
- 123 rooms
- 804 rooms
- 395 rooms
- 436 rooms
- 17 rooms
- 228 rooms
- 139+ rooms


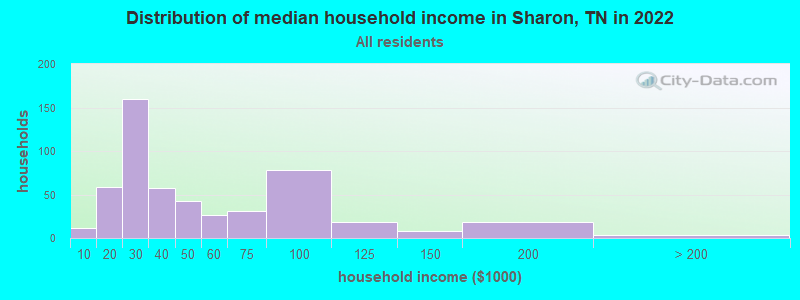
Sharon, TN household income distribution

- 12Less than $10,000
- 59$10,000 to $19,999
- 160$20,000 to $29,999
- 57$30,000 to $39,999
- 42$40,000 to $49,999
- 27$50,000 to $59,999
- 31$60,000 to $74,999
- 78$75,000 to $99,999
- 18$100,000 to $124,999
- 8$125,000 to $149,999
- 18$150,000 to $199,999
- 3$200,000 or more
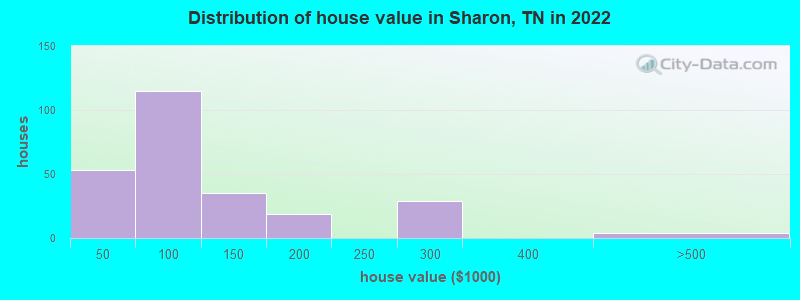
Home value of owner - occupied houses in 2022 in Sharon, TN
-
- 13Less than $10,000
- 2$20,000 to $24,999
- 3$30,000 to $34,999
- 5$35,000 to $39,999
- 28$40,000 to $49,999
- 16$50,000 to $59,999
- 9$70,000 to $79,999
- 24$80,000 to $89,999
- 35$90,000 to $99,999
- 15$100,000 to $124,999
- 19$125,000 to $149,999
- 10$150,000 to $174,999
- 7$175,000 to $199,999
- 28$250,000 to $299,999
- 4$400,000 to $499,999
Rent paid by renters in 2022 in Sharon, TN
-
- 3$250 to $299
- 58$300 to $349
- 36$350 to $399
- 13$400 to $449
- 19$450 to $499
- 6$500 to $549
- 6$550 to $599
- 36$600 to $649
- 1$650 to $699
- 10$700 to $749
- 5$750 to $799
- 1$800 to $899
- 12No cash rent

Percentage of workers working in this county: 78.7%
Number of people working at home: 43 (10.2% of all workers)
Travel time to work (commute)
- Less than 5 minutes: 6
- 5 to 9 minutes: 92
- 10 to 14 minutes: 90
- 15 to 19 minutes: 51
- 20 to 24 minutes: 44
- 25 to 29 minutes: 5
- 30 to 34 minutes: 15
- 35 to 39 minutes: 16
- 40 to 44 minutes: 0
- 45 to 59 minutes: 2
- 60 to 89 minutes: 12
- 90 or more minutes: 45
Means of transportation to work:
- Drove a car alone: 371 (84.9%)
- Carpooled: 53 (12.1%)
- Bus or trolley bus: 3 (0.7%)
- Walked: 3 (0.7%)
- Other means: 2 (0.5%)
- Worked at home: 5 (1.1%)
- Unemployment by race in 2022
- Unemployment rate for White non-Hispanic residents
- 5.5%Females

- Year of entry for the foreign-born population in Sharon, Tennessee
- 02010 or later
- 02000 to 2009
- 131990 to 1999
- 01980 to 1989
- 21970 to 1979
- 0Before 1970

First ancestries reported:
- American: 561 (66.9%)
- English: 55 (6.6%)
- Irish: 25 (3.0%)
- European: 14 (1.7%)
- Italian: 5 (0.6%)
- Welsh: 5 (0.6%)
- Scottish: 4 (0.5%)
- German: 3 (0.4%)
- British: 1 (0.1%)
- Celtic: 1 (0.1%)
Most common places of birth for foreign-born residents (%):
| Sharon: | 81.8% (27) |
| Tennessee: | 2.4% (8,894) |
| Sharon: | 18.2% (6) |
| Tennessee: | 2.7% (10,295) |
Place of birth for U.S.-born residents:
- This state: 685
- Other state: 402
- Northeast: 28
- Midwest: 170
- South: 133
- West: 69
88.8% of Sharon residents lived in the same house 1 years ago.
Out of people who lived in different houses, 39.4% lived in this county.
Out of people who lived in different counties, 4.8% lived in Tennessee.
| Sharon: | 88.8% |
| State average: | 87.0% |
Education attainment for males 25 years and older:
- No schooling: 0
- Nursery to 4th grade: 0
- 5th and 6th grade: 0
- 7th and 8th grade: 18
- 9th grade: 10
- 10th grade: 24
- 11th grade: 13
- 12th grade, no diploma: 3
- High school graduate (or equivalency): 179
- Less than 1 year of college: 37
- Some college more than 1 year, no degree: 19
- Associate degree: 11
- Bachelor's degree: 34
- Master's degree: 10
- Professional school degree: 0
- Doctorate degree: 0

Education attainment for females 25 years and older:
- No schooling: 3
- Nursery to 4th grade: 0
- 5th and 6th grade: 0
- 7th and 8th grade: 14
- 9th grade: 2
- 10th grade: 15
- 11th grade: 18
- 12th grade, no diploma: 3
- High school graduate (or equivalency): 240
- Less than 1 year of college: 23
- Some college more than 1 year, no degree: 65
- Associate degree: 13
- Bachelor's degree: 58
- Master's degree: 31
- Professional school degree: 0
- Doctorate degree: 0


Housing units in structures:
- One, detached: 477
- One, attached: 10
- Two: 55
- 3 or 4: 12
- 5 to 9: 13
- Mobile homes: 11
Housing units lacking complete kitchen facilities in 2022: 4.4%
House/condo owner moved in on average 18 years ago
Renter moved in on average 4 years ago

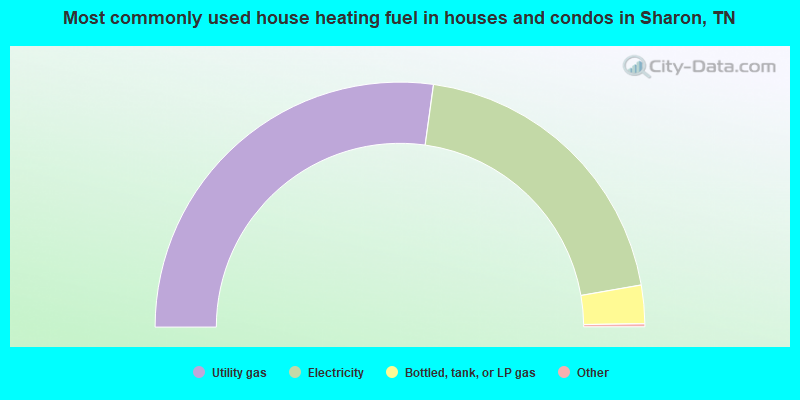
- 54.6%Utility gas
- 40.3%Electricity
- 5.1%Bottled, tank, or LP gas
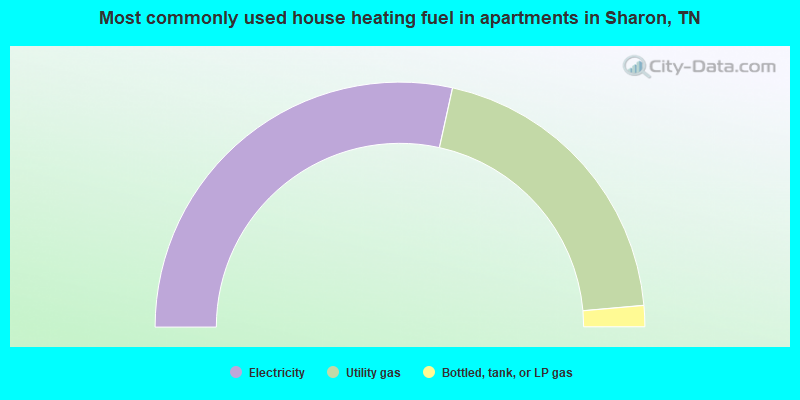
- 56.9%Electricity
- 40.3%Utility gas
- 2.8%Bottled, tank, or LP gas
Private vs. public school enrollment:
| Here: | 0.0% |
| Tennessee: | 15.0% |
| Here: | 0.0% |
| Tennessee: | 16.2% |
| Here: | 35.1% |
| Tennessee: | 23.5% |


