Sharonville, OH (Ohio) Houses and Residents
| Sharonville: | $217,831 |
| Ohio: | $204,100 |
Mean price in 2022:
Detached houses: $264,700
Here: $264,700 State: $254,366 Townhouses or other attached units: $262,230
Here: $262,230 State: $225,733 In 3-to-4-unit structures: $181,803
Here: $181,803 State: $203,002 In 5-or-more-unit structures: $160,441
Here: $160,441 State: $211,593 Mobile homes: $238,153
Here: $238,153 State: $62,719
Total population: 13,581 (All urban)
Houses: 7,317 (6,787 occupied: 4,021 owner occupied, 2,869 renter occupied)
| % of renters here: | 42% |
| State: | 33% |
Housing density: 746 houses/condos per square mile
Median price asked for vacant for-sale houses and condos in 2022: $678,873.
Median contract rent in 2022: $1,015 (lower quartile is $901, upper quartile is $1,315)
Median rent asked for vacant for-rent units in 2022: $2,145
Median gross rent in Sharonville, OH in 2022: $1,133
Housing units in Sharonville with a mortgage: 2,558 (262 second mortgage, 0 home equity loan, 259 both second mortgage and home equity loan)
Houses without a mortgage: 60
Median household income for houses/condos with a mortgage: $99,479
Median household income for apartments without a mortgage: $64,628
Median monthly housing costs: $1,111
Compare current foreclosures near Sharonville, OH:
| Photo | Address | Area | Beds / Baths | Price | Details |
|---|---|---|---|---|---|

|
#1
Lewis St
Middletown, OH 45044
|
960 sq. feet
|
1 baths 3 beds |
$189,900
|
show details |

|
#2
Werner Ave
Cincinnati, OH 45231
|
1,032 sq. feet
|
1 baths 2 beds |
$124,900
|
show details |

|
#3
Beechwood Dr
Fairfield, OH 45014
|
2,468 sq. feet
|
4 baths 5 beds |
$264,900
|
show details |

|
#4
2nd St
Morrow, OH 45152
|
960 sq. feet
|
1 baths 3 beds |
$219,900
|
show details |

|
#5
Trovillo Rd
Morrow, OH 45152
|
2,232 sq. feet
|
2 baths 3 beds |
$199,900
|
show details |

|
#6
Clayton Ave
Middletown, OH 45042
|
- sq. feet
|
1 baths 2 beds |
$65,100
|
show details |

|
#7
3495 Boudinot Ave
Cincinnati, OH 45211
|
1,825 sq. feet
|
2 baths 4 beds |
show details | |

|
#8
Winton St
Middletown, OH 45044
|
1,165 sq. feet
|
1 baths 2 beds |
show details | |

|
#9
Stormy Way
Cincinnati, OH 45230
|
2,448 sq. feet
|
2 baths 4 beds |
show details | |

|
#10
Hemlock Dr
Trenton, OH 45067
|
1,600 sq. feet
|
2 baths 3 beds |
show details |
| Photo | Address | Area | Beds / Baths | Price | Details |
|---|---|---|---|---|---|

|
#11
Kunz Ave
Middletown, OH 45044
|
1,029 sq. feet
|
1 baths 2 beds |
show details | |

|
#12
Scott St
Covington, KY 41011
|
983 sq. feet
|
2 baths 2 beds |
show details | |

|
#13
Regent Rd
Cincinnati, OH 45245
|
1,886 sq. feet
|
3 baths 3 beds |
show details | |

|
#14
Race Rd
Cincinnati, OH 45211
|
1,523 sq. feet
|
2 baths 3 beds |
show details | |

|
#15
Williams St
Cincinnati, OH 45215
|
1,152 sq. feet
|
1 baths 2 beds |
show details | |

|
#16
Roosevelt Blvd
Middletown, OH 45044
|
784 sq. feet
|
1 baths 2 beds |
show details | |

|
#17
Kingsgate Way
West Chester, OH 45069
|
1,600 sq. feet
|
2 baths 3 beds |
show details | |

|
#18
Linda Dr
Cincinnati, OH 45238
|
1,131 sq. feet
|
2 baths 3 beds |
show details | |

|
#19
August Ave
Middletown, OH 45044
|
960 sq. feet
|
1 baths 3 beds |
show details | |

|
#20
El Camino Dr
Middletown, OH 45044
|
1,536 sq. feet
|
2 baths 4 beds |
show details |
| Photo | Address | Area | Beds / Baths | Price | Details |
|---|---|---|---|---|---|

|
#21
Cascade Rd
Cincinnati, OH 45240
|
1,423 sq. feet
|
1 baths 4 beds |
show details | |

|
#22
Amberley Ct
Middletown, OH 45044
|
3,354 sq. feet
|
4 baths 4 beds |
show details | |

|
#23
Knollridge Ln
Cincinnati, OH 45231
|
1,307 sq. feet
|
2 baths 3 beds |
show details | |

|
#24
Bertus St
Cincinnati, OH 45217
|
1,488 sq. feet
|
2 baths 2 beds |
show details | |

|
#25
Creekhill Dr
Cincinnati, OH 45231
|
1,352 sq. feet
|
3 baths 3 beds |
show details | |

|
#26
Leway Dr
Fairfield, OH 45014
|
960 sq. feet
|
1 baths 4 beds |
show details | |

|
#27
Perry St
Cincinnati, OH 45231
|
1,176 sq. feet
|
1 baths 2 beds |
show details | |

|
#28
Kinney Ave
Cincinnati, OH 45207
|
1,057 sq. feet
|
1 baths 3 beds |
show details | |

|
#29
Richwood Ave
Cincinnati, OH 45208
|
2,336 sq. feet
|
2 baths 4 beds |
show details | |

|
#30
Delhi Ave
Cincinnati, OH 45204
|
950 sq. feet
|
1 baths 3 beds |
show details |
| Photo | Address | Area | Beds / Baths | Price | Details |
|---|---|---|---|---|---|

|
#31
S 13th St
Hamilton, OH 45011
|
1,216 sq. feet
|
1 baths 3 beds |
show details | |

|
#32
Ramble Vw Unit 102
Cincinnati, OH 45231
|
1,129 sq. feet
|
2 baths 2 beds |
show details | |

|
#33
Lakeview Dr
Middletown, OH 45044
|
1,825 sq. feet
|
2 baths 4 beds |
show details | |

|
#34
Philloret Dr
Cincinnati, OH 45239
|
1,233 sq. feet
|
1 baths 3 beds |
show details | |

|
#35
Seven Mile Ave
Hamilton, OH 45011
|
720 sq. feet
|
1 baths 2 beds |
show details | |

|
#36
Glade Ave
Cincinnati, OH 45230
|
1,138 sq. feet
|
1 baths 3 beds |
show details | |

|
#37
Yankee Rd
Middletown, OH 45044
|
1,376 sq. feet
|
1 baths 3 beds |
show details | |

|
#38
Kumler Rd
Seven Mile, OH 45062
|
1,530 sq. feet
|
2 baths 3 beds |
show details | |

|
#39
Andrew St
Cincinnati, OH 45217
|
1,172 sq. feet
|
1 baths 3 beds |
show details | |

|
#40
Flemming Rd
Middletown, OH 45042
|
2,478 sq. feet
|
2 baths 3 beds |
show details |
| Photo | Address | Area | Beds / Baths | Price | Details |
|---|---|---|---|---|---|

|
#41
Fairdale Dr
Fairfield, OH 45014
|
1,040 sq. feet
|
1 baths 3 beds |
show details | |

|
#42
Springdale Rd
Cincinnati, OH 45251
|
1,669 sq. feet
|
2 baths 3 beds |
show details | |

|
#43
Lockwood Ave
Hamilton, OH 45011
|
810 sq. feet
|
1 baths 2 beds |
show details | |

|
#44
Susanna Dr
Cincinnati, OH 45251
|
2,089 sq. feet
|
1 baths 3 beds |
show details | |

|
#45
River Valley Ct
Fairfield, OH 45014
|
2,568 sq. feet
|
2 baths 4 beds |
show details | |

|
#46
Mellie Ln
Milford, OH 45150
|
1,350 sq. feet
|
1 baths 4 beds |
show details | |

|
#47
Lang Rd
Cincinnati, OH 45244
|
2,528 sq. feet
|
2 baths 4 beds |
show details | |

|
#48
Harry Lee Ln
Cincinnati, OH 45239
|
1,732 sq. feet
|
2 baths 3 beds |
show details | |

|
#49
Little Turtle Dr
South Lebanon, OH 45065
|
3,842 sq. feet
|
2 baths 4 beds |
show details | |

|
Check over 1 million property listings on Foreclosure.com!
|
browse all offers | |||

Latest news about housing in Sharonville, OH collected exclusively by city-data.com from local newspapers, TV, and radio stations


Median year apartment built: 1984
Household type by relationship:
Households: 13,978- Male householders: 2,954 (813 living alone), Female householders: 3,773 (2,063 living alone)
2,808 spouses (2,756 opposite-sex spouses), 343 unmarried partners, (327 opposite-sex unmarried partners), 3,121 children (2,878 natural, 89 adopted, 152 stepchildren), 82 grandchildren, 13 brothers or sisters, 106 parents, 15 foster children, 328 other relatives, 251 non-relatives
- In group quarters: 177
Size of family households: 1,745 2-persons, 981 3-persons, 520 4-persons, 267 5-persons, 31 6-persons, 1 7-or-more-persons.
Size of nonfamily households: 2,864 1-person, 424 2-persons, 23 3-persons, 12 4-persons.
1,731 married couples with children.
506 single-parent households (26 men, 480 women).
87.6% of residents of Sharonville speak English at home.
5.5% of residents speak Spanish at home (17% speak English very well, 46% speak English well, 37% speak English not well).
2.9% of residents speak other Indo-European language at home (84% speak English very well, 16% speak English well).
2.0% of residents speak Asian or Pacific Island language at home (47% speak English very well, 40% speak English well, 13% speak English not well).
1.0% of residents speak other language at home (69% speak English very well, 31% don't speak English at all).
Foreign born population: 1,477 (10.6%)
(23.6% of them are naturalized citizens)
| Here: | 6.4 |
| State: | 6.7 |
| Here: | 4.0 |
| State: | 4.4 |

- Bedrooms in owner-occupied houses and condos in Sharonville, Ohio
- 0no bedroom
- 651 bedroom
- 9882 bedrooms
- 1,6943 bedrooms
- 1,0954 bedrooms
- 1795+ bedrooms

- Bedrooms in renter-occupied apartments in Sharonville, Ohio
- 104no bedroom
- 8561 bedroom
- 1,3022 bedrooms
- 5653 bedrooms
- 444 bedrooms
- 05+ bedrooms

- Cars and other vehicles available in Sharonville in owner-occupied houses/condos
- 76no vehicle
- 1,4501 vehicle
- 1,7712 vehicles
- 6313 vehicles
- 944 vehicles
- 05+ vehicles

- Cars and other vehicles available in Sharonville in renter-occupied apartments
- 302no vehicle
- 1,4711 vehicle
- 8402 vehicles
- 773 vehicles
- 654 vehicles
- 1145+ vehicles

- Rooms in owner-occupied houses in Sharonville, Ohio
- 01 room
- 02 rooms
- 553 rooms
- 5194 rooms
- 6685 rooms
- 8556 rooms
- 5657 rooms
- 6638 rooms
- 6989+ rooms

- Rooms in renter-occupied apartments in Sharonville, Ohio
- 1041 room
- 1542 rooms
- 6643 rooms
- 9144 rooms
- 6215 rooms
- 1786 rooms
- 2247 rooms
- 128 rooms
- 09+ rooms


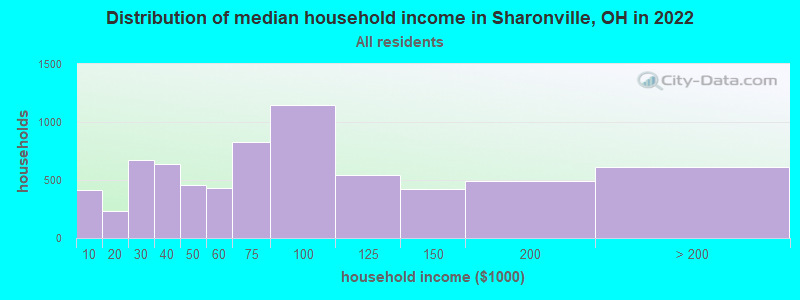
Sharonville, OH household income distribution

- 413Less than $10,000
- 229$10,000 to $19,999
- 674$20,000 to $29,999
- 640$30,000 to $39,999
- 454$40,000 to $49,999
- 434$50,000 to $59,999
- 830$60,000 to $74,999
- 1,148$75,000 to $99,999
- 543$100,000 to $124,999
- 422$125,000 to $149,999
- 493$150,000 to $199,999
- 608$200,000 or more
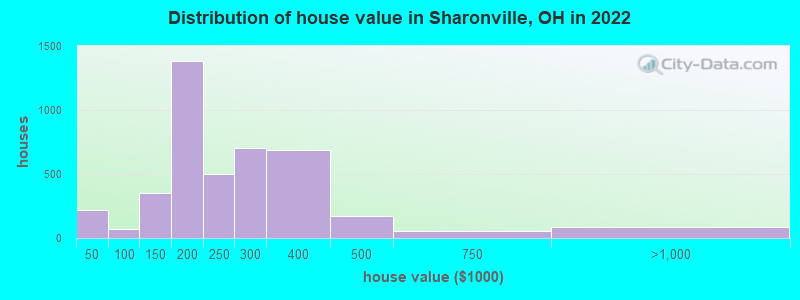
Home value of owner - occupied houses in 2022 in Sharonville, OH
-
- 95Less than $10,000
- 10$10,000 to $14,999
- 46$15,000 to $19,999
- 43$20,000 to $24,999
- 23$40,000 to $49,999
- 12$50,000 to $59,999
- 11$60,000 to $69,999
- 11$70,000 to $79,999
- 11$80,000 to $89,999
- 67$100,000 to $124,999
- 282$125,000 to $149,999
- 937$150,000 to $174,999
- 445$175,000 to $199,999
- 498$200,000 to $249,999
- 702$250,000 to $299,999
- 684$300,000 to $399,999
- 173$400,000 to $499,999
- 50$500,000 to $749,999
- 74$750,000 to $999,999
- 12$1,000,000 to $1,499,999
Rent paid by renters in 2022 in Sharonville, OH
-
- 20$200 to $249
- 15$400 to $449
- 20$450 to $499
- 30$550 to $599
- 41$600 to $649
- 136$650 to $699
- 16$700 to $749
- 166$750 to $799
- 427$800 to $899
- 516$900 to $999
- 632$1,000 to $1,249
- 576$1,250 to $1,499
- 103$1,500 to $1,999
- 84$2,000 to $2,499
- 30$3,000 to $3,499
- 37No cash rent


Percentage of workers working in this county: 60.8%
Number of people working at home: 877 (11.8% of all workers)
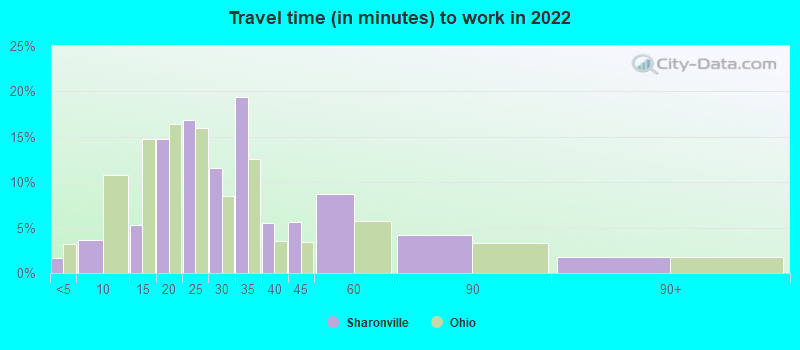
Travel time to work (commute)
- Less than 5 minutes: 221
- 5 to 9 minutes: 726
- 10 to 14 minutes: 1,244
- 15 to 19 minutes: 1,238
- 20 to 24 minutes: 1,270
- 25 to 29 minutes: 529
- 30 to 34 minutes: 632
- 35 to 39 minutes: 66
- 40 to 44 minutes: 101
- 45 to 59 minutes: 203
- 60 to 89 minutes: 122
- 90 or more minutes: 109
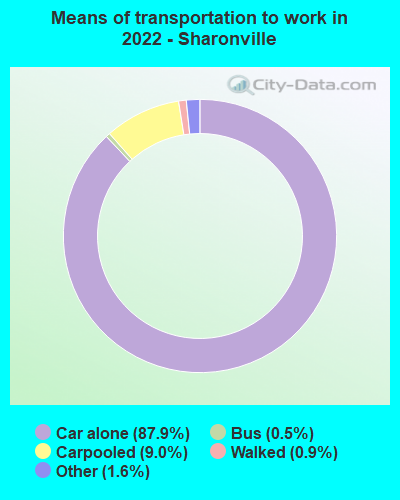
Means of transportation to work:
- Drove a car alone: 18,831 (81.5%)
- Carpooled: 2,025 (8.8%)
- Bus: 126 (0.5%)
- Ferryboat: 16 (0.1%)
- Taxi: 467 (2.0%)
- Bicycle: 3 (0.0%)
- Walked: 201 (0.9%)
- Worked at home: 877 (3.8%)

- Unemployment by race in 2022
- Unemployment rate for White non-Hispanic residents
- 0.9%Males
- 0.4%Females
- Unemployment rate for Black residents
- 6.1%Males
- 2.9%Females
- Unemployment rate for two or more race residents
- 5.4%Males
- Unemployment rate for Hispanic or Latino residents
- 1.9%Males

- Year of entry for the foreign-born population in Sharonville, Ohio
- 9232010 or later
- 1102000 to 2009
- 3941990 to 1999
- 961980 to 1989
- 911970 to 1979
- 112Before 1970

First ancestries reported:
- German: 1,963 (27.8%)
- English: 602 (8.5%)
- American: 574 (8.1%)
- Irish: 323 (4.6%)
- European: 269 (3.8%)
- Italian: 172 (2.4%)
- British: 115 (1.6%)
- Hungarian: 52 (0.7%)
- Polish: 52 (0.7%)
- Iranian: 50 (0.7%)
- Lebanese: 43 (0.6%)
- Scotch-Irish: 38 (0.5%)
- French Canadian: 26 (0.4%)
- Turkish: 21 (0.3%)
- French: 20 (0.3%)
- Greek: 15 (0.2%)
- Norwegian: 15 (0.2%)
- Russian: 11 (0.2%)
- Scottish: 10 (0.1%)
- Czechoslovakian: 1 (0.01%)
Most common places of birth for foreign-born residents (%):
| Sharonville: | 33.2% (501) |
| Ohio: | 11.6% (66,525) |
| Sharonville: | 30.6% (462) |
| Ohio: | 7.8% (44,796) |
| Sharonville: | 6.4% (97) |
| Ohio: | 0.9% (5,331) |
| Sharonville: | 3.3% (50) |
| Ohio: | 0.9% (5,101) |
| Sharonville: | 3.2% (48) |
| Ohio: | 3.1% (17,818) |
| Sharonville: | 2.5% (38) |
| Ohio: | 1.0% (5,444) |
| Sharonville: | 2.1% (31) |
| Ohio: | 0.2% (950) |
| Sharonville: | 1.9% (29) |
| Ohio: | 1.9% (10,960) |
| Sharonville: | 1.8% (27) |
| Ohio: | 0.2% (1,372) |
| Sharonville: | 1.7% (25) |
| Ohio: | 1.6% (9,312) |
Place of birth for U.S.-born residents:
- This state: 9,922
- Other state: 2,512
- Northeast: 420
- Midwest: 693
- South: 1,135
- West: 251
89.5% of Sharonville residents lived in the same house 1 years ago.
Out of people who lived in different houses, 23.9% lived in this county.
Out of people who lived in different counties, 79.7% lived in Ohio.
| Sharonville: | 89.5% |
| State average: | 87.8% |
Education attainment for males 25 years and older:
- No schooling: 73
- Nursery to 4th grade: 46
- 5th and 6th grade: 215
- 7th and 8th grade: 22
- 9th grade: 0
- 10th grade: 92
- 11th grade: 56
- 12th grade, no diploma: 51
- High school graduate (or equivalency): 1,153
- Less than 1 year of college: 208
- Some college more than 1 year, no degree: 475
- Associate degree: 612
- Bachelor's degree: 1,046
- Master's degree: 549
- Professional school degree: 112
- Doctorate degree: 74

Education attainment for females 25 years and older:
- No schooling: 45
- Nursery to 4th grade: 0
- 5th and 6th grade: 0
- 7th and 8th grade: 2
- 9th grade: 19
- 10th grade: 60
- 11th grade: 144
- 12th grade, no diploma: 83
- High school graduate (or equivalency): 1,965
- Less than 1 year of college: 362
- Some college more than 1 year, no degree: 663
- Associate degree: 454
- Bachelor's degree: 918
- Master's degree: 980
- Professional school degree: 83
- Doctorate degree: 50


Housing units in structures:
- One, detached: 3,575
- One, attached: 594
- Two: 228
- 3 or 4: 271
- 5 to 9: 487
- 10 to 19: 971
- 20 to 49: 196
- 50 or more: 614
- Mobile homes: 367
- Boats, RVs, vans, etc.: 11
Housing units lacking complete kitchen facilities in 2022: 0.5%
House/condo owner moved in on average 14 years ago
Renter moved in on average 5 years ago

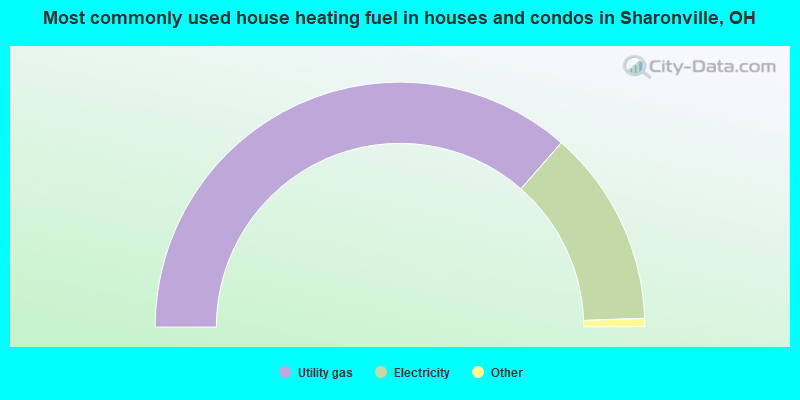
- 72.9%Utility gas
- 26.0%Electricity
- 0.9%Fuel oil, kerosene, etc.
- 0.2%Bottled, tank, or LP gas
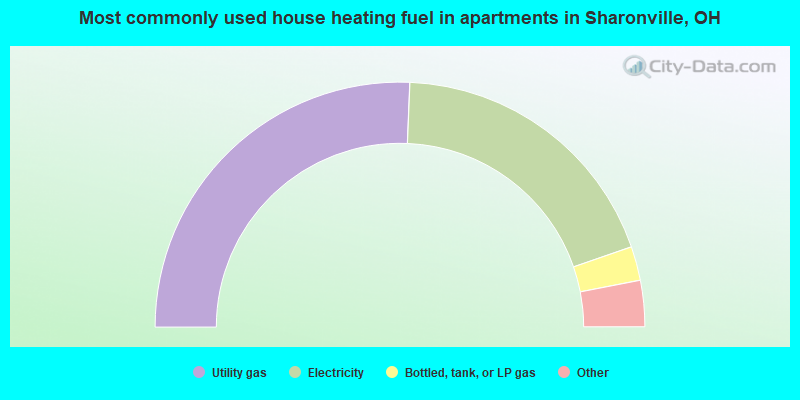
- 51.3%Utility gas
- 38.1%Electricity
- 4.5%Bottled, tank, or LP gas
- 2.7%Wood
- 2.2%No fuel used
- 1.2%Other fuel
Private vs. public school enrollment:
| Here: | 12.5% |
| Ohio: | 16.0% |
| Here: | 23.3% |
| Ohio: | 13.1% |
| Here: | 10.2% |
| Ohio: | 22.3% |


