Shelby, MI (Michigan) Houses and Residents
Estimated median house or condo value in 2022: $327,543 (it was $183,800 in 2000 )
Shelby:
$327,543Michigan:
$224,400
Lower value quartile - upper value quartile: $226,762 - $527,517Total population: 68,294 (Urban population: 64,870, Rural population: 200 (all nonfarm) )
Houses: 25,241 (24,462 occupied: 19,153 owner occupied, 5,309 renter occupied )
% of renters here:
22%State:
27%
Housing density: 728 houses/condos per square mile
Median price asked for vacant for-sale houses and condos in 2022 in this county: $171,571.
Median contract rent in 2022: $1,107 (lower quartile is $961, upper quartile is $1,358)
Median rent asked for vacant for-rent units in 2022: $1,122
Median gross rent in Shelby, MI in 2022: $1,331
Housing units in Shelby with a mortgage: 12,638 (515 second mortgage, 2,646 home equity loan, 35 both second mortgage and home equity loan )Houses without a mortgage: 4,062
Data:
Median house or condo value ($)
Median house or condo value ($ change since 2000)
Median house or condo value ($) - White
Median house or condo value ($) - Black or African American
Median house or condo value ($) - Asian
Median house or condo value ($) - Hispanic or Latino
Median house or condo value ($) - American Indian and Alaska Native
Median house or condo value ($) - Multirace
Median house or condo value ($) - Other Race
Median price asked for mobile homes ($)
Household density (households per square mile)
Mean house or condo value by units in structure - 1, detached ($)
Mean house or condo value by units in structure - 1, attached ($)
Mean house or condo value by units in structure - 2 ($)
Mean house or condo value by units in structure by units in structure - 3 or 4 ($)
Mean house or condo value by units in structure - 5 or more ($)
Mean house or condo value by units in structure - Boat, RV, van, etc. ($)
Mean house or condo value by units in structure - Mobile home ($)
Median contract rent ($)
Median contract rent - Lower quartile ($)
Median contract rent - Upper quartile ($)
Median gross rent ($)
Urban houses (%)
Rural houses (%)
Houses occupied (%)
Houses occupied (% change since 2000)
Houses owner occupied (%)
Houses owner occupied (% change since 2000)
Houses renter occupied (%)
Houses renter occupied (% change since 2000)
Vacant housing units - For rent (%)
Vacant housing units - For rent (% change since 2000)
Vacant housing units - For sale only (%)
Vacant housing units - For sale only (% change since 2000)
Vacant housing units - Rented or sold, not occupied (%)
Vacant housing units - Rented or sold, not occupied (% change since 2000)
Vacant housing units - For seasonal, recreational, or occasional use (%)
Vacant housing units - For seasonal, recreational, or occasional use (% change since 2000)
Vacant housing units - For migrant workers (%)
Vacant housing units - For migrant workers (% change since 2000)
Vacant housing units - Other vacant (%)
Vacant housing units - Other vacant (% change since 2000)
Median monthly housing costs ($)
Median household income for houses/condos with a mortgage ($)
Median household income for houses/condos without a mortgage ($)
Median household income ($)
Median household income ($) - White
Median household income ($) - Black or African American
Median household income ($) - Asian
Median household income ($) - Hispanic or Latino
Median household income ($) - American Indian and Alaska Native
Median household income ($) - Multirace
Median household income ($) - Other Race
Mortgage status - with mortgage (%)
Mortgage status - with second mortgage (%)
Mortgage status - with home equity loan (%)
Mortgage status - with both second mortgage and home equity loan (%)
Mortgage status - without a mortgage (%)
Median year house/condo built
Median year apartment built
Household type by relationship - Male householder living alone (%)
Household type by relationship - Male householder not living alone (%)
Household type by relationship - Female householder living alone (%)
Household type by relationship - Female householder not living alone (%)
Household type by relationship - Opposite-Sex spouse (%)
Household type by relationship - Same-Sex spouse (%)
Household type by relationship - Opposite-Sex unmarried partner (%)
Household type by relationship - Same-Sex unmarried partner (%)
Household type by relationship - In group quarters (%)
Size of family households - 2-person household (%)
Size of family households - 3-person household (%)
Size of family households - 4-person household (%)
Size of family households - 5-person household (%)
Size of family households - 6-person household (%)
Size of family households - 7-or-more-person household (%)
Size of nonfamily households - 1-person household (%)
Size of nonfamily households - 2-person household (%)
Size of nonfamily households - 3-person household (%)
Size of nonfamily households - 4-person household (%)
Size of nonfamily households - 5-person household (%)
Size of nonfamily households - 6-person household (%)
Size of nonfamily households - 7-or-moreperson household (%)
Year house built - Built 2010 or later (%)
Year house built - Built 2000 to 2009 (%)
Year house built - Built 1990 to 1999 (%)
Year house built - Built 1980 to 1989 (%)
Year house built - Built 1970 to 1979 (%)
Year house built - Built 1960 to 1969 (%)
Year house built - Built 1950 to 1959 (%)
Year house built - Built 1940 to 1949 (%)
Year house built - Built 1939 or earlier (%)
Median number of rooms in houses and condos
Median number of rooms in apartments
Median number of bedrooms in owner occupied houses
Mean number of bedrooms in owner occupied houses
Median number of bedrooms in renter occupied houses
Mean number of bedrooms in renter occupied houses
Median number of vehichles in owner occupied houses
Mean number of vehichles in owner occupied houses
Median number of vehichles in renter occupied houses
Mean number of vehichles in renter occupied houses
Rooms in owner-occupied houses - 1 room (%)
Rooms in owner-occupied houses - 2 rooms (%)
Rooms in owner-occupied houses - 3 rooms (%)
Rooms in owner-occupied houses - 4 rooms (%)
Rooms in owner-occupied houses - 5 rooms (%)
Rooms in owner-occupied houses - 6 rooms (%)
Rooms in owner-occupied houses - 7 rooms (%)
Rooms in owner-occupied houses - 8 rooms (%)
Rooms in owner-occupied houses - 9+ rooms (%)
Rooms in renter-occupied houses - 1 room (%)
Rooms in renter-occupied houses - 2 rooms (%)
Rooms in renter-occupied houses - 3 rooms (%)
Rooms in renter-occupied houses - 4 rooms (%)
Rooms in renter-occupied houses - 5 rooms (%)
Rooms in renter-occupied houses - 6 rooms (%)
Rooms in renter-occupied houses - 7 rooms (%)
Rooms in renter-occupied houses - 8 rooms (%)
Rooms in renter-occupied houses - 9+ rooms (%)
Bedrooms in owner-occupied houses - no bedrooms (%)
Bedrooms in owner-occupied houses - 1 bedroom (%)
Bedrooms in owner-occupied houses - 2 bedrooms (%)
Bedrooms in owner-occupied houses - 3 bedrooms (%)
Bedrooms in owner-occupied houses - 4 bedrooms (%)
Bedrooms in owner-occupied houses - 5+ bedrooms (%)
Bedrooms in renter-occupied houses - no bedrooms (%)
Bedrooms in renter-occupied houses - 1 bedroom (%)
Bedrooms in renter-occupied houses - 2 bedrooms (%)
Bedrooms in renter-occupied houses - 3 bedrooms (%)
Bedrooms in renter-occupied houses - 4 bedrooms (%)
Bedrooms in renter-occupied houses - 5+ bedrooms (%)
Vehicles available in owner-occupied houses - no vehicle available (%)
Vehicles available in owner-occupied houses - 1 vehicle available(%)
Vehicles available in owner-occupied houses - 2 Vehicles available (%)
Vehicles available in owner-occupied houses - 3 Vehicles available (%)
Vehicles available in owner-occupied houses - 4 Vehicles available (%)
Vehicles available in owner-occupied houses - 5+ Vehicles available (%)
Vehicles available in renter-occupied houses - no vehicle available (%)
Vehicles available in renter-occupied houses - 1 vehicle available (%)
Vehicles available in renter-occupied houses - 2 Vehicles available (%)
Vehicles available in renter-occupied houses - 3 Vehicles available (%)
Vehicles available in renter-occupied houses - 4 Vehicles available (%)
Vehicles available in renter-occupied houses - 5+ Vehicles available (%)
Housing units in structures - 1, detached (%)
Housing units in structures - 1, attached (%)
Housing units in structures - 2 (%)
Housing units in structures - 3 or 4 (%)
Housing units in structures - 5 to 9 (%)
Housing units in structures - 10 to 19 (%)
Housing units in structures - 20 to 49 (%)
Housing units in structures - 50 or more (%)
Housing units in structures - Mobile home (%)
Housing units in structures - Boat, RV, van, etc. (%)
Housing units in structures - Owners - 1, detached (%)
Housing units in structures - Owners - 1, attached (%)
Housing units in structures - Owners - 2 (%)
Housing units in structures - Owners - 3 or 4 (%)
Housing units in structures - Owners - 5 to 9 (%)
Housing units in structures - Owners - 10 to 19 (%)
Housing units in structures - Owners - 20 to 49 (%)
Housing units in structures - Owners - 50 or more (%)
Housing units in structures - Owners - Mobile home (%)
Housing units in structures - Owners - Boat, RV, van, etc. (%)
Housing units in structures - Renters - 1, detached (%)
Housing units in structures - Renters - 1, attached (%)
Housing units in structures - Renters - 2 (%)
Housing units in structures - Renters - 3 or 4 (%)
Housing units in structures - Renters - 5 to 9 (%)
Housing units in structures - Renters - 10 to 19 (%)
Housing units in structures - Renters - 20 to 49 (%)
Housing units in structures - Renters - 50 or more (%)
Housing units in structures - Renters - Mobile home (%)
Housing units in structures - Renters - Boat, RV, van, etc. (%)
House/condo owner moved in on average (years ago)
Renter moved in on average (years ago)
Year householder moved into unit - Moved in 1999 to March 2000 (%)
Year householder moved into unit - Moved in 1999 to March 2000 (%) - White
Year householder moved into unit - Moved in 1999 to March 2000 (%) - Black or African American
Year householder moved into unit - Moved in 1999 to March 2000 (%) - Asian
Year householder moved into unit - Moved in 1999 to March 2000 (%) - Hispanic or Latino
Year householder moved into unit - Moved in 1999 to March 2000 (%) - American Indian and Alaska Native
Year householder moved into unit - Moved in 1999 to March 2000 (%) - Multirace
Year householder moved into unit - Moved in 1999 to March 2000 (%) - Other Race
Year householder moved into unit - Moved in 1995 to 1998 (%)
Year householder moved into unit - Moved in 1995 to 1998 (%) - White
Year householder moved into unit - Moved in 1995 to 1998 (%) - Black or African American
Year householder moved into unit - Moved in 1995 to 1998 (%) - Asian
Year householder moved into unit - Moved in 1995 to 1998 (%) - Hispanic or Latino
Year householder moved into unit - Moved in 1995 to 1998 (%) - American Indian and Alaska Native
Year householder moved into unit - Moved in 1995 to 1998 (%) - Multirace
Year householder moved into unit - Moved in 1995 to 1998 (%) - Other Race
Year householder moved into unit - Moved in 1990 to 1994 (%)
Year householder moved into unit - Moved in 1990 to 1994 (%) - White
Year householder moved into unit - Moved in 1990 to 1994 (%) - Black or African American
Year householder moved into unit - Moved in 1990 to 1994 (%) - Asian
Year householder moved into unit - Moved in 1990 to 1994 (%) - Hispanic or Latino
Year householder moved into unit - Moved in 1990 to 1994 (%) - American Indian and Alaska Native
Year householder moved into unit - Moved in 1990 to 1994 (%) - Multirace
Year householder moved into unit - Moved in 1990 to 1994 (%) - Other Race
Year householder moved into unit - Moved in 1980 to 1989 (%)
Year householder moved into unit - Moved in 1980 to 1989 (%) - White
Year householder moved into unit - Moved in 1980 to 1989 (%) - Black or African American
Year householder moved into unit - Moved in 1980 to 1989 (%) - Asian
Year householder moved into unit - Moved in 1980 to 1989 (%) - Hispanic or Latino
Year householder moved into unit - Moved in 1980 to 1989 (%) - American Indian and Alaska Native
Year householder moved into unit - Moved in 1980 to 1989 (%) - Multirace
Year householder moved into unit - Moved in 1980 to 1989 (%) - Other Race
Year householder moved into unit - Moved in 1970 to 1979 (%)
Year householder moved into unit - Moved in 1970 to 1979 (%) - White
Year householder moved into unit - Moved in 1970 to 1979 (%) - Black or African American
Year householder moved into unit - Moved in 1970 to 1979 (%) - Asian
Year householder moved into unit - Moved in 1970 to 1979 (%) - Hispanic or Latino
Year householder moved into unit - Moved in 1970 to 1979 (%) - American Indian and Alaska Native
Year householder moved into unit - Moved in 1970 to 1979 (%) - Multirace
Year householder moved into unit - Moved in 1970 to 1979 (%) - Other Race
Year householder moved into unit - Moved in 1969 or earlier (%)
Year householder moved into unit - Moved in 1969 or earlier (%) - White
Year householder moved into unit - Moved in 1969 or earlier (%) - Black or African American
Year householder moved into unit - Moved in 1969 or earlier (%) - Asian
Year householder moved into unit - Moved in 1969 or earlier (%) - Hispanic or Latino
Year householder moved into unit - Moved in 1969 or earlier (%) - American Indian and Alaska Native
Year householder moved into unit - Moved in 1969 or earlier (%) - Multirace
Year householder moved into unit - Moved in 1969 or earlier (%) - Other Race
Housing units lacking complete plumbing facilities (%)
Housing units lacking complete kitchen facilities (%)
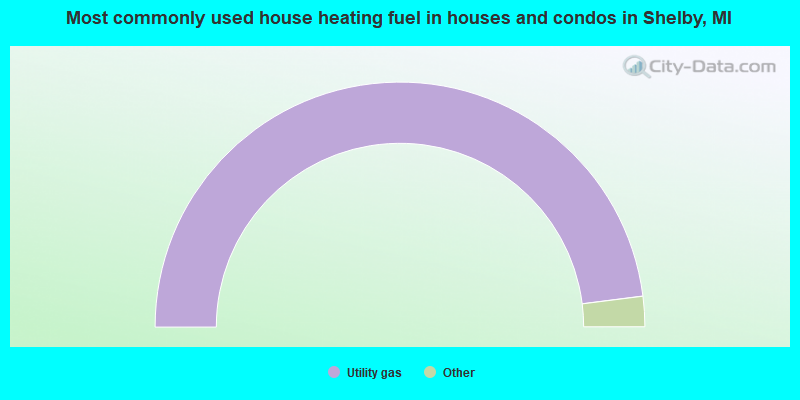
House heating fuel used in houses and condos - Utility gas (%)
House heating fuel used in houses and condos - Bottled, tank, or LP gas (%)
House heating fuel used in houses and condos - Electricity (%)
House heating fuel used in houses and condos - Fuel oil, kerosene, etc. (%)
House heating fuel used in houses and condos - Coal or coke (%)
House heating fuel used in houses and condos - Wood (%)
House heating fuel used in houses and condos - Solar energy (%)
House heating fuel used in houses and condos - Other fuel (%)
House heating fuel used in houses and condos - No fuel used (%)
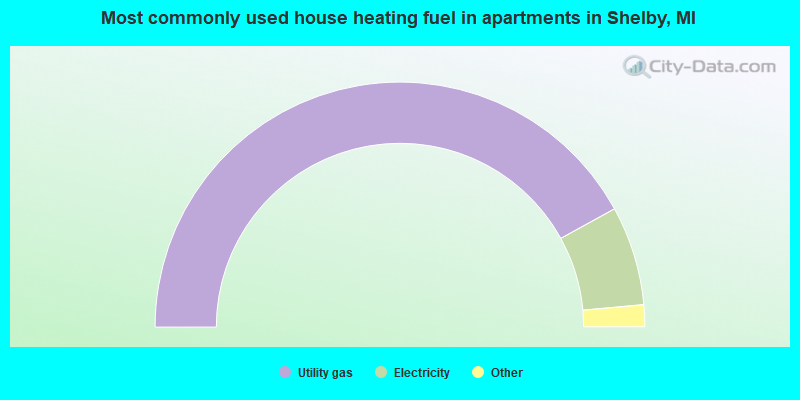
House heating fuel used in apartments - Utility gas (%)
House heating fuel used in apartments - Bottled, tank, or LP gas (%)
House heating fuel used in apartments - Electricity (%)
House heating fuel used in apartments - Fuel oil, kerosene, etc. (%)
House heating fuel used in apartments - Coal or coke (%)
House heating fuel used in apartments - Wood (%)
House heating fuel used in apartments - Solar energy (%)
House heating fuel used in apartments - Other fuel (%)
House heating fuel used in apartments - No fuel used (%)
Latest news about housing in Shelby, MI collected exclusively by city-data.com from local newspapers, TV, and radio stations
Household type by relationship:
Households: 833,546
In family households: 704,594 (157,909 male householders , 64,440 female householders )
164,768 spouses , 259,372 children (243,468 natural , 5,162 adopted , 10,742 stepchildren ), 13,500 grandchildren , 8,519 brothers or sisters , 8,548 parents , foster children , 7,541 other relatives , 15,395 non-relatives In nonfamily households: 128,952 (49,238 male householders (39,884 living alone )), 60,080 female householders (53,109 living alone )), 19,634 nonrelatives In group quarters: 7,432 (5,842 institutionalized population)
144,010 married couples with children. single-parent households (7,637 men , 25,553 women ).
86.4% of residents of Shelby speak English at home. of residents speak Spanish at home (56% speak English very well , 17% speak English well , 25% speak English not well , 2% don't speak English at all ).of residents speak other Indo-European language at home (62% speak English very well , 24% speak English well , 12% speak English not well , 2% don't speak English at all ).of residents speak Asian or Pacific Island language at home (53% speak English very well , 25% speak English well , 16% speak English not well , 6% don't speak English at all ).of residents speak other language at home (65% speak English very well , 27% speak English well , 7% speak English not well , 2% don't speak English at all ).
Foreign born population: 8,901 (12.3%)of them are naturalized citizens )
Median number of rooms in houses and condos:
Median number of rooms in apartments
Owner-occupied Renter-occupied
Rooms in owner-occupied houses in Shelby, Michigan
0 1 room 42 2 rooms 305 3 rooms 1,251 4 rooms 3,612 5 rooms 4,423 6 rooms 3,076 7 rooms 2,924 8 rooms 3,520 9+ rooms
Rooms in renter-occupied apartments in Shelby, Michigan
86 1 room 523 2 rooms 1,237 3 rooms 1,987 4 rooms 988 5 rooms 287 6 rooms 77 7 rooms 61 8 rooms 63 9+ rooms
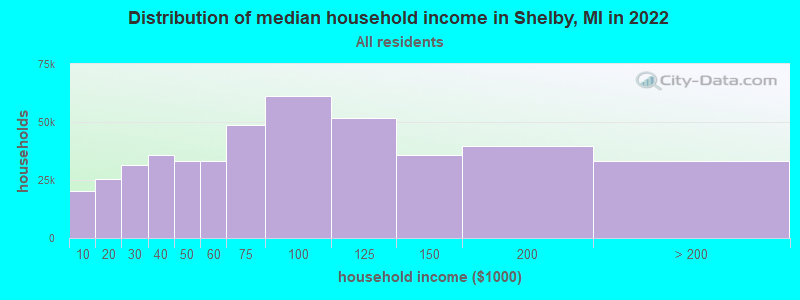
Shelby, MI household income distribution 20,277 Less than $10,00025,351 $10,000 to $19,99931,383 $20,000 to $29,99935,886 $30,000 to $39,99933,262 $40,000 to $49,99933,330 $50,000 to $59,99948,728 $60,000 to $74,99961,315 $75,000 to $99,99951,851 $100,000 to $124,99935,618 $125,000 to $149,99939,765 $150,000 to $199,99933,223 $200,000 or more
Percentage of workers working in this county: 62.2%Number of people working at home: 5,348 (14.4% of all workers )
Travel time to work (commute)
Less than 5 minutes: 5315 to 9 minutes: 2,25810 to 14 minutes: 3,97215 to 19 minutes: 4,44620 to 24 minutes: 4,78225 to 29 minutes: 2,48030 to 34 minutes: 5,46435 to 39 minutes: 1,13340 to 44 minutes: 1,61845 to 59 minutes: 3,31960 to 89 minutes: 1,83490 or more minutes: 458
Means of transportation to work:
Drove a car alone: 29,757 (89.8%)Carpooled: 2,097 (6.3%)Bus or trolley bus : 110 (0.3%)Streetcar or trolley car : 14 (0.0%)Ferryboat: 4 (0.0%)Taxi: 19 (0.1%)Motorcycle: 13 (0.0%)Bicycle: 34 (0.1%)Walked: 156 (0.5%)Other means: 91 (0.3%)Worked at home: 840 (2.5%)
Year of entry for the foreign-born population in Shelby, Michigan
1,749 1995 to March 2000 553 1990 to 1994 479 1985 to 1989 483 1980 to 1984 350 1975 to 1979 582 1970 to 1974 706 1965 to 1969 1,393 Before 1965
First ancestries reported:
German: 16,131 (20.0%)
Polish: 12,462 (15.4%)
Other: 11,859 (14.7%)
Italian: 9,430 (11.7%)
Irish: 7,170 (8.9%)
English: 6,121 (7.6%)
French: 3,178 (3.9%)
United States: 2,408 (3.0%)
Scottish: 1,702 (2.1%)
French Canadian: 1,456 (1.8%)
Arab: 1,147 (1.4%)
Scotch-Irish: 1,077 (1.3%)
Dutch: 970 (1.2%)
Swedish: 783 (1.0%)
Hungarian: 727 (0.9%)
Greek: 726 (0.9%)
Russian: 637 (0.8%)
Ukrainian: 619 (0.8%)
Czech: 535 (0.7%)
Slovak: 367 (0.5%)
Norwegian: 364 (0.5%)
Welsh: 329 (0.4%)
Danish: 204 (0.3%)
Lithuanian: 165 (0.2%)
Swiss: 72 (0.09%)
West Indian: 54 (0.07%)
Subsaharan African: 51 (0.06%)
Portuguese: 29 (0.04%) Most common places of birth for foreign-born residents (%): Italy Shelby:
12.6% (795)Michigan:
2.8% (14,655)
Yugoslavia Shelby:
10.6% (669)Michigan:
1.8% (9,425)
Other Eastern Europe Shelby:
9.9% (622)Michigan:
2.9% (14,958)
Canada Shelby:
9.0% (564)Michigan:
9.5% (49,515)
India Shelby:
7.5% (473)Michigan:
6.9% (36,323)
Germany Shelby:
5.5% (346)Michigan:
4.4% (22,814)
Poland Shelby:
5.5% (345)Michigan:
2.9% (15,303)
Iraq Shelby:
5.4% (342)Michigan:
6.1% (31,927)
United Kingdom Shelby:
4.8% (300)Michigan:
3.9% (20,614)
Romania Shelby:
3.6% (225)Michigan:
1.6% (8,579)
Mexico Shelby:
2.7% (173)Michigan:
11.2% (58,392)
Korea Shelby:
2.7% (170)Michigan:
3.5% (18,107)
Philippines Shelby:
2.7% (169)Michigan:
2.6% (13,679)
Greece Shelby:
2.2% (136)Michigan:
1.0% (5,044)
Lebanon Shelby:
1.5% (95)Michigan:
3.5% (18,102)
Place of birth for U.S.-born residents:
This state: 50,043Other state: 8,297Northeast: 1,703Midwest: 3,115South: 2,540West: 939 55% of Shelby residents lived in the same house 5 years ago.
Out of people who lived in different houses, 64% lived in this county.
Out of people who lived in different counties, 74% lived in Michigan.
Education attainment for males 25 years and older:
No schooling: 171Nursery to 4th grade: 535th and 6th grade: 1617th and 8th grade: 4319th grade: 27010th grade: 38711th grade: 42212th grade, no diploma: 661High school graduate (or equivalency): 5,024Less than 1 year of college: 1,781Some college more than 1 year, no degree: 3,588Associate degree: 1,763Bachelor's degree: 4,099Master's degree: 1,846Professional school degree: 433Doctorate degree: 140
Education attainment for females 25 years and older:
No schooling: 146Nursery to 4th grade: 965th and 6th grade: 2077th and 8th grade: 4749th grade: 37310th grade: 47011th grade: 44712th grade, no diploma: 661High school graduate (or equivalency): 7,141Less than 1 year of college: 1,980Some college more than 1 year, no degree: 3,195Associate degree: 1,955Bachelor's degree: 3,291Master's degree: 1,310Professional school degree: 212Doctorate degree: 56
Housing units in structures:
One, detached: 16,138One, attached: 2,170Two: 1473 or 4: 7965 to 9: 1,74310 to 19: 1,66220 to 49: 44950 or more: 579Mobile homes: 1,543Boats, RVs, vans, etc.: 14Median worth of mobile homes: $49,943
Housing units lacking complete plumbing facilities: 0.3%Housing units lacking complete kitchen facilities: 0.1%Private vs. public school enrollment:
Students in private schools in grades 1 to 8 (elementary and middle school): 781 Students in private schools in grades 9 to 12 (high school): 436 Students in private undergraduate colleges: 456