Shenandoah, TX (Texas) Houses and Residents
| Shenandoah: | $388,591 |
| Texas: | $275,400 |
Mean price in 2022:
Detached houses: $457,052
Here: $457,052 State: $369,058
Total population: 2,664 (Urban population: 1,481, Rural population: 6 (all nonfarm))
Houses: 2,082 (2,002 occupied: 1,186 owner occupied, 851 renter occupied)
| % of renters here: | 42% |
| State: | 38% |
Housing density: 1,650 houses/condos per square mile
Median price asked for vacant for-sale houses and condos in 2022 in this county: $450,601.
Median contract rent in 2022: $1,192 (lower quartile is $1,066, upper quartile is $1,441)
Median rent asked for vacant for-rent units in 2022: $1,109
Median gross rent in Shenandoah, TX in 2022: $1,247
Housing units in Shenandoah with a mortgage: 546 (0 second mortgage, 0 home equity loan, 0 both second mortgage and home equity loan)
Houses without a mortgage: 0
Median household income for houses/condos with a mortgage: $142,757
Median monthly housing costs: $1,277
Compare current foreclosures near Shenandoah, TX:
| Photo | Address | Area | Beds / Baths | Price | Details |
|---|---|---|---|---|---|

|
#1
Rosegate Dr
Spring, TX 77373
|
1,496 sq. feet
|
2 baths 4 beds |
$219,900
|
show details |

|
#2
Glenheath
Montgomery, TX 77316
|
2,225 sq. feet
|
3 baths 3 beds |
$249,900
|
show details |

|
#3
Havenwoods Dr
Houston, TX 77066
|
3,305 sq. feet
|
2 baths 4 beds |
show details | |

|
#4
Silverchase Mdws Dr
Houston, TX 77014
|
- sq. feet
|
2 baths 3 beds |
show details | |

|
#5
Santa Elena Cyn
Spring, TX 77388
|
3,264 sq. feet
|
4 baths 5 beds |
show details | |

|
#6
Swords Creek Rd
Houston, TX 77067
|
1,454 sq. feet
|
2 baths 3 beds |
show details | |

|
#7
Cypress Hill Dr
Spring, TX 77388
|
2,332 sq. feet
|
3 baths 3 beds |
show details | |

|
#8
Spring Creek Ln
Spring, TX 77379
|
3,325 sq. feet
|
3 baths 4 beds |
show details | |

|
#9
Bridle Creek Dr S
Magnolia, TX 77355
|
4,222 sq. feet
|
4 baths 4 beds |
show details | |

|
#10
Ashton Ln
Pinehurst, TX 77362
|
1,815 sq. feet
|
2 baths 3 beds |
show details |
| Photo | Address | Area | Beds / Baths | Price | Details |
|---|---|---|---|---|---|

|
#11
Windrift Dr
Houston, TX 77066
|
1,966 sq. feet
|
2 baths 3 beds |
show details | |

|
#12
Jelly Pines Drive
Conroe, TX 77302
|
- sq. feet
|
2 baths 4 beds |
show details | |

|
#13
Elm Green St
Spring, TX 77373
|
2,067 sq. feet
|
2 baths 4 beds |
show details | |

|
#14
Danny Ln
Willis, TX 77318
|
- sq. feet
|
4 baths 4 beds |
show details | |

|
#15
Linnwood Dr
New Caney, TX 77357
|
2,278 sq. feet
|
2 baths 3 beds |
show details | |

|
#16
Harrow Field Lane
Spring, TX 77373
|
- sq. feet
|
2 baths 4 beds |
show details | |

|
#17
Arbor Point Ct
Pinehurst, TX 77362
|
- sq. feet
|
2 baths 3 beds |
show details | |

|
#18
Remington Bend Dr
Houston, TX 77073
|
2,300 sq. feet
|
2 baths 4 beds |
show details | |

|
#19
Silverchase Meadows Dr
Houston, TX 77014
|
2,044 sq. feet
|
2 baths 3 beds |
show details | |

|
#20
Mantana Dr
Spring, TX 77388
|
2,474 sq. feet
|
2 baths 4 beds |
show details |
| Photo | Address | Area | Beds / Baths | Price | Details |
|---|---|---|---|---|---|

|
#21
Seven Pines Dr
Spring, TX 77379
|
- sq. feet
|
2 baths 3 beds |
show details | |

|
#22
Mostyn Dr
Magnolia, TX 77354
|
2,357 sq. feet
|
2 baths 4 beds |
show details | |

|
#23
Valley Ridge Drive
New Caney, TX 77357
|
- sq. feet
|
2 baths 3 beds |
show details | |

|
#24
Pointed Edge Ln
Cypress, TX 77429
|
2,286 sq. feet
|
3 baths 4 beds |
show details | |

|
#25
Windy Oaks Ct
Porter, TX 77365
|
1,591 sq. feet
|
2 baths 3 beds |
show details | |

|
#26
Ferney Ln
Porter, TX 77365
|
1,120 sq. feet
|
2 baths 4 beds |
show details | |

|
#27
Pointed Edge Lane
Cypress, TX 77429
|
- sq. feet
|
3 baths 4 beds |
show details | |

|
#28
Bedford Ln
Conroe, TX 77303
|
1,389 sq. feet
|
2 baths 3 beds |
show details | |

|
#29
Cashel Forest Dr
Houston, TX 77069
|
1,643 sq. feet
|
2 baths 3 beds |
show details | |

|
#30
Stallion Trail Dr
Humble, TX 77338
|
1,435 sq. feet
|
2 baths 3 beds |
show details |
| Photo | Address | Area | Beds / Baths | Price | Details |
|---|---|---|---|---|---|

|
#31
Pine Ln
New Caney, TX 77357
|
- sq. feet
|
2 baths 3 beds |
show details | |

|
#32
Royal Glen Dr
Humble, TX 77339
|
2,165 sq. feet
|
2 baths 4 beds |
show details | |

|
#33
Mattingham Dr
Houston, TX 77066
|
1,076 sq. feet
|
2 baths 3 beds |
show details | |

|
#34
Linnwood Dr
New Caney, TX 77357
|
1,248 sq. feet
|
1 baths 3 beds |
show details | |

|
#35
Summer Pine Dr
Spring, TX 77373
|
914 sq. feet
|
1 baths 2 beds |
show details | |

|
#36
Kate Place Ct
Montgomery, TX 77316
|
- sq. feet
|
3 baths 4 beds |
show details | |

|
#37
Summerberry Ln
Tomball, TX 77375
|
1,080 sq. feet
|
2 baths 2 beds |
show details | |

|
#38
Saddlecreek Dr
Houston, TX 77090
|
- sq. feet
|
2 baths 5 beds |
show details | |

|
#39
Sgt Ed Holcomb Blvd S
Conroe, TX 77304
|
- sq. feet
|
2 baths 4 beds |
show details | |

|
#40
Westerham Pl
Houston, TX 77069
|
3,479 sq. feet
|
3 baths 4 beds |
show details |
| Photo | Address | Area | Beds / Baths | Price | Details |
|---|---|---|---|---|---|

|
#41
Mirror Ct
Spring, TX 77388
|
1,950 sq. feet
|
3 baths 4 beds |
show details | |

|
#42
Landry Blvd
Houston, TX 77070
|
1,944 sq. feet
|
2 baths 3 beds |
show details | |

|
#43
Aldergrove Dr
Spring, TX 77388
|
1,761 sq. feet
|
1 baths 3 beds |
show details | |

|
#44
Countryroad Dr
Spring, TX 77388
|
3,381 sq. feet
|
2 baths 4 beds |
show details | |

|
#45
Randal Point Ct
Spring, TX 77388
|
4,527 sq. feet
|
3 baths 4 beds |
show details | |

|
#46
Coltwood Dr
Spring, TX 77388
|
3,089 sq. feet
|
2 baths 4 beds |
show details | |

|
#47
Spring City Ct
Houston, TX 77090
|
1,781 sq. feet
|
2 baths 3 beds |
show details | |

|
#48
Jasmine Terrace Dr
Spring, TX 77373
|
2,626 sq. feet
|
2 baths 4 beds |
show details | |

|
#49
Cypressdale Dr
Spring, TX 77388
|
1,657 sq. feet
|
2 baths 3 beds |
show details | |

|
Check over 1 million property listings on Foreclosure.com!
|
browse all offers | |||

Latest news about housing in Shenandoah, TX collected exclusively by city-data.com from local newspapers, TV, and radio stations

 | Buying a house in the Woodlands / Shenandoah? (5 replies) |
| House hunting next week... (76 replies) |
| Are there any non-"master planned community" housing in good school districts? (46 replies) |
| All Possible apartments near Houston in the most quiet place possible? (5 replies) |
| Neighborhoods that have turned bad (100 replies) |
| Which is better for us? Austin OR Dallas? (69 replies) |

Median year apartment built: 2008
Household type by relationship:
Households: 3,748- Male householders: 1,101 (84 living alone), Female householders: 872 (547 living alone)
1,099 spouses (1,099 opposite-sex spouses), 145 unmarried partners, (145 opposite-sex unmarried partners), 322 children (322 natural, 0 adopted, 0 stepchildren), 0 grandchildren, 110 brothers or sisters, 72 parents, 0 foster children, 0 other relatives, 0 non-relatives
- In group quarters: 24
Size of family households: 910 2-persons, 230 3-persons, 70 4-persons.
Size of nonfamily households: 731 1-person, 137 2-persons.
263 married couples with children.
0 single-parent households (0 men, 0 women).
78.1% of residents of Shenandoah speak English at home.
17.4% of residents speak Spanish at home (82% speak English very well, 6% speak English well, 5% speak English not well, 7% don't speak English at all).
1.6% of residents speak other Indo-European language at home (100% speak English very well).
5.0% of residents speak Asian or Pacific Island language at home (44% speak English very well, 56% speak English well).
Foreign born population: 690 (18.4%)
(74.2% of them are naturalized citizens)
| Here: | 6.4 |
| State: | 6.3 |
| Here: | 3.8 |
| State: | 4.0 |

- Bedrooms in owner-occupied houses and condos in Shenandoah, Texas
- 0no bedroom
- 01 bedroom
- 462 bedrooms
- 4703 bedrooms
- 6444 bedrooms
- 275+ bedrooms

- Bedrooms in renter-occupied apartments in Shenandoah, Texas
- 0no bedroom
- 4361 bedroom
- 3952 bedrooms
- 03 bedrooms
- 214 bedrooms
- 05+ bedrooms

- Cars and other vehicles available in Shenandoah in owner-occupied houses/condos
- 0no vehicle
- 1391 vehicle
- 7262 vehicles
- 2113 vehicles
- 394 vehicles
- 715+ vehicles

- Cars and other vehicles available in Shenandoah in renter-occupied apartments
- 92no vehicle
- 4601 vehicle
- 1872 vehicles
- 1123 vehicles
- 04 vehicles
- 05+ vehicles

- Rooms in owner-occupied houses in Shenandoah, Texas
- 01 room
- 02 rooms
- 03 rooms
- 04 rooms
- 4165 rooms
- 1936 rooms
- 887 rooms
- 1978 rooms
- 2929+ rooms

- Rooms in renter-occupied apartments in Shenandoah, Texas
- 01 room
- 212 rooms
- 2773 rooms
- 3084 rooms
- 2095 rooms
- 166 rooms
- 07 rooms
- 218 rooms
- 09+ rooms


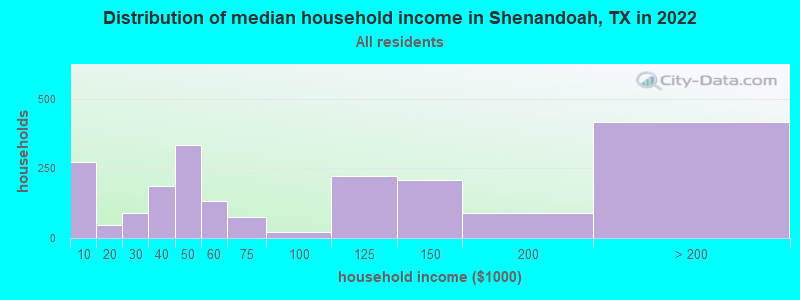
Shenandoah, TX household income distribution

- 273Less than $10,000
- 47$10,000 to $19,999
- 91$20,000 to $29,999
- 188$30,000 to $39,999
- 333$40,000 to $49,999
- 133$50,000 to $59,999
- 74$60,000 to $74,999
- 23$75,000 to $99,999
- 223$100,000 to $124,999
- 209$125,000 to $149,999
- 90$150,000 to $199,999
- 417$200,000 or more
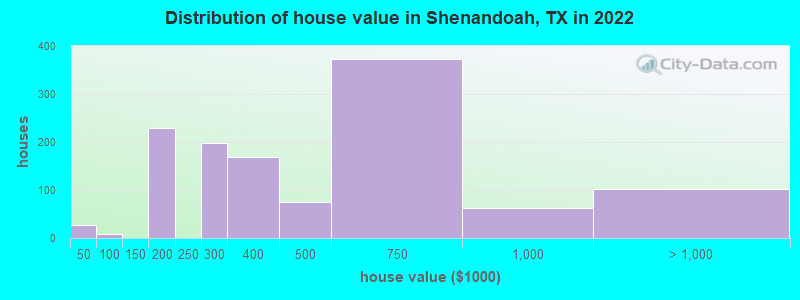
Home value of owner - occupied houses in 2022 in Shenandoah, TX
-
- 27Less than $10,000
- 8$50,000 to $59,999
- 69$150,000 to $174,999
- 159$175,000 to $199,999
- 198$250,000 to $299,999
- 169$300,000 to $399,999
- 73$400,000 to $499,999
- 371$500,000 to $749,999
- 62$750,000 to $999,999
- 94$1,000,000 to $1,499,999
- 7$1,500,000 to $1,999,999
Rent paid by renters in 2022 in Shenandoah, TX
-
- 37$750 to $799
- 21$900 to $999
- 488$1,000 to $1,249
- 174$1,250 to $1,499
- 104$1,500 to $1,999
- 32$3,000 to $3,499


Percentage of workers working in this county: 66.9%
Number of people working at home: 122 (8.9% of all workers)
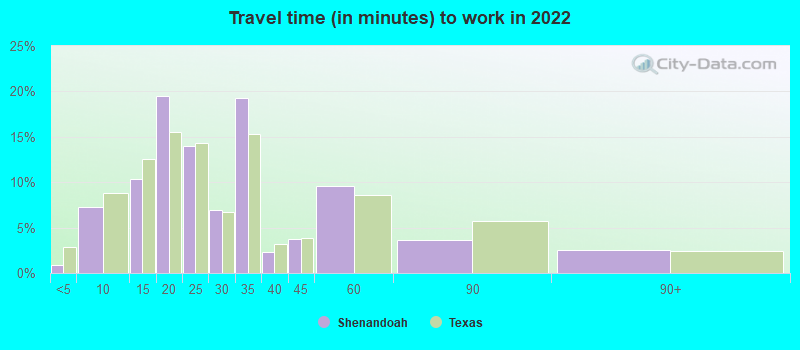
Travel time to work (commute)
- Less than 5 minutes: 0
- 5 to 9 minutes: 201
- 10 to 14 minutes: 211
- 15 to 19 minutes: 337
- 20 to 24 minutes: 118
- 25 to 29 minutes: 0
- 30 to 34 minutes: 67
- 35 to 39 minutes: 0
- 40 to 44 minutes: 0
- 45 to 59 minutes: 78
- 60 to 89 minutes: 75
- 90 or more minutes: 125
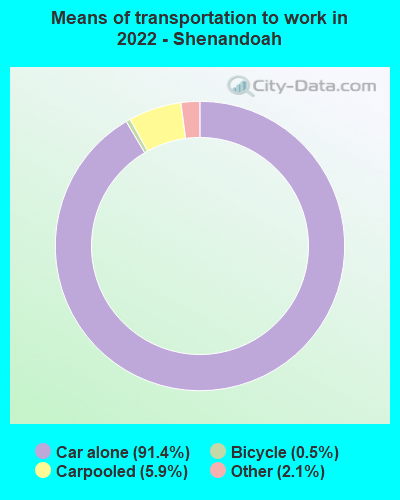
Means of transportation to work:
- Drove a car alone: 7,483 (82.1%)
- Carpooled: 545 (6.0%)
- Taxi: 235 (2.6%)
- Bicycle: 22 (0.2%)
- Walked: 3 (0.0%)
- Worked at home: 122 (1.3%)

- Unemployment by race in 2022
- Unemployment rate for White non-Hispanic residents
- 5.2%Males
- Unemployment rate for Asian residents
- 10.6%Females

- Year of entry for the foreign-born population in Shenandoah, Texas
- 1962010 or later
- 1032000 to 2009
- 01990 to 1999
- 81980 to 1989
- 121970 to 1979
- 14Before 1970

First ancestries reported:
- American: 761 (29.6%)
- German: 364 (14.2%)
- English: 162 (6.3%)
- Scotch-Irish: 139 (5.4%)
- Irish: 106 (4.1%)
- Eastern European: 65 (2.5%)
- Swedish: 61 (2.4%)
- French: 38 (1.5%)
- Slovak: 37 (1.4%)
- Polish: 29 (1.1%)
- Scottish: 25 (1.0%)
- European: 24 (0.9%)
- African: 8 (0.3%)
- British: 4 (0.2%)
Most common places of birth for foreign-born residents (%):
| Shenandoah: | 42.7% (280) |
| Texas: | 48.4% (2,411,723) |
| Shenandoah: | 17.5% (115) |
| Texas: | 1.5% (72,413) |
| Shenandoah: | 13.4% (88) |
| Texas: | 3.7% (184,770) |
| Shenandoah: | 7.9% (52) |
| Texas: | 2.3% (115,558) |
| Shenandoah: | 7.2% (47) |
| Texas: | 4.5% (224,455) |
| Shenandoah: | 5.3% (35) |
| Texas: | 2.1% (103,148) |
| Shenandoah: | 3.5% (23) |
| Texas: | 0.1% (4,334) |
| Shenandoah: | 3.5% (23) |
| Texas: | 0.5% (24,723) |
Place of birth for U.S.-born residents:
- This state: 1,540
- Other state: 1,512
- Northeast: 249
- Midwest: 607
- South: 414
- West: 225
83.5% of Shenandoah residents lived in the same house 1 years ago.
Out of people who lived in different houses, 21.8% lived in this county.
Out of people who lived in different counties, 100.0% lived in Texas.
| Shenandoah: | 83.5% |
| State average: | 85.7% |
Education attainment for males 25 years and older:
- No schooling: 34
- Nursery to 4th grade: 0
- 5th and 6th grade: 0
- 7th and 8th grade: 0
- 9th grade: 0
- 10th grade: 0
- 11th grade: 0
- 12th grade, no diploma: 0
- High school graduate (or equivalency): 236
- Less than 1 year of college: 115
- Some college more than 1 year, no degree: 295
- Associate degree: 43
- Bachelor's degree: 391
- Master's degree: 331
- Professional school degree: 60
- Doctorate degree: 81

Education attainment for females 25 years and older:
- No schooling: 0
- Nursery to 4th grade: 0
- 5th and 6th grade: 0
- 7th and 8th grade: 0
- 9th grade: 81
- 10th grade: 0
- 11th grade: 24
- 12th grade, no diploma: 38
- High school graduate (or equivalency): 329
- Less than 1 year of college: 98
- Some college more than 1 year, no degree: 313
- Associate degree: 175
- Bachelor's degree: 504
- Master's degree: 211
- Professional school degree: 6
- Doctorate degree: 110


Housing units in structures:
- One, detached: 1,203
- One, attached: 20
- 3 or 4: 63
- 5 to 9: 104
- 10 to 19: 238
- 20 to 49: 51
- 50 or more: 401
House/condo owner moved in on average 10 years ago
Renter moved in on average 4 years ago

Private vs. public school enrollment:
| Here: | 47.1% |
| Texas: | 8.8% |
| Here: | 0.0% |
| Texas: | 8.0% |
| Here: | 0.0% |
| Texas: | 16.2% |


