Shiloh, OH (Ohio) Houses and Residents
| Shiloh: | $124,354 |
| Ohio: | $204,100 |
Total population: 10,859 (All urban)
Houses: 6,141 (5,514 occupied: 2,539 owner occupied, 3,139 renter occupied)
| % of renters here: | 55% |
| State: | 33% |
Housing density: 1,600 houses/condos per square mile
Median price asked for vacant for-sale houses and condos in 2022: $115,008.
Median contract rent in 2022: $724 (lower quartile is $588, upper quartile is $805)
Median rent asked for vacant for-rent units in 2022: $631
Median gross rent in Shiloh, OH in 2022: $813
Housing units in Shiloh with a mortgage: 1,399 (113 second mortgage, 0 home equity loan, 115 both second mortgage and home equity loan)
Houses without a mortgage: 16
Median household income for houses/condos with a mortgage: $72,566
Median household income for apartments without a mortgage: $46,525
Median monthly housing costs: $826
Compare current foreclosures near Shiloh, OH:
| Photo | Address | Area | Beds / Baths | Price | Details |
|---|---|---|---|---|---|

|
#1
Guthrie Rd
Shiloh, OH 44878
|
1,368 sq. feet
|
1 baths 3 beds |
show details | |

|
#2
Rome South Rd
Shiloh, OH 44878
|
- sq. feet
|
- baths - beds |
show details | |

|
#3
Springmill St
Mansfield, OH 44903
|
- sq. feet
|
- baths - beds |
$19,900
|
show details |

|
#4
Unity Dr
Mansfield, OH 44905
|
960 sq. feet
|
1 baths 3 beds |
show details | |

|
#5
Fairlawn Ave
Mansfield, OH 44903
|
1,553 sq. feet
|
2 baths 3 beds |
show details | |

|
#6
Fairlawn Ave
Mansfield, OH 44903
|
1,238 sq. feet
|
1 baths 3 beds |
show details | |

|
#7
Charvid Ave
Mansfield, OH 44905
|
1,988 sq. feet
|
1 baths 2 beds |
show details | |

|
#8
Laver Rd
Mansfield, OH 44905
|
1,040 sq. feet
|
1 baths 3 beds |
show details | |

|
#9
Woodland Park Dr
Mansfield, OH 44903
|
3,390 sq. feet
|
3 baths 4 beds |
show details | |

|
#10
Evergreen Ave W
Mansfield, OH 44905
|
1,776 sq. feet
|
1 baths 3 beds |
show details |
| Photo | Address | Area | Beds / Baths | Price | Details |
|---|---|---|---|---|---|

|
#11
Lind Ave
Mansfield, OH 44903
|
1,552 sq. feet
|
1 baths 4 beds |
show details | |

|
#12
Circle Dr W
Mansfield, OH 44905
|
1,516 sq. feet
|
1 baths 2 beds |
show details | |

|
#13
W Bucyrus St
Crestline, OH 44827
|
2,108 sq. feet
|
2 baths 5 beds |
show details | |

|
#14
E 2nd St
Mansfield, OH 44902
|
1,312 sq. feet
|
1 baths 3 beds |
show details | |

|
#15
State Route 181
Crestline, OH 44827
|
1,620 sq. feet
|
2 baths 3 beds |
show details | |

|
#16
Paradise View St
Mansfield, OH 44905
|
1,354 sq. feet
|
1 baths 3 beds |
show details | |

|
#17
Silver Ln
Mansfield, OH 44906
|
1,196 sq. feet
|
1 baths 3 beds |
show details | |

|
#18
Manner Dr
Mansfield, OH 44905
|
1,114 sq. feet
|
1 baths 3 beds |
show details | |

|
#19
N Columbus St
Crestline, OH 44827
|
1,440 sq. feet
|
1 baths 2 beds |
show details | |

|
#20
E Thrush Ave
Crestline, OH 44827
|
1,472 sq. feet
|
1 baths 4 beds |
show details |
| Photo | Address | Area | Beds / Baths | Price | Details |
|---|---|---|---|---|---|

|
#21
Dianewood Dr
Mansfield, OH 44903
|
2,108 sq. feet
|
2 baths 3 beds |
show details | |

|
#22
W Arch St
Mansfield, OH 44902
|
1,658 sq. feet
|
1 baths 3 beds |
show details | |

|
#23
Winthrop Ln
Ashland, OH 44805
|
960 sq. feet
|
1 baths 3 beds |
show details | |

|
#24
Township Road 1253
Ashland, OH 44805
|
1,452 sq. feet
|
1 baths 3 beds |
show details | |

|
#25
Pleasant St
Ashland, OH 44805
|
1,178 sq. feet
|
1 baths 3 beds |
show details | |

|
#26
Samaritan Ave
Ashland, OH 44805
|
1,566 sq. feet
|
1 baths 3 beds |
show details | |

|
#27
Trout Dr
Mansfield, OH 44903
|
1,056 sq. feet
|
2 baths 1 beds |
show details | |

|
#28
W Cook Rd
Mansfield, OH 44907
|
1,421 sq. feet
|
1 baths 3 beds |
show details | |

|
#29
Hillside Cir
Mansfield, OH 44907
|
1,176 sq. feet
|
1 baths 3 beds |
show details | |

|
#30
W Walnut St
Ashland, OH 44805
|
2,110 sq. feet
|
2 baths 2 beds |
show details |
| Photo | Address | Area | Beds / Baths | Price | Details |
|---|---|---|---|---|---|

|
#31
Topaz Ave
Mansfield, OH 44907
|
1,380 sq. feet
|
1 baths 3 beds |
show details | |

|
#32
Keen Ave
Ashland, OH 44805
|
1,129 sq. feet
|
1 baths 3 beds |
show details | |

|
#33
Avalon Dr
Ashland, OH 44805
|
1,177 sq. feet
|
2 baths 2 beds |
show details | |

|
#34
E 12th St
Ashland, OH 44805
|
1,008 sq. feet
|
1 baths 3 beds |
show details | |

|
#35
Ruth Ave
Mansfield, OH 44907
|
1,280 sq. feet
|
1 baths 3 beds |
show details | |

|
#36
Manchester Rd
Mansfield, OH 44903
|
2,458 sq. feet
|
2 baths 4 beds |
show details | |

|
#37
Ford St
Mansfield, OH 44902
|
1,900 sq. feet
|
1 baths 5 beds |
show details | |

|
#38
Dorchester St
Ashland, OH 44805
|
1,156 sq. feet
|
1 baths 3 beds |
show details | |

|
#39
Abbeyfeale Rd
Mansfield, OH 44907
|
1,092 sq. feet
|
1 baths 3 beds |
show details | |

|
#40
Zachary Way
Mansfield, OH 44903
|
2,891 sq. feet
|
2 baths 3 beds |
show details |
| Photo | Address | Area | Beds / Baths | Price | Details |
|---|---|---|---|---|---|

|
#41
Greenwood Ave
Mansfield, OH 44907
|
1,356 sq. feet
|
1 baths 3 beds |
show details | |

|
#42
Marion Ave
Mansfield, OH 44906
|
14,077 sq. feet
|
5 baths 8 beds |
show details | |

|
#43
Vernon Rd
Mansfield, OH 44905
|
1,127 sq. feet
|
1 baths 2 beds |
show details | |

|
#44
Locustgrove Rd
Sulphur Springs, OH 44881
|
- sq. feet
|
2 baths 3 beds |
show details | |

|
#45
Ohio St
Ashland, OH 44805
|
1,499 sq. feet
|
1 baths 3 beds |
show details | |

|
#46
Neil Cir N
Mansfield, OH 44903
|
1,386 sq. feet
|
2 baths 3 beds |
show details | |

|
#47
E Walnut St
Ashland, OH 44805
|
1,308 sq. feet
|
1 baths 2 beds |
show details | |

|
#48
Egypt Rd
Willard, OH 44890
|
1,144 sq. feet
|
1 baths 3 beds |
show details | |

|
#49
County Road 575
Nova, OH 44859
|
1,326 sq. feet
|
1 baths 4 beds |
show details | |

|
Check over 1 million property listings on Foreclosure.com!
|
browse all offers | |||

Latest news about housing in Shiloh, OH collected exclusively by city-data.com from local newspapers, TV, and radio stations


Median year apartment built: 1964
Household type by relationship:
Households: 10,495- Male householders: 2,717 (1,483 living alone), Female householders: 2,758 (1,246 living alone)
915 spouses (868 opposite-sex spouses), 486 unmarried partners, (464 opposite-sex unmarried partners), 2,361 children (2,198 natural, 45 adopted, 116 stepchildren), 289 grandchildren, 71 brothers or sisters, 68 parents, 0 foster children, 232 other relatives, 166 non-relatives
- In group quarters: 427
Size of family households: 1,308 2-persons, 733 3-persons, 354 4-persons, 116 5-persons, 34 6-persons.
Size of nonfamily households: 2,861 1-person, 231 2-persons, 24 3-persons, 7 4-persons.
373 married couples with children.
1,117 single-parent households (110 men, 1,007 women).
96.1% of residents of Shiloh speak English at home.
1.2% of residents speak Spanish at home (78% speak English very well, 9% speak English well, 14% speak English not well).
1.4% of residents speak other Indo-European language at home (76% speak English well, 24% speak English not well).
1.5% of residents speak other language at home (40% speak English very well, 51% speak English well, 10% speak English not well).
Foreign born population: 384 (3.7%)
(43.5% of them are naturalized citizens)
| Here: | 6.6 |
| State: | 6.7 |
| Here: | 4.2 |
| State: | 4.4 |

- Bedrooms in owner-occupied houses and condos in Shiloh, Ohio
- 30no bedroom
- 391 bedroom
- 5902 bedrooms
- 1,1353 bedrooms
- 6304 bedrooms
- 1165+ bedrooms

- Bedrooms in renter-occupied apartments in Shiloh, Ohio
- 48no bedroom
- 9941 bedroom
- 1,7012 bedrooms
- 2953 bedrooms
- 1024 bedrooms
- 05+ bedrooms

- Cars and other vehicles available in Shiloh in owner-occupied houses/condos
- 111no vehicle
- 9561 vehicle
- 9622 vehicles
- 3243 vehicles
- 1624 vehicles
- 255+ vehicles

- Cars and other vehicles available in Shiloh in renter-occupied apartments
- 830no vehicle
- 1,6711 vehicle
- 3532 vehicles
- 2853 vehicles
- 04 vehicles
- 05+ vehicles

- Rooms in owner-occupied houses in Shiloh, Ohio
- 301 room
- 02 rooms
- 573 rooms
- 1774 rooms
- 4715 rooms
- 5186 rooms
- 6257 rooms
- 3348 rooms
- 3289+ rooms

- Rooms in renter-occupied apartments in Shiloh, Ohio
- 481 room
- 292 rooms
- 6353 rooms
- 1,4614 rooms
- 5095 rooms
- 2736 rooms
- 1397 rooms
- 458 rooms
- 09+ rooms


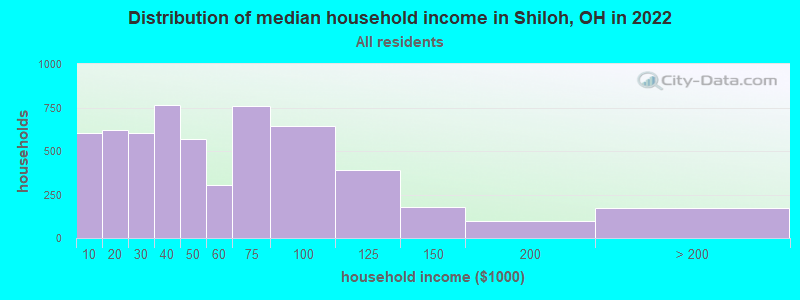
Shiloh, OH household income distribution

- 606Less than $10,000
- 618$10,000 to $19,999
- 603$20,000 to $29,999
- 765$30,000 to $39,999
- 571$40,000 to $49,999
- 305$50,000 to $59,999
- 761$60,000 to $74,999
- 643$75,000 to $99,999
- 390$100,000 to $124,999
- 178$125,000 to $149,999
- 96$150,000 to $199,999
- 172$200,000 or more
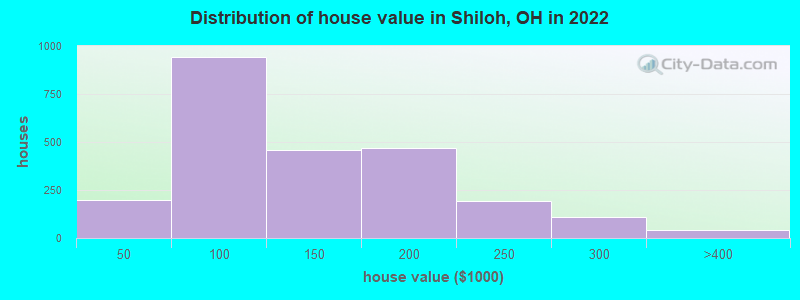
Home value of owner - occupied houses in 2022 in Shiloh, OH
-
- 35Less than $10,000
- 4$10,000 to $14,999
- 4$15,000 to $19,999
- 9$20,000 to $24,999
- 18$30,000 to $34,999
- 28$35,000 to $39,999
- 99$40,000 to $49,999
- 146$50,000 to $59,999
- 178$60,000 to $69,999
- 200$70,000 to $79,999
- 259$80,000 to $89,999
- 57$90,000 to $99,999
- 279$100,000 to $124,999
- 178$125,000 to $149,999
- 314$150,000 to $174,999
- 155$175,000 to $199,999
- 194$200,000 to $249,999
- 109$250,000 to $299,999
- 42$300,000 to $399,999
Rent paid by renters in 2022 in Shiloh, OH
-
- 69$200 to $249
- 6$250 to $299
- 10$300 to $349
- 23$350 to $399
- 29$400 to $449
- 67$450 to $499
- 462$500 to $549
- 84$550 to $599
- 350$600 to $649
- 332$650 to $699
- 493$700 to $749
- 355$750 to $799
- 228$800 to $899
- 166$900 to $999
- 83$1,000 to $1,249
- 134No cash rent

Percentage of workers working in this county: 86.1%
Number of people working at home: 393 (8.0% of all workers)
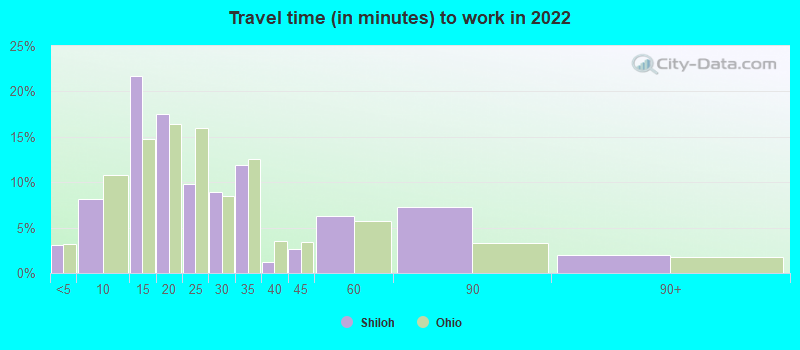
Travel time to work (commute)
- Less than 5 minutes: 102
- 5 to 9 minutes: 311
- 10 to 14 minutes: 1,068
- 15 to 19 minutes: 1,289
- 20 to 24 minutes: 541
- 25 to 29 minutes: 242
- 30 to 34 minutes: 238
- 35 to 39 minutes: 103
- 40 to 44 minutes: 57
- 45 to 59 minutes: 236
- 60 to 89 minutes: 231
- 90 or more minutes: 26
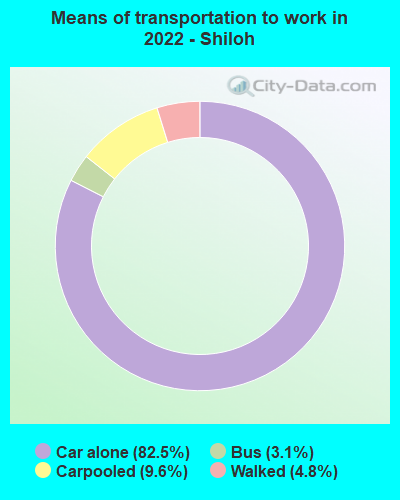
Means of transportation to work:
- Drove a car alone: 1,368 (68.6%)
- Carpooled: 166 (8.3%)
- Bus: 30 (1.5%)
- Walked: 69 (3.5%)
- Worked at home: 393 (19.7%)
- Unemployment by race in 2022
- Unemployment rate for White non-Hispanic residents
- 1.1%Males
- 0.8%Females
- Unemployment rate for Black residents
- 5.8%Males
- 14.7%Females
- Unemployment rate for two or more race residents
- 18.5%Females

- Year of entry for the foreign-born population in Shiloh, Ohio
- 1832010 or later
- 862000 to 2009
- 521990 to 1999
- 761980 to 1989
- 801970 to 1979
- 151Before 1970

First ancestries reported:
- English: 323 (5.4%)
- German: 318 (5.3%)
- African: 308 (5.1%)
- American: 225 (3.7%)
- Irish: 97 (1.6%)
- French: 57 (0.9%)
- Italian: 47 (0.8%)
- Slavic: 32 (0.5%)
- Swedish: 29 (0.5%)
- Haitian: 21 (0.3%)
- European: 20 (0.3%)
- Hungarian: 18 (0.3%)
- Israeli: 15 (0.2%)
- Eastern European: 14 (0.2%)
- Russian: 14 (0.2%)
- Scottish: 14 (0.2%)
- British: 12 (0.2%)
- Trinidadian and Tobagonian: 12 (0.2%)
- Welsh: 9 (0.1%)
- Northern European: 8 (0.1%)
- Scotch-Irish: 8 (0.1%)
- Serbian: 8 (0.1%)
- Norwegian: 7 (0.1%)
- Greek: 6 (0.10%)
- Scandinavian: 6 (0.10%)
- Dutch: 4 (0.07%)
- Lithuanian: 3 (0.05%)
Most common places of birth for foreign-born residents (%):
| Shiloh: | 28.7% (116) |
| Ohio: | 0.5% (3,061) |
| Shiloh: | 20.8% (84) |
| Ohio: | 1.2% (7,029) |
| Shiloh: | 16.3% (66) |
| Ohio: | 0.8% (4,549) |
| Shiloh: | 12.4% (50) |
| Ohio: | 1.1% (6,096) |
| Shiloh: | 4.5% (18) |
| Ohio: | 0.2% (1,344) |
| Shiloh: | 4.2% (17) |
| Ohio: | 7.8% (44,796) |
| Shiloh: | 4.0% (16) |
| Ohio: | 0.5% (2,631) |
| Shiloh: | 2.2% (9) |
| Ohio: | 2.2% (12,846) |
Place of birth for U.S.-born residents:
- This state: 7,643
- Other state: 2,377
- Northeast: 309
- Midwest: 558
- South: 1,313
- West: 132
79.1% of Shiloh residents lived in the same house 1 years ago.
Out of people who lived in different houses, 42.1% lived in this county.
Out of people who lived in different counties, 56.0% lived in Ohio.
| Shiloh: | 79.1% |
| State average: | 87.8% |
Education attainment for males 25 years and older:
- No schooling: 72
- Nursery to 4th grade: 0
- 5th and 6th grade: 0
- 7th and 8th grade: 15
- 9th grade: 14
- 10th grade: 8
- 11th grade: 6
- 12th grade, no diploma: 25
- High school graduate (or equivalency): 1,141
- Less than 1 year of college: 464
- Some college more than 1 year, no degree: 651
- Associate degree: 244
- Bachelor's degree: 686
- Master's degree: 242
- Professional school degree: 36
- Doctorate degree: 13

Education attainment for females 25 years and older:
- No schooling: 0
- Nursery to 4th grade: 0
- 5th and 6th grade: 0
- 7th and 8th grade: 6
- 9th grade: 15
- 10th grade: 34
- 11th grade: 99
- 12th grade, no diploma: 40
- High school graduate (or equivalency): 1,048
- Less than 1 year of college: 472
- Some college more than 1 year, no degree: 569
- Associate degree: 546
- Bachelor's degree: 753
- Master's degree: 379
- Professional school degree: 16
- Doctorate degree: 15


Housing units in structures:
- One, detached: 2,968
- One, attached: 190
- Two: 15
- 3 or 4: 900
- 5 to 9: 868
- 10 to 19: 359
- 20 to 49: 219
- 50 or more: 537
- Mobile homes: 82
Housing units lacking complete kitchen facilities in 2022: 2.2%
House/condo owner moved in on average 12 years ago
Renter moved in on average 2 years ago

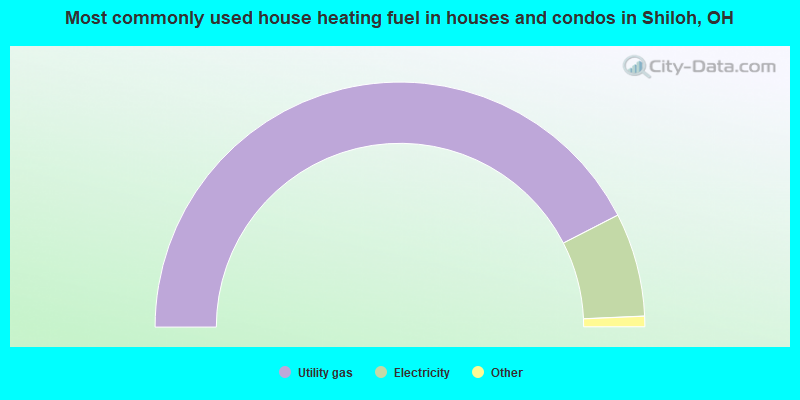
- 84.9%Utility gas
- 13.7%Electricity
- 0.9%Bottled, tank, or LP gas
- 0.5%No fuel used
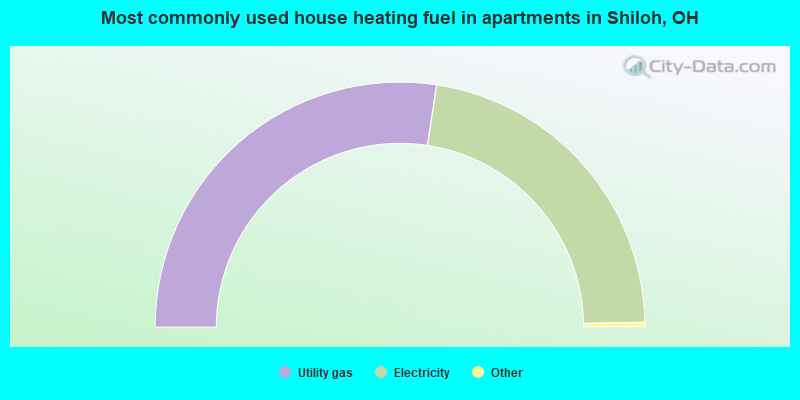
- 54.8%Utility gas
- 44.6%Electricity
- 0.4%Bottled, tank, or LP gas
- 0.2%No fuel used
Private vs. public school enrollment:
| Here: | 14.8% |
| Ohio: | 16.0% |
| Here: | 25.5% |
| Ohio: | 13.1% |
| Here: | 14.2% |
| Ohio: | 22.3% |


