Shirley, MA (Massachusetts) Houses and Residents
| Shirley: | $356,222 |
| Massachusetts: | $534,700 |
Total population: 1,441 (Urban population: 1,317, Rural population: 144 (all nonfarm))
Houses: 710 (710 occupied: 408 owner occupied, 300 renter occupied)
| % of renters here: | 42% |
| State: | 38% |
Housing density: 527 houses/condos per square mile
Median price asked for vacant for-sale houses and condos in 2022 in this county: $1,068,910.
Median contract rent in 2022: $848 (lower quartile is $527, upper quartile is $964)
Median rent asked for vacant for-rent units in 2022: $901
Median gross rent in Shirley, MA in 2022: $923
Housing units in Shirley with a mortgage: 256 (32 second mortgage, 0 home equity loan, 32 both second mortgage and home equity loan)
Houses without a mortgage: 19
Median household income for houses/condos with a mortgage: $121,643
Median monthly housing costs: $931
Compare current foreclosures near Shirley, MA:
| Photo | Address | Area | Beds / Baths | Price | Details |
|---|---|---|---|---|---|

|
#1
Great Rd
Shirley, MA 01464
|
1,672 sq. feet
|
1 baths 2 beds |
$464,900
|
show details |

|
#2
Lancaster Rd
Shirley, MA 01464
|
1,704 sq. feet
|
1 baths 4 beds |
show details | |

|
#3
Ayer Rd
Shirley, MA 01464
|
1,134 sq. feet
|
1 baths 2 beds |
show details | |

|
#4
Graham St
Leominster, MA 01453
|
1,036 sq. feet
|
1 baths 3 beds |
$485,000
|
show details |

|
#5
Pearl Hill Rd
Fitchburg, MA 01420
|
2,152 sq. feet
|
2 baths 3 beds |
$529,900
|
show details |

|
#6
Sylvan Ave
Leominster, MA 01453
|
720 sq. feet
|
1 baths 2 beds |
$375,000
|
show details |

|
#7
Marks Way
Maynard, MA 01754
|
2,596 sq. feet
|
2 baths 4 beds |
show details | |

|
#8
Sugar Rd
Bolton, MA 01740
|
1,988 sq. feet
|
2 baths 3 beds |
show details | |

|
#9
Boston Rd
Chelmsford, MA 01824
|
1,392 sq. feet
|
1 baths 3 beds |
show details | |

|
#10
Garnet St
Fitchburg, MA 01420
|
6,112 sq. feet
|
5 baths 8 beds |
show details |
| Photo | Address | Area | Beds / Baths | Price | Details |
|---|---|---|---|---|---|

|
#11
Grove Ave
Leominster, MA 01453
|
3,097 sq. feet
|
1 baths 4 beds |
show details | |

|
#12
Old Bolton Rd
Hudson, MA 01749
|
1,244 sq. feet
|
1 baths 3 beds |
show details | |

|
#13
Deer Path Apt 5
Maynard, MA 01754
|
1,540 sq. feet
|
1 baths 2 beds |
show details | |

|
#14
Hemlock Dr
Lunenburg, MA 01462
|
696 sq. feet
|
1 baths 2 beds |
show details | |

|
#15
3rd Ave
North Chelmsford, MA 01863
|
- sq. feet
|
1 baths 2 beds |
show details | |

|
#16
West Rd
Ashby, MA 01431
|
7,000 sq. feet
|
3 baths 10 beds |
show details | |

|
#17
Great Rd
Stow, MA 01775
|
2,026 sq. feet
|
2 baths 3 beds |
show details | |

|
#18
Great Rd Apt 14
Acton, MA 01720
|
818 sq. feet
|
1 baths 1 beds |
show details | |

|
#19
Brigham St Unit 1a
Hudson, MA 01749
|
1,140 sq. feet
|
2 baths 2 beds |
show details | |

|
#20
Main St
Dunstable, MA 01827
|
2,452 sq. feet
|
2 baths 3 beds |
show details |
| Photo | Address | Area | Beds / Baths | Price | Details |
|---|---|---|---|---|---|

|
#21
Olde Surrey Dr
Acton, MA 01720
|
1,100 sq. feet
|
2 baths 3 beds |
show details | |

|
#22
Howard Rd
Maynard, MA 01754
|
2,507 sq. feet
|
2 baths 4 beds |
show details | |

|
#23
Turnpike Rd
Ashby, MA 01431
|
960 sq. feet
|
1 baths 2 beds |
show details | |

|
#24
Alberta Dr
Hudson, MA 01749
|
2,845 sq. feet
|
2 baths 3 beds |
show details | |

|
#25
North St
Acton, MA 01720
|
1,740 sq. feet
|
2 baths 3 beds |
show details | |

|
#26
Alcott St
Acton, MA 01720
|
1,774 sq. feet
|
2 baths 3 beds |
show details | |

|
#27
Elm Rd
Westford, MA 01886
|
1,712 sq. feet
|
2 baths 1 beds |
show details | |

|
#28
High St
Dunstable, MA 01827
|
2,416 sq. feet
|
2 baths 4 beds |
show details | |

|
#29
Moore Ln
Northborough, MA 01532
|
3,652 sq. feet
|
3 baths 4 beds |
show details | |

|
#30
Fairfield St
Maynard, MA 01754
|
2,384 sq. feet
|
3 baths 4 beds |
show details |
| Photo | Address | Area | Beds / Baths | Price | Details |
|---|---|---|---|---|---|

|
#31
Coal Kiln Rd
Princeton, MA 01541
|
1,588 sq. feet
|
2 baths 3 beds |
show details | |

|
#32
Bruce Rd
Marlborough, MA 01752
|
864 sq. feet
|
1 baths 2 beds |
show details | |

|
#33
Berlin Rd
Marlborough, MA 01752
|
1,603 sq. feet
|
2 baths 3 beds |
show details | |

|
#34
Karopulios Dr
Marlborough, MA 01752
|
1,540 sq. feet
|
2 baths 2 beds |
show details | |

|
#35
Worcester Rd
Princeton, MA 01541
|
2,093 sq. feet
|
2 baths 4 beds |
show details | |

|
#36
Pleasant St
Marlborough, MA 01752
|
1,372 sq. feet
|
1 baths 3 beds |
show details | |

|
#37
Carter Rd
Westminster, MA 01473
|
2,182 sq. feet
|
1 baths 3 beds |
show details | |

|
#38
Cannongate Rd Apt 42
Tyngsboro, MA 01879
|
1,436 sq. feet
|
1 baths 2 beds |
show details | |

|
#39
Main St
North Chelmsford, MA 01863
|
1,040 sq. feet
|
1 baths 3 beds |
show details | |

|
#40
Main St
Hudson, MA 01749
|
1,074 sq. feet
|
2 baths 3 beds |
show details |
| Photo | Address | Area | Beds / Baths | Price | Details |
|---|---|---|---|---|---|

|
#41
Maple St
Acton, MA 01720
|
1,760 sq. feet
|
2 baths 3 beds |
show details | |

|
#42
Gatehouse Rd
Westminster, MA 01473
|
1,118 sq. feet
|
1 baths 2 beds |
show details | |

|
#43
Manning St Apt 27c
Hudson, MA 01749
|
957 sq. feet
|
1 baths 2 beds |
show details | |

|
#44
Ashburnham St
Fitchburg, MA 01420
|
2,095 sq. feet
|
1 baths 3 beds |
show details | |

|
#45
Haskell Rd
Pepperell, MA 01463
|
1,440 sq. feet
|
1 baths 3 beds |
show details | |

|
#46
Algonquin Rd
Acton, MA 01720
|
2,068 sq. feet
|
1 baths 4 beds |
show details | |

|
#47
Laurelwood Dr
Ashby, MA 01431
|
5,235 sq. feet
|
4 baths 4 beds |
show details | |

|
#48
Central St # 1c
Acton, MA 01720
|
891 sq. feet
|
1 baths 2 beds |
show details | |

|
#49
Central 1c
Acton, MA 01720
|
891 sq. feet
|
1 baths 2 beds |
show details | |

|
Check over 1 million property listings on Foreclosure.com!
|
browse all offers | |||

Latest news about housing in Shirley, MA collected exclusively by city-data.com from local newspapers, TV, and radio stations

 | How Much Massachusetts Households Make Per Year: Census Data (37 replies) |
| 2023 Real Estate Observations (5278 replies) |
| 2021 Real Estate Observations (1729 replies) |
| Under $250k any Massachusetts single family house with yard (117 replies) |
| Governor will close MCI Concord in Summer 2024 (196 replies) |
| towns that offer the most jobs per dollar of house (58 replies) |

Median year apartment built: 1939
Household type by relationship:
Households: 1,353- Male householders: 372 (140 living alone), Female householders: 324 (191 living alone)
351 spouses (351 opposite-sex spouses), 0 unmarried partners, (0 opposite-sex unmarried partners), 252 children (252 natural, 0 adopted, 0 stepchildren), 0 grandchildren, 0 brothers or sisters, 0 parents, 0 foster children, 0 other relatives, 52 non-relatives
Size of family households: 176 2-persons, 106 3-persons, 28 4-persons, 24 5-persons.
Size of nonfamily households: 345 1-person, 20 3-persons.
171 married couples with children.
0 single-parent households (0 men, 0 women).
90.3% of residents of Shirley speak English at home.
5.0% of residents speak Spanish at home (100% speak English very well).
3.1% of residents speak other Indo-European language at home (100% speak English very well).
Foreign born population: 136 (10.1%)
(35.3% of them are naturalized citizens)
| Here: | 7.2 |
| State: | 6.5 |
| Here: | 2.0 |
| State: | 4.0 |

- Bedrooms in owner-occupied houses and condos in Shirley, Massachusetts
- 0no bedroom
- 131 bedroom
- 582 bedrooms
- 1803 bedrooms
- 1574 bedrooms
- 05+ bedrooms

- Bedrooms in renter-occupied apartments in Shirley, Massachusetts
- 103no bedroom
- 1551 bedroom
- 432 bedrooms
- 03 bedrooms
- 04 bedrooms
- 05+ bedrooms

- Cars and other vehicles available in Shirley in owner-occupied houses/condos
- 0no vehicle
- 401 vehicle
- 2452 vehicles
- 943 vehicles
- 154 vehicles
- 145+ vehicles

- Cars and other vehicles available in Shirley in renter-occupied apartments
- 37no vehicle
- 2211 vehicle
- 432 vehicles
- 03 vehicles
- 04 vehicles
- 05+ vehicles

- Rooms in owner-occupied houses in Shirley, Massachusetts
- 01 room
- 02 rooms
- 03 rooms
- 224 rooms
- 175 rooms
- 646 rooms
- 1487 rooms
- 718 rooms
- 869+ rooms

- Rooms in renter-occupied apartments in Shirley, Massachusetts
- 1031 room
- 892 rooms
- 203 rooms
- 464 rooms
- 05 rooms
- 436 rooms
- 07 rooms
- 08 rooms
- 09+ rooms


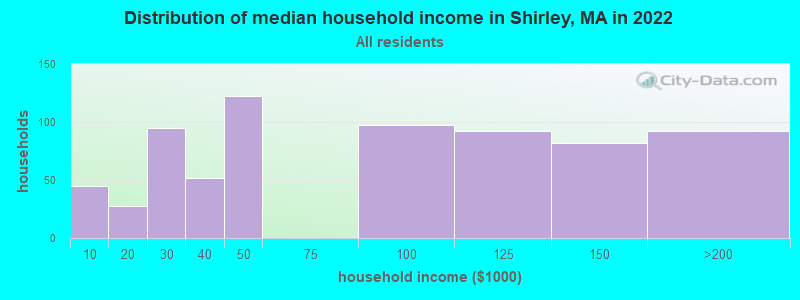
Shirley, MA household income distribution

- 45Less than $10,000
- 28$10,000 to $19,999
- 95$20,000 to $29,999
- 52$30,000 to $39,999
- 122$40,000 to $49,999
- 97$75,000 to $99,999
- 92$100,000 to $124,999
- 82$125,000 to $149,999
- 92$150,000 to $199,999
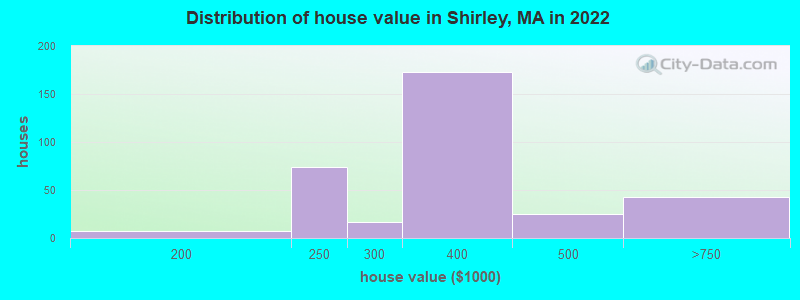
Home value of owner - occupied houses in 2022 in Shirley, MA
-
- 7$150,000 to $174,999
- 74$200,000 to $249,999
- 17$250,000 to $299,999
- 172$300,000 to $399,999
- 24$400,000 to $499,999
- 43$500,000 to $749,999
Rent paid by renters in 2022 in Shirley, MA
-
- 30$200 to $249
- 16$450 to $499
- 89$500 to $549
- 77$800 to $899
- 44$900 to $999
- 43$1,000 to $1,249
- 19$1,500 to $1,999


Percentage of workers working in this county: 78.6%
Number of people working at home: 141 (17.2% of all workers)
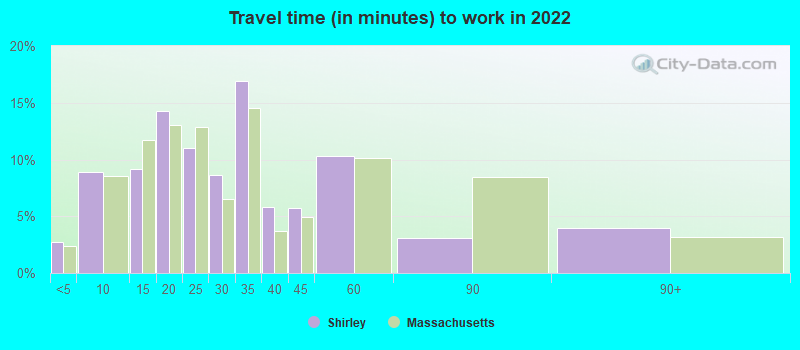
Travel time to work (commute)
- Less than 5 minutes: 28
- 5 to 9 minutes: 86
- 10 to 14 minutes: 81
- 15 to 19 minutes: 53
- 20 to 24 minutes: 95
- 25 to 29 minutes: 12
- 30 to 34 minutes: 157
- 35 to 39 minutes: 56
- 40 to 44 minutes: 0
- 45 to 59 minutes: 22
- 60 to 89 minutes: 40
- 90 or more minutes: 26
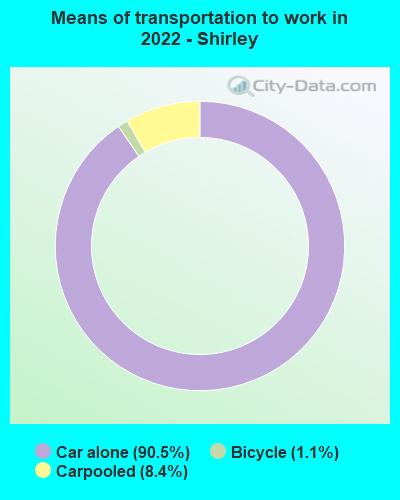
Means of transportation to work:
- Drove a car alone: 1,550 (79.5%)
- Carpooled: 149 (7.6%)
- Bicycle: 24 (1.2%)
- Worked at home: 141 (7.2%)

- Unemployment by race in 2022
- Unemployment rate for Black residents
- 100.0%Males
- Unemployment rate for Hispanic or Latino residents
- 100.0%Males

- Year of entry for the foreign-born population in Shirley, Massachusetts
- 682010 or later
- 02000 to 2009
- 01990 to 1999
- 71980 to 1989
- 01970 to 1979
- 21Before 1970

First ancestries reported:
- American: 136 (26.2%)
- French Canadian: 84 (16.2%)
- Irish: 74 (14.3%)
- English: 27 (5.2%)
- German: 23 (4.4%)
- Scottish: 22 (4.2%)
- Italian: 14 (2.7%)
Most common places of birth for foreign-born residents (%):
| Shirley: | 53.7% (73) |
| Massachusetts: | 2.3% (27,810) |
| Shirley: | 30.9% (42) |
| Massachusetts: | 2.3% (28,158) |
| Shirley: | 18.4% (25) |
| Massachusetts: | 1.0% (12,529) |
Place of birth for U.S.-born residents:
- This state: 974
- Other state: 230
- Northeast: 51
- Midwest: 58
- South: 51
- West: 68
85.1% of Shirley residents lived in the same house 1 years ago.
Out of people who lived in different houses, 17.7% lived in this county.
Out of people who lived in different counties, 100.0% lived in Massachusetts.
| Shirley: | 85.1% |
| State average: | 87.7% |
Education attainment for males 25 years and older:
- No schooling: 0
- Nursery to 4th grade: 0
- 5th and 6th grade: 0
- 7th and 8th grade: 0
- 9th grade: 0
- 10th grade: 0
- 11th grade: 0
- 12th grade, no diploma: 0
- High school graduate (or equivalency): 279
- Less than 1 year of college: 31
- Some college more than 1 year, no degree: 11
- Associate degree: 83
- Bachelor's degree: 186
- Master's degree: 0
- Professional school degree: 0
- Doctorate degree: 0

Education attainment for females 25 years and older:
- No schooling: 0
- Nursery to 4th grade: 0
- 5th and 6th grade: 0
- 7th and 8th grade: 0
- 9th grade: 0
- 10th grade: 0
- 11th grade: 0
- 12th grade, no diploma: 0
- High school graduate (or equivalency): 235
- Less than 1 year of college: 0
- Some college more than 1 year, no degree: 117
- Associate degree: 33
- Bachelor's degree: 47
- Master's degree: 111
- Professional school degree: 0
- Doctorate degree: 0


Housing units in structures:
- One, detached: 399
- Two: 51
- 5 to 9: 136
- 10 to 19: 121
House/condo owner moved in on average 26 years ago
Renter moved in on average 4 years ago

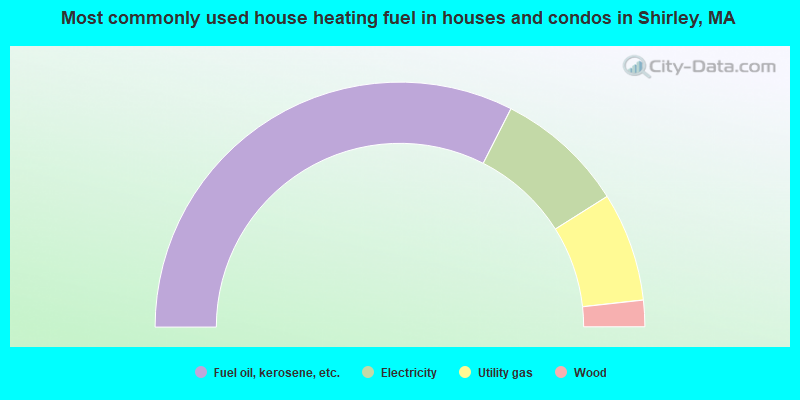
- 65.0%Fuel oil, kerosene, etc.
- 17.1%Electricity
- 14.4%Utility gas
- 3.5%Wood
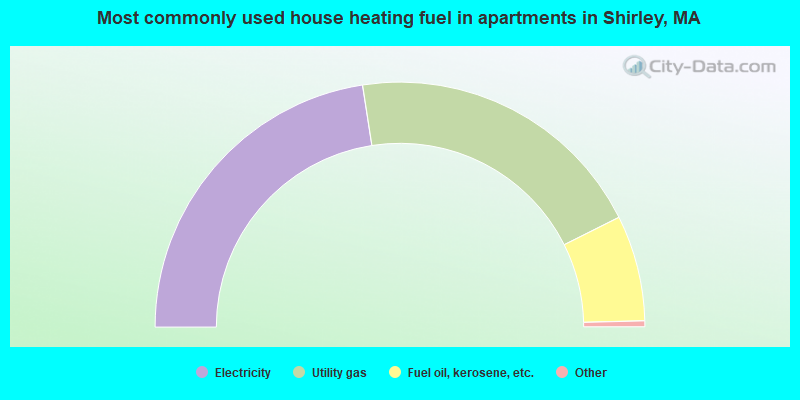
- 45.5%Electricity
- 40.4%Utility gas
- 14.1%Fuel oil, kerosene, etc.
Private vs. public school enrollment:
| Here: | 100.0% |
| Massachusetts: | 10.3% |
| Here: | 0.0% |
| Massachusetts: | 12.3% |
| Here: | 0.0% |
| Massachusetts: | 51.2% |


