Shorewood, IL (Illinois) Houses and Residents
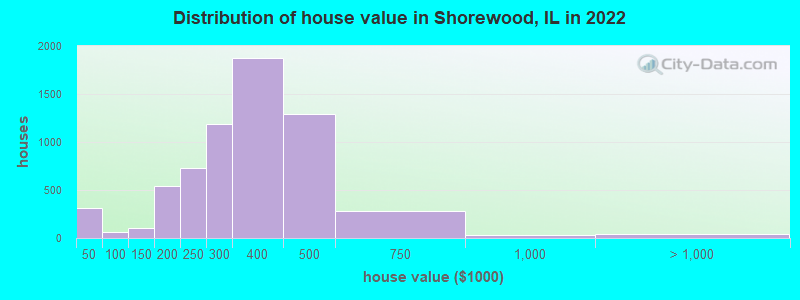
Estimated median house or condo value in 2022: $322,544 (it was $158,500 in 2000 )
Shorewood:
$322,544Illinois:
$251,600
Lower value quartile - upper value quartile: $243,450 - $414,579Mean price in 2022: Detached houses: $377,448 Here:
$377,448State:
$310,164
Townhouses or other attached units: $212,321 Here:
$212,321State:
$286,230
Mobile homes: $23,435 Here:
$23,435State:
$78,855
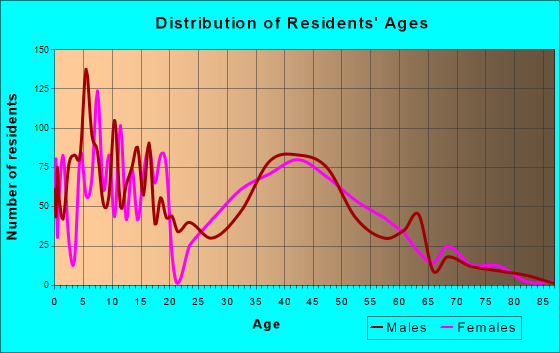
Total population: 16,569 (Urban population: 7,778, Rural population: 0)
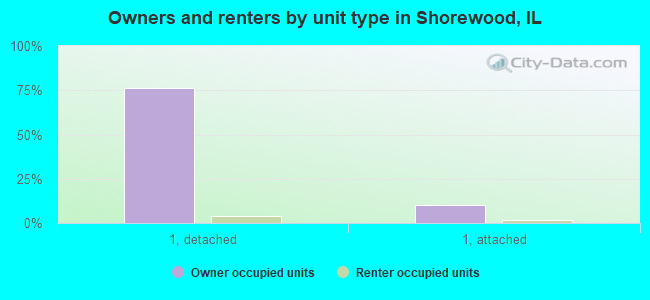
Houses: 6,797 (6,449 occupied: 6,214 owner occupied, 280 renter occupied )
% of renters here:
4%State:
33%
Housing density: 1,748 houses/condos per square mile
Median price asked for vacant for-sale houses and condos in 2022: $151,491.
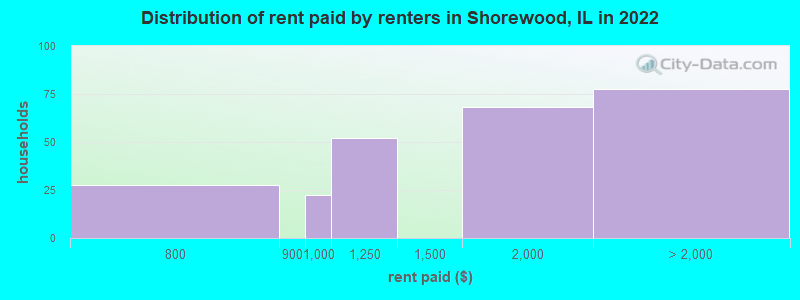
Median contract rent in 2022: $1,818 (lower quartile is $1,096, upper quartile is over $2,000)
Median rent asked for vacant for-rent units in 2022: $762
Median gross rent in Shorewood, IL in 2022: $1,984
Housing units in Shorewood with a mortgage: 3,925 (397 second mortgage, 27 home equity loan, 317 both second mortgage and home equity loan )Houses without a mortgage: 136
Median household income for houses/condos with a mortgage: $126,602
Median household income for apartments without a mortgage: $78,874
Median monthly housing costs: $1,664
Data:
Median house or condo value ($)
Median house or condo value ($ change since 2000)
Median house or condo value ($) - White
Median house or condo value ($) - Black or African American
Median house or condo value ($) - Asian
Median house or condo value ($) - Hispanic or Latino
Median house or condo value ($) - American Indian and Alaska Native
Median house or condo value ($) - Multirace
Median house or condo value ($) - Other Race
Median price asked for mobile homes ($)
Household density (households per square mile)
Mean house or condo value by units in structure - 1, detached ($)
Mean house or condo value by units in structure - 1, attached ($)
Mean house or condo value by units in structure - 2 ($)
Mean house or condo value by units in structure by units in structure - 3 or 4 ($)
Mean house or condo value by units in structure - 5 or more ($)
Mean house or condo value by units in structure - Boat, RV, van, etc. ($)
Mean house or condo value by units in structure - Mobile home ($)
Median contract rent ($)
Median contract rent - Lower quartile ($)
Median contract rent - Upper quartile ($)
Median gross rent ($)
Urban houses (%)
Rural houses (%)
Houses occupied (%)
Houses occupied (% change since 2000)
Houses owner occupied (%)
Houses owner occupied (% change since 2000)
Houses renter occupied (%)
Houses renter occupied (% change since 2000)
Vacant housing units - For rent (%)
Vacant housing units - For rent (% change since 2000)
Vacant housing units - For sale only (%)
Vacant housing units - For sale only (% change since 2000)
Vacant housing units - Rented or sold, not occupied (%)
Vacant housing units - Rented or sold, not occupied (% change since 2000)
Vacant housing units - For seasonal, recreational, or occasional use (%)
Vacant housing units - For seasonal, recreational, or occasional use (% change since 2000)
Vacant housing units - For migrant workers (%)
Vacant housing units - For migrant workers (% change since 2000)
Vacant housing units - Other vacant (%)
Vacant housing units - Other vacant (% change since 2000)
Median monthly housing costs ($)
Median household income for houses/condos with a mortgage ($)
Median household income for houses/condos without a mortgage ($)
Median household income ($)
Median household income ($) - White
Median household income ($) - Black or African American
Median household income ($) - Asian
Median household income ($) - Hispanic or Latino
Median household income ($) - American Indian and Alaska Native
Median household income ($) - Multirace
Median household income ($) - Other Race
Mortgage status - with mortgage (%)
Mortgage status - with second mortgage (%)
Mortgage status - with home equity loan (%)
Mortgage status - with both second mortgage and home equity loan (%)
Mortgage status - without a mortgage (%)
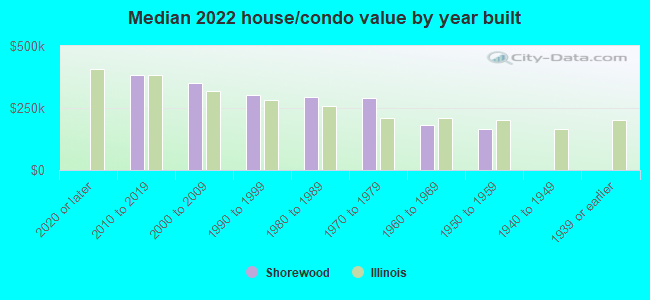
Median year house/condo built
Median year apartment built
Household type by relationship - Male householder living alone (%)
Household type by relationship - Male householder not living alone (%)
Household type by relationship - Female householder living alone (%)
Household type by relationship - Female householder not living alone (%)
Household type by relationship - Opposite-Sex spouse (%)
Household type by relationship - Same-Sex spouse (%)
Household type by relationship - Opposite-Sex unmarried partner (%)
Household type by relationship - Same-Sex unmarried partner (%)
Household type by relationship - In group quarters (%)
Size of family households - 2-person household (%)
Size of family households - 3-person household (%)
Size of family households - 4-person household (%)
Size of family households - 5-person household (%)
Size of family households - 6-person household (%)
Size of family households - 7-or-more-person household (%)
Size of nonfamily households - 1-person household (%)
Size of nonfamily households - 2-person household (%)
Size of nonfamily households - 3-person household (%)
Size of nonfamily households - 4-person household (%)
Size of nonfamily households - 5-person household (%)
Size of nonfamily households - 6-person household (%)
Size of nonfamily households - 7-or-moreperson household (%)
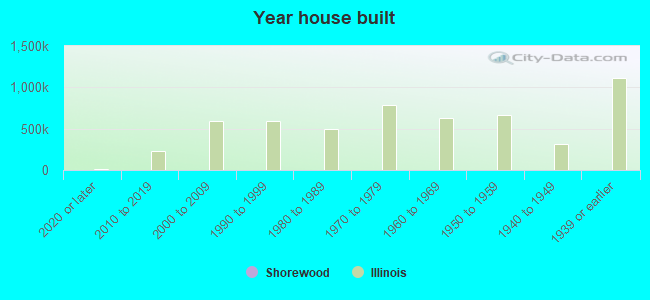
Year house built - Built 2010 or later (%)
Year house built - Built 2000 to 2009 (%)
Year house built - Built 1990 to 1999 (%)
Year house built - Built 1980 to 1989 (%)
Year house built - Built 1970 to 1979 (%)
Year house built - Built 1960 to 1969 (%)
Year house built - Built 1950 to 1959 (%)
Year house built - Built 1940 to 1949 (%)
Year house built - Built 1939 or earlier (%)
Median number of rooms in houses and condos
Median number of rooms in apartments
Median number of bedrooms in owner occupied houses
Mean number of bedrooms in owner occupied houses
Median number of bedrooms in renter occupied houses
Mean number of bedrooms in renter occupied houses
Median number of vehichles in owner occupied houses
Mean number of vehichles in owner occupied houses
Median number of vehichles in renter occupied houses
Mean number of vehichles in renter occupied houses
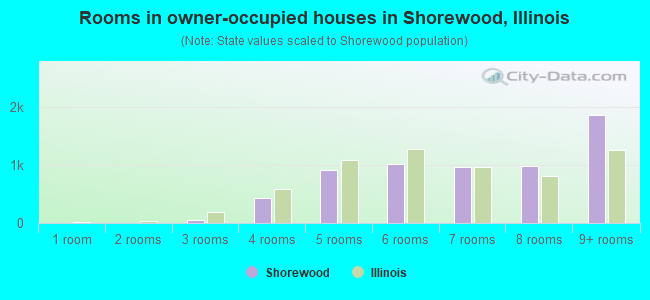
Rooms in owner-occupied houses - 1 room (%)
Rooms in owner-occupied houses - 2 rooms (%)
Rooms in owner-occupied houses - 3 rooms (%)
Rooms in owner-occupied houses - 4 rooms (%)
Rooms in owner-occupied houses - 5 rooms (%)
Rooms in owner-occupied houses - 6 rooms (%)
Rooms in owner-occupied houses - 7 rooms (%)
Rooms in owner-occupied houses - 8 rooms (%)
Rooms in owner-occupied houses - 9+ rooms (%)
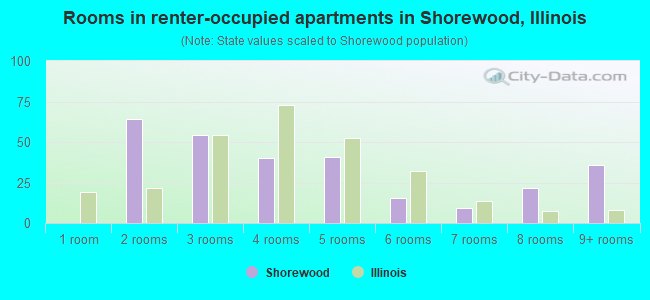
Rooms in renter-occupied houses - 1 room (%)
Rooms in renter-occupied houses - 2 rooms (%)
Rooms in renter-occupied houses - 3 rooms (%)
Rooms in renter-occupied houses - 4 rooms (%)
Rooms in renter-occupied houses - 5 rooms (%)
Rooms in renter-occupied houses - 6 rooms (%)
Rooms in renter-occupied houses - 7 rooms (%)
Rooms in renter-occupied houses - 8 rooms (%)
Rooms in renter-occupied houses - 9+ rooms (%)
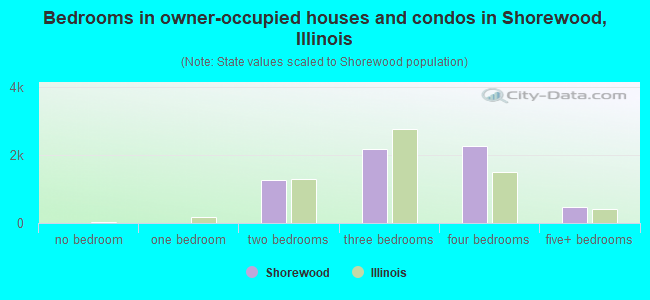
Bedrooms in owner-occupied houses - no bedrooms (%)
Bedrooms in owner-occupied houses - 1 bedroom (%)
Bedrooms in owner-occupied houses - 2 bedrooms (%)
Bedrooms in owner-occupied houses - 3 bedrooms (%)
Bedrooms in owner-occupied houses - 4 bedrooms (%)
Bedrooms in owner-occupied houses - 5+ bedrooms (%)
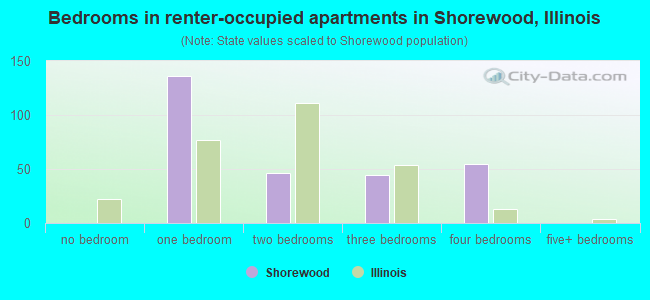
Bedrooms in renter-occupied houses - no bedrooms (%)
Bedrooms in renter-occupied houses - 1 bedroom (%)
Bedrooms in renter-occupied houses - 2 bedrooms (%)
Bedrooms in renter-occupied houses - 3 bedrooms (%)
Bedrooms in renter-occupied houses - 4 bedrooms (%)
Bedrooms in renter-occupied houses - 5+ bedrooms (%)
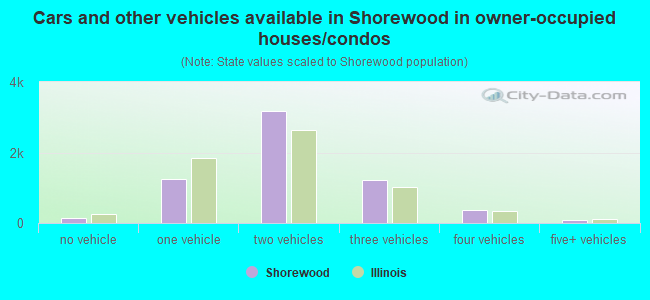
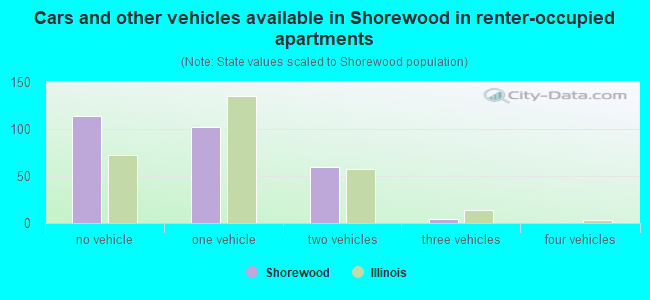
Vehicles available in owner-occupied houses - no vehicle available (%)
Vehicles available in owner-occupied houses - 1 vehicle available(%)
Vehicles available in owner-occupied houses - 2 Vehicles available (%)
Vehicles available in owner-occupied houses - 3 Vehicles available (%)
Vehicles available in owner-occupied houses - 4 Vehicles available (%)
Vehicles available in owner-occupied houses - 5+ Vehicles available (%)
Vehicles available in renter-occupied houses - no vehicle available (%)
Vehicles available in renter-occupied houses - 1 vehicle available (%)
Vehicles available in renter-occupied houses - 2 Vehicles available (%)
Vehicles available in renter-occupied houses - 3 Vehicles available (%)
Vehicles available in renter-occupied houses - 4 Vehicles available (%)
Vehicles available in renter-occupied houses - 5+ Vehicles available (%)
Housing units in structures - 1, detached (%)
Housing units in structures - 1, attached (%)
Housing units in structures - 2 (%)
Housing units in structures - 3 or 4 (%)
Housing units in structures - 5 to 9 (%)
Housing units in structures - 10 to 19 (%)
Housing units in structures - 20 to 49 (%)
Housing units in structures - 50 or more (%)
Housing units in structures - Mobile home (%)
Housing units in structures - Boat, RV, van, etc. (%)
Housing units in structures - Owners - 1, detached (%)
Housing units in structures - Owners - 1, attached (%)
Housing units in structures - Owners - 2 (%)
Housing units in structures - Owners - 3 or 4 (%)
Housing units in structures - Owners - 5 to 9 (%)
Housing units in structures - Owners - 10 to 19 (%)
Housing units in structures - Owners - 20 to 49 (%)
Housing units in structures - Owners - 50 or more (%)
Housing units in structures - Owners - Mobile home (%)
Housing units in structures - Owners - Boat, RV, van, etc. (%)
Housing units in structures - Renters - 1, detached (%)
Housing units in structures - Renters - 1, attached (%)
Housing units in structures - Renters - 2 (%)
Housing units in structures - Renters - 3 or 4 (%)
Housing units in structures - Renters - 5 to 9 (%)
Housing units in structures - Renters - 10 to 19 (%)
Housing units in structures - Renters - 20 to 49 (%)
Housing units in structures - Renters - 50 or more (%)
Housing units in structures - Renters - Mobile home (%)
Housing units in structures - Renters - Boat, RV, van, etc. (%)
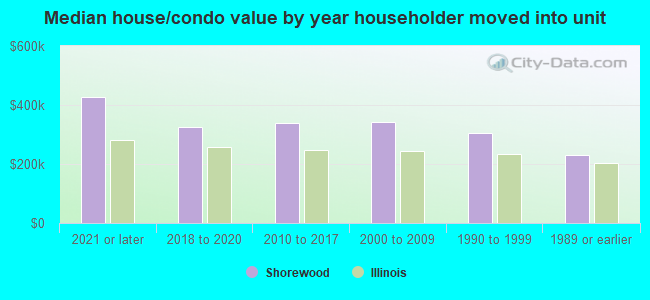
House/condo owner moved in on average (years ago)
Renter moved in on average (years ago)
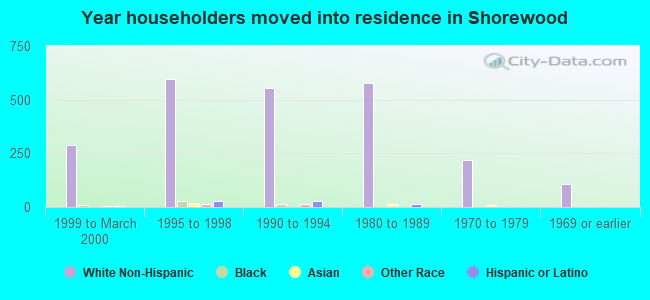
Year householder moved into unit - Moved in 1999 to March 2000 (%)
Year householder moved into unit - Moved in 1999 to March 2000 (%) - White
Year householder moved into unit - Moved in 1999 to March 2000 (%) - Black or African American
Year householder moved into unit - Moved in 1999 to March 2000 (%) - Asian
Year householder moved into unit - Moved in 1999 to March 2000 (%) - Hispanic or Latino
Year householder moved into unit - Moved in 1999 to March 2000 (%) - American Indian and Alaska Native
Year householder moved into unit - Moved in 1999 to March 2000 (%) - Multirace
Year householder moved into unit - Moved in 1999 to March 2000 (%) - Other Race
Year householder moved into unit - Moved in 1995 to 1998 (%)
Year householder moved into unit - Moved in 1995 to 1998 (%) - White
Year householder moved into unit - Moved in 1995 to 1998 (%) - Black or African American
Year householder moved into unit - Moved in 1995 to 1998 (%) - Asian
Year householder moved into unit - Moved in 1995 to 1998 (%) - Hispanic or Latino
Year householder moved into unit - Moved in 1995 to 1998 (%) - American Indian and Alaska Native
Year householder moved into unit - Moved in 1995 to 1998 (%) - Multirace
Year householder moved into unit - Moved in 1995 to 1998 (%) - Other Race
Year householder moved into unit - Moved in 1990 to 1994 (%)
Year householder moved into unit - Moved in 1990 to 1994 (%) - White
Year householder moved into unit - Moved in 1990 to 1994 (%) - Black or African American
Year householder moved into unit - Moved in 1990 to 1994 (%) - Asian
Year householder moved into unit - Moved in 1990 to 1994 (%) - Hispanic or Latino
Year householder moved into unit - Moved in 1990 to 1994 (%) - American Indian and Alaska Native
Year householder moved into unit - Moved in 1990 to 1994 (%) - Multirace
Year householder moved into unit - Moved in 1990 to 1994 (%) - Other Race
Year householder moved into unit - Moved in 1980 to 1989 (%)
Year householder moved into unit - Moved in 1980 to 1989 (%) - White
Year householder moved into unit - Moved in 1980 to 1989 (%) - Black or African American
Year householder moved into unit - Moved in 1980 to 1989 (%) - Asian
Year householder moved into unit - Moved in 1980 to 1989 (%) - Hispanic or Latino
Year householder moved into unit - Moved in 1980 to 1989 (%) - American Indian and Alaska Native
Year householder moved into unit - Moved in 1980 to 1989 (%) - Multirace
Year householder moved into unit - Moved in 1980 to 1989 (%) - Other Race
Year householder moved into unit - Moved in 1970 to 1979 (%)
Year householder moved into unit - Moved in 1970 to 1979 (%) - White
Year householder moved into unit - Moved in 1970 to 1979 (%) - Black or African American
Year householder moved into unit - Moved in 1970 to 1979 (%) - Asian
Year householder moved into unit - Moved in 1970 to 1979 (%) - Hispanic or Latino
Year householder moved into unit - Moved in 1970 to 1979 (%) - American Indian and Alaska Native
Year householder moved into unit - Moved in 1970 to 1979 (%) - Multirace
Year householder moved into unit - Moved in 1970 to 1979 (%) - Other Race
Year householder moved into unit - Moved in 1969 or earlier (%)
Year householder moved into unit - Moved in 1969 or earlier (%) - White
Year householder moved into unit - Moved in 1969 or earlier (%) - Black or African American
Year householder moved into unit - Moved in 1969 or earlier (%) - Asian
Year householder moved into unit - Moved in 1969 or earlier (%) - Hispanic or Latino
Year householder moved into unit - Moved in 1969 or earlier (%) - American Indian and Alaska Native
Year householder moved into unit - Moved in 1969 or earlier (%) - Multirace
Year householder moved into unit - Moved in 1969 or earlier (%) - Other Race
Housing units lacking complete plumbing facilities (%)
Housing units lacking complete kitchen facilities (%)
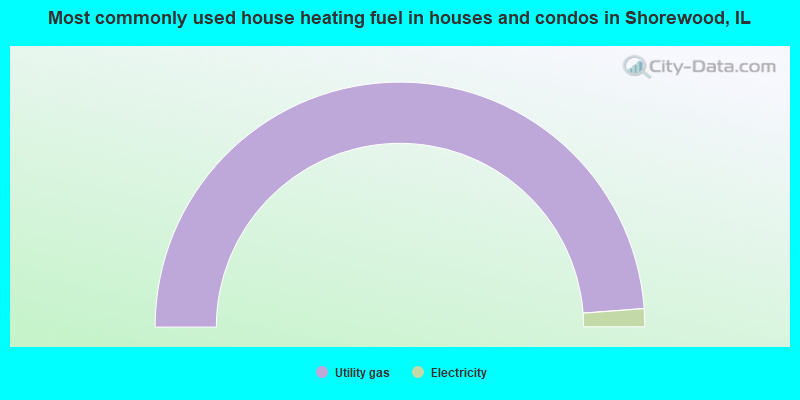
House heating fuel used in houses and condos - Utility gas (%)
House heating fuel used in houses and condos - Bottled, tank, or LP gas (%)
House heating fuel used in houses and condos - Electricity (%)
House heating fuel used in houses and condos - Fuel oil, kerosene, etc. (%)
House heating fuel used in houses and condos - Coal or coke (%)
House heating fuel used in houses and condos - Wood (%)
House heating fuel used in houses and condos - Solar energy (%)
House heating fuel used in houses and condos - Other fuel (%)
House heating fuel used in houses and condos - No fuel used (%)
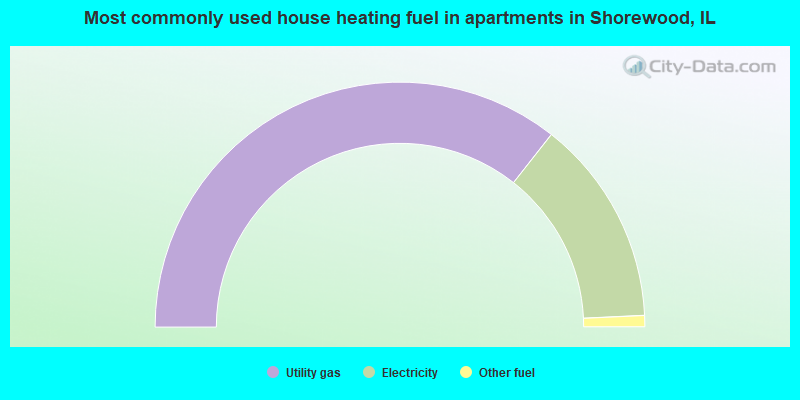
House heating fuel used in apartments - Utility gas (%)
House heating fuel used in apartments - Bottled, tank, or LP gas (%)
House heating fuel used in apartments - Electricity (%)
House heating fuel used in apartments - Fuel oil, kerosene, etc. (%)
House heating fuel used in apartments - Coal or coke (%)
House heating fuel used in apartments - Wood (%)
House heating fuel used in apartments - Solar energy (%)
House heating fuel used in apartments - Other fuel (%)
House heating fuel used in apartments - No fuel used (%)
Latest news about housing in Shorewood, IL collected exclusively by city-data.com from local newspapers, TV, and radio stations
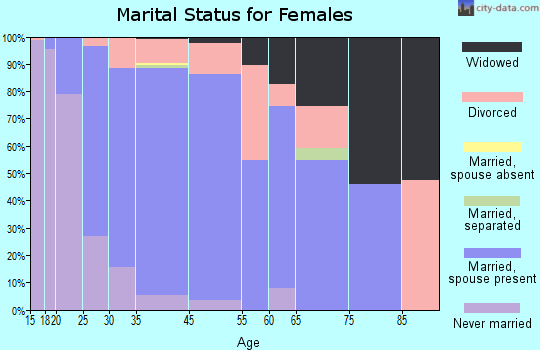
Median year house/condo built: 2003Median year apartment built: 2004Household type by relationship:
Households: 18,108
Male householders: 3,693 (501 living alone ), Female householders: 2,664 (736 living alone )4,201 spouses (4,175 opposite-sex spouses ), 349 unmarried partners , (342 opposite-sex unmarried partners ), 5,891 children (5,387 natural , 166 adopted , 336 stepchildren ), 415 grandchildren , 56 brothers or sisters , 364 parents , 0 foster children , 134 other relatives , 297 non-relatives In group quarters: 34
Size of family households: 2,377 2-persons , 819 3-persons , 895 4-persons , 510 5-persons , 162 6-persons , 99 7-or-more-persons .
Size of nonfamily households: 1,272 1-person , 223 2-persons , 127 3-persons , 6 5-persons .
3,089 married couples with children. single-parent households (70 men , 244 women ).
87.2% of residents of Shorewood speak English at home. of residents speak Spanish at home (71% speak English very well , 24% speak English well , 5% speak English not well ).of residents speak other Indo-European language at home (74% speak English very well , 3% speak English well , 8% speak English not well , 15% don't speak English at all ).of residents speak Asian or Pacific Island language at home (50% speak English very well , 13% speak English well , 11% speak English not well , 26% don't speak English at all ).of residents speak other language at home (100% speak English well ).
Foreign born population: 1,392 (7.7%)of them are naturalized citizens )
Median number of rooms in houses and condos:
Median number of rooms in apartments
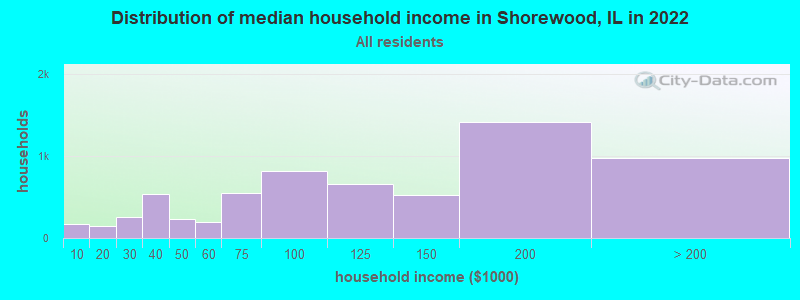
Shorewood, IL household income distribution 173 Less than $10,000147 $10,000 to $19,999254 $20,000 to $29,999540 $30,000 to $39,999227 $40,000 to $49,999192 $50,000 to $59,999550 $60,000 to $74,999822 $75,000 to $99,999664 $100,000 to $124,999524 $125,000 to $149,9991,414 $150,000 to $199,999974 $200,000 or more
Home value of owner - occupied houses in 2022 in Shorewood, IL 230 Less than $10,00014 $10,000 to $14,99938 $20,000 to $24,99915 $25,000 to $29,99918 $40,000 to $49,99915 $50,000 to $59,99930 $70,000 to $79,99933 $100,000 to $124,99965 $125,000 to $149,999210 $150,000 to $174,999327 $175,000 to $199,999732 $200,000 to $249,9991,185 $250,000 to $299,9991,880 $300,000 to $399,9991,293 $400,000 to $499,999278 $500,000 to $749,99929 $750,000 to $999,9994 $1,000,000 to $1,499,99936 $2,000,000 or moreRent paid by renters in 2022 in Shorewood, IL 27 $700 to $74922 $900 to $99952 $1,000 to $1,24968 $1,500 to $1,99912 $2,000 to $2,49911 $3,000 to $3,49936 $3,500 or more16 No cash rent
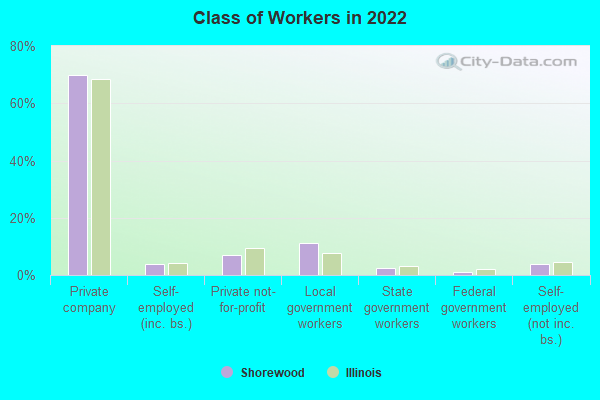
Percentage of workers working in this county: 71.6%Number of people working at home: 1,145 (13.7% of all workers )
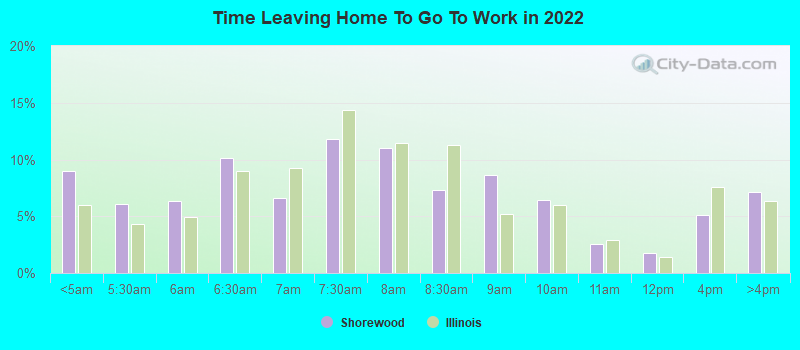
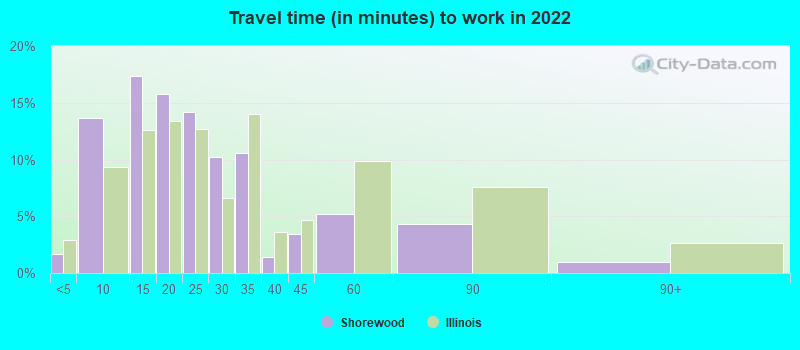
Travel time to work (commute)
Less than 5 minutes: 1235 to 9 minutes: 51010 to 14 minutes: 58115 to 19 minutes: 1,61220 to 24 minutes: 99425 to 29 minutes: 30830 to 34 minutes: 74835 to 39 minutes: 20740 to 44 minutes: 47845 to 59 minutes: 65860 to 89 minutes: 61190 or more minutes: 319
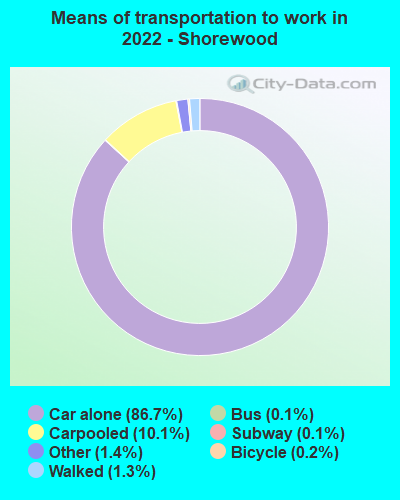
Means of transportation to work:
Drove a car alone: 4,969 (72.4%)Carpooled: 585 (8.5%)Bus : 5 (0.1%)Long-distance train or commuter rail : 5 (0.1%)Taxi: 84 (1.2%)Bicycle: 16 (0.2%)Walked: 58 (0.8%)Worked at home: 1,145 (16.7%)
Unemployment by race in 2022
Unemployment rate for White non-Hispanic residents 5.8% Males0.9% FemalesUnemployment rate for Black residents 2.4% MalesUnemployment rate for Asian residents 7.3% MalesUnemployment rate for other race residents 9.8% MalesUnemployment rate for Hispanic or Latino residents 2.6% Males
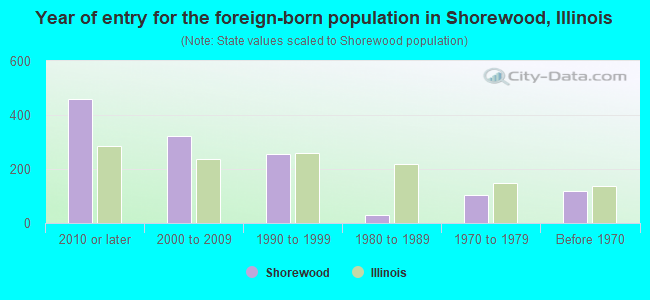
Year of entry for the foreign-born population in Shorewood, Illinois
461 2010 or later 321 2000 to 2009 257 1990 to 1999 30 1980 to 1989 102 1970 to 1979 120 Before 1970
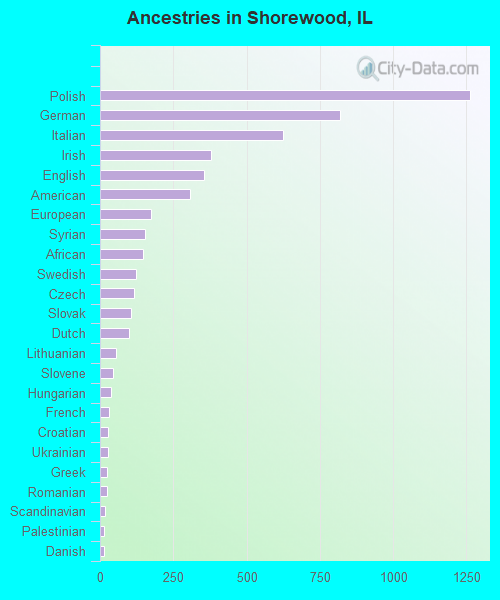
First ancestries reported:
Polish: 1,264 (17.4%)
German: 818 (11.3%)
Italian: 624 (8.6%)
Irish: 378 (5.2%)
English: 355 (4.9%)
American: 306 (4.2%)
European: 175 (2.4%)
Syrian: 153 (2.1%)
African: 147 (2.0%)
Swedish: 124 (1.7%)
Czech: 117 (1.6%)
Slovak: 106 (1.5%)
Dutch: 99 (1.4%)
Lithuanian: 54 (0.7%)
Slovene: 44 (0.6%)
Hungarian: 36 (0.5%)
French: 31 (0.4%)
Croatian: 27 (0.4%)
Ukrainian: 26 (0.4%)
Greek: 25 (0.3%)
Romanian: 23 (0.3%)
Scandinavian: 16 (0.2%)
Palestinian: 14 (0.2%)
Danish: 12 (0.2%)
Arab: 10 (0.1%)
Czechoslovakian: 10 (0.1%)
Norwegian: 10 (0.1%)
Eastern European: 8 (0.1%)
Scotch-Irish: 4 (0.06%) Most common places of birth for foreign-born residents (%): Mexico Shorewood:
33.6% (427)Illinois:
34.7% (626,958)
Vietnam Shorewood:
14.7% (186)Illinois:
1.2% (22,269)
Nepal Shorewood:
14.1% (179)Illinois:
0.2% (3,231)
India Shorewood:
7.3% (93)Illinois:
9.2% (166,409)
Cameroon Shorewood:
6.3% (80)Illinois:
0.1% (1,856)
Venezuela Shorewood:
5.8% (73)Illinois:
0.5% (9,688)
Philippines Shorewood:
4.5% (57)Illinois:
5.2% (93,003)
Belize Shorewood:
2.4% (30)Illinois:
0.3% (4,639)
Moldova Shorewood:
2.3% (29)Illinois:
0.3% (4,938)
Iran Shorewood:
2.2% (28)Illinois:
0.4% (6,922)
Poland Shorewood:
1.8% (23)Illinois:
6.9% (124,474)
Lithuania Shorewood:
1.7% (21)Illinois:
0.6% (10,249)
Place of birth for U.S.-born residents:
This state: 13,878Other state: 2,583Northeast: 297Midwest: 971South: 795West: 537 92.7% of Shorewood residents lived in the same house 1 years ago.
Out of people who lived in different houses, 37.4% lived in this county.
Out of people who lived in different counties, 70.9% lived in Illinois.
Shorewood:
92.7%State average:
88.3%
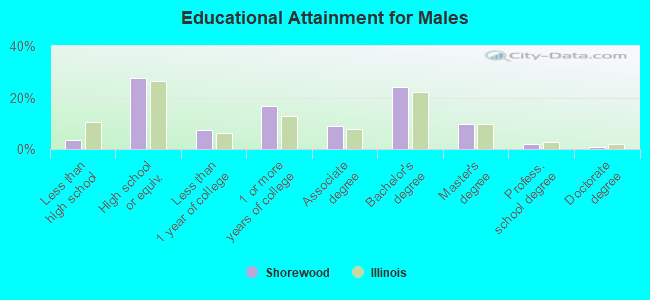
Education attainment for males 25 years and older:
No schooling: 41Nursery to 4th grade: 05th and 6th grade: 07th and 8th grade: 99th grade: 4310th grade: 3711th grade: 3112th grade, no diploma: 57High school graduate (or equivalency): 1,723Less than 1 year of college: 450Some college more than 1 year, no degree: 1,042Associate degree: 557Bachelor's degree: 1,509Master's degree: 608Professional school degree: 112Doctorate degree: 41
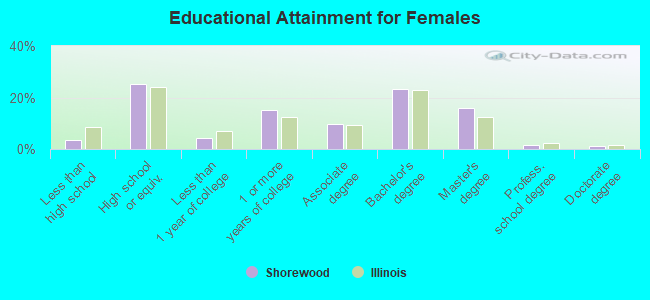
Education attainment for females 25 years and older:
No schooling: 83Nursery to 4th grade: 15th and 6th grade: 117th and 8th grade: 369th grade: 2710th grade: 011th grade: 812th grade, no diploma: 73High school graduate (or equivalency): 1,660Less than 1 year of college: 273Some college more than 1 year, no degree: 992Associate degree: 639Bachelor's degree: 1,513Master's degree: 1,046Professional school degree: 97Doctorate degree: 79
Housing units in structures:
One, detached: 5,519One, attached: 904Two: 755 to 9: 1720 to 49: 1750 or more: 179Mobile homes: 85Median worth of mobile homes: $13,323
Housing units lacking complete plumbing facilities in 2022: 0.7%Housing units lacking complete kitchen facilities in 2022: 0.7%House/condo owner moved in on average 11 years ago
Renter moved in on average 5 years ago
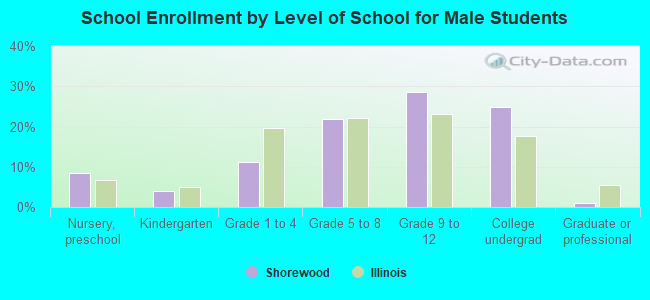
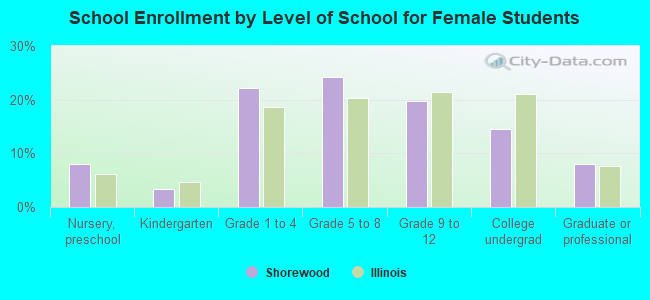
Private vs. public school enrollment:
Students in private schools in grades 1 to 8 (elementary and middle school): 161 Students in private schools in grades 9 to 12 (high school): 79 Students in private undergraduate colleges: 163