Housing density: 5,054 houses/condos per square mile
Median price asked for vacant for-sale houses and condos in 2022: $395,186.
Median rent asked for vacant for-rent units in 2022: $1,416
Housing units in Short Pump with a mortgage: 5,098 (786 second mortgage, 0 home equity loan, 683 both second mortgage and home equity loan) Houses without a mortgage: 125
Median household income for houses/condos with a mortgage: $178,897
Median household income for apartments without a mortgage: $178,819
Size of family households: 3,193 2-persons, 2,022 3-persons, 1,899 4-persons, 495 5-persons, 221 6-persons, 66 7-or-more-persons.
Size of nonfamily households: 2,845 1-person, 610 2-persons, 52 4-persons.
6,373 married couples with children.
733 single-parent households (310 men, 423 women).
73.0% of residents of Short Pump speak English at home.
1.7% of residents speak Spanish at home (69% speak English very well, 8% speak English well, 19% speak English not well, 4% don't speak English at all).
8.8% of residents speak other Indo-European language at home (81% speak English very well, 17% speak English well, 3% speak English not well).
10.9% of residents speak Asian or Pacific Island language at home (75% speak English very well, 17% speak English well, 7% speak English not well, 1% don't speak English at all).
4.6% of residents speak other language at home (88% speak English very well, 10% speak English well, 2% speak English not well).
Foreign born population: 6,777 (23.8%)
(38.9% of them are naturalized citizens)
Rooms in owner-occupied houses in Short Pump, Virginia
511 room
82 rooms
03 rooms
1884 rooms
4775 rooms
9516 rooms
7897 rooms
1,1058 rooms
3,1429+ rooms
Rooms in renter-occupied apartments in Short Pump, Virginia
1241 room
2952 rooms
1,2183 rooms
1,6584 rooms
5135 rooms
3666 rooms
1407 rooms
1868 rooms
2219+ rooms
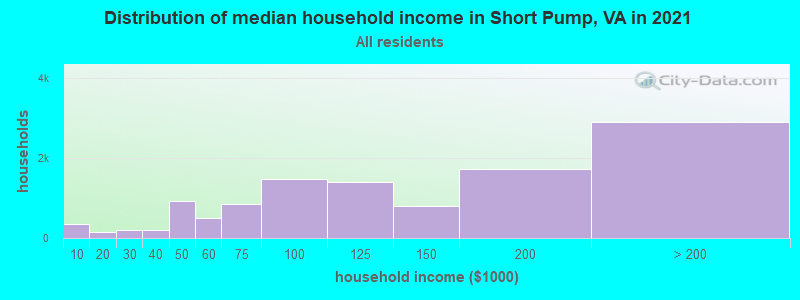
Short Pump, VA household income distribution
459Less than $10,000
190$10,000 to $19,999
151$20,000 to $29,999
253$30,000 to $39,999
664$40,000 to $49,999
433$50,000 to $59,999
755$60,000 to $74,999
1,212$75,000 to $99,999
1,227$100,000 to $124,999
1,278$125,000 to $149,999
1,777$150,000 to $199,999
2,987$200,000 or more
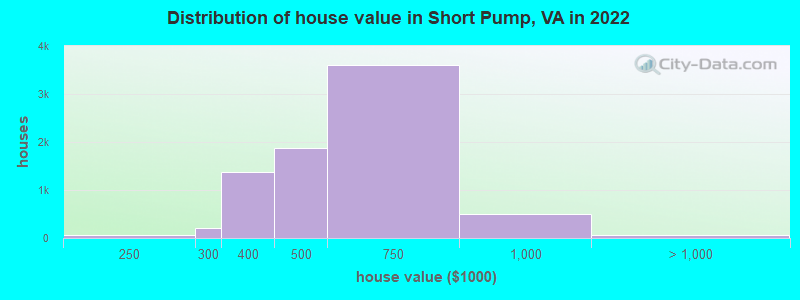
Home value of owner - occupied houses in 2022 in Short Pump, VA
21Less than $10,000
15$80,000 to $89,999
5$125,000 to $149,999
8$175,000 to $199,999
65$200,000 to $249,999
203$250,000 to $299,999
1,381$300,000 to $399,999
1,870$400,000 to $499,999
3,605$500,000 to $749,999
493$750,000 to $999,999
65$1,000,000 to $1,499,999
Rent paid by renters in 2022 in Short Pump, VA
10$550 to $599
114$900 to $999
407$1,000 to $1,249
1,357$1,250 to $1,499
2,298$1,500 to $1,999
614$2,000 to $2,499
256$2,500 to $2,999
85$3,500 or more
114No cash rent
Percentage of workers working in this county: 65.7% Number of people working at home: 4,113 (27.6% of all workers)
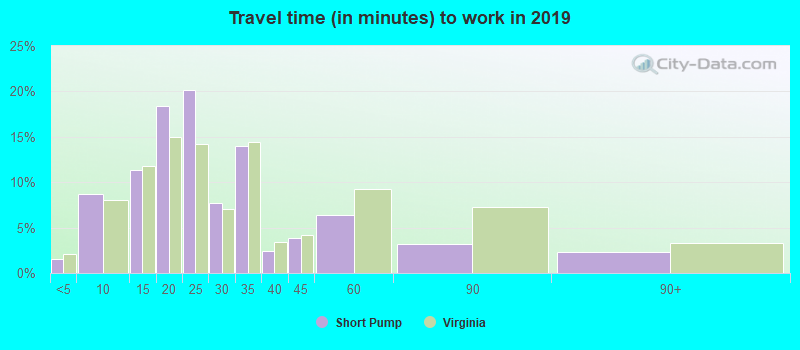
Travel time to work (commute)
Less than 5 minutes: 382
5 to 9 minutes: 1,148
10 to 14 minutes: 1,369
15 to 19 minutes: 2,283
20 to 24 minutes: 2,014
25 to 29 minutes: 1,149
30 to 34 minutes: 1,700
35 to 39 minutes: 135
40 to 44 minutes: 192
45 to 59 minutes: 206
60 to 89 minutes: 315
90 or more minutes: 125
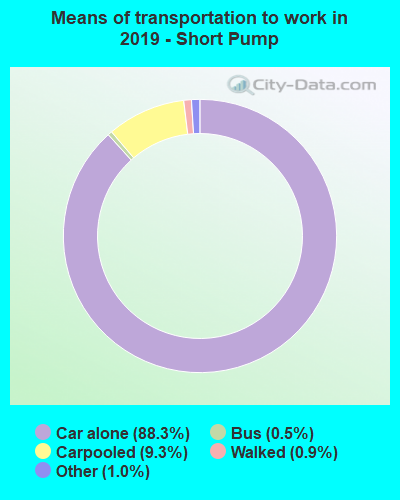
Means of transportation to work:
Drove a car alone: 9,894 (65.7%)
Carpooled: 879 (5.8%)
Bus: 19 (0.1%)
Taxi: 291 (1.9%)
Bicycle: 75 (0.5%)
Walked: 116 (0.8%)
Worked at home: 4,113 (27.3%)
Unemployment by race in 2022
Unemployment rate for White non-Hispanic residents
2.1%Males
0.9%Females
Unemployment rate for Black residents
11.7%Males
Unemployment rate for Asian residents
0.9%Males
2.0%Females
Unemployment rate for other race residents
22.0%Females
Unemployment rate for two or more race residents
1.7%Males
2.8%Females
Unemployment rate for Hispanic or Latino residents
1.7%Males
4.6%Females
First ancestries reported:
English: 1,407 (8.6%)
American: 1,332 (8.2%)
German: 895 (5.5%)
Irish: 860 (5.3%)
Italian: 525 (3.2%)
European: 454 (2.8%)
Scottish: 390 (2.4%)
Ethiopian: 369 (2.3%)
Sudanese: 223 (1.4%)
Lebanese: 137 (0.8%)
Egyptian: 133 (0.8%)
Polish: 131 (0.8%)
Eastern European: 105 (0.6%)
Austrian: 88 (0.5%)
Greek: 86 (0.5%)
Swedish: 86 (0.5%)
Nigerian: 86 (0.5%)
Scotch-Irish: 82 (0.5%)
Israeli: 78 (0.5%)
Iranian: 75 (0.5%)
British: 63 (0.4%)
Russian: 62 (0.4%)
Norwegian: 57 (0.3%)
Dutch: 50 (0.3%)
Czechoslovakian: 50 (0.3%)
Haitian: 49 (0.3%)
Canadian: 43 (0.3%)
Palestinian: 39 (0.2%)
Northern European: 35 (0.2%)
Turkish: 29 (0.2%)
Armenian: 26 (0.2%)
Romanian: 25 (0.2%)
French: 23 (0.1%)
Portuguese: 23 (0.1%)
Ghanaian: 22 (0.1%)
Danish: 19 (0.1%)
Belgian: 18 (0.1%)
Afghan: 18 (0.1%)
Welsh: 16 (0.10%)
French Canadian: 15 (0.09%)
Lithuanian: 15 (0.09%)
Croatian: 14 (0.09%)
Bulgarian: 11 (0.07%)
Hungarian: 10 (0.06%)
Trinidadian and Tobagonian: 10 (0.06%)
Barbadian: 9 (0.06%)
Czech: 7 (0.04%)
Kenyan: 7 (0.04%)
Most common places of birth for foreign-born residents (%):
India
Short Pump:
50.5% (3,557)
Virginia:
9.0% (97,830)
China, excluding Hong Kong and Taiwan
Short Pump:
9.8% (692)
Virginia:
3.9% (42,989)
Ethiopia
Short Pump:
5.2% (365)
Virginia:
2.9% (32,082)
Korea
Short Pump:
4.3% (301)
Virginia:
4.9% (52,857)
Philippines
Short Pump:
2.5% (177)
Virginia:
4.8% (52,629)
Mexico
Short Pump:
2.2% (158)
Virginia:
5.3% (57,498)
Taiwan
Short Pump:
1.9% (135)
Virginia:
0.6% (7,042)
Pakistan
Short Pump:
1.9% (134)
Virginia:
2.3% (24,582)
Egypt
Short Pump:
1.7% (118)
Virginia:
0.9% (9,672)
Canada
Short Pump:
1.7% (118)
Virginia:
1.2% (12,984)
Nepal
Short Pump:
1.6% (111)
Virginia:
0.9% (9,695)
Place of birth for U.S.-born residents:
This state: 11,149
Other state: 10,219
Northeast: 3,993
Midwest: 1,454
South: 3,436
West: 1,363
81.1% of Short Pump residents lived in the same house 1 years ago. Out of people who lived in different houses, 32.5% lived in this county. Out of people who lived in different counties, 47.9% lived in Virginia.
Short Pump:
81.1%
State average:
86.6%
Education attainment for males 25 years and older:
No schooling: 28
Nursery to 4th grade: 0
5th and 6th grade: 0
7th and 8th grade: 58
9th grade: 0
10th grade: 0
11th grade: 0
12th grade, no diploma: 152
High school graduate (or equivalency): 337
Less than 1 year of college: 294
Some college more than 1 year, no degree: 521
Associate degree: 798
Bachelor's degree: 3,659
Master's degree: 2,672
Professional school degree: 806
Doctorate degree: 348
Education attainment for females 25 years and older:
No schooling: 40
Nursery to 4th grade: 0
5th and 6th grade: 0
7th and 8th grade: 17
9th grade: 0
10th grade: 87
11th grade: 10
12th grade, no diploma: 81
High school graduate (or equivalency): 909
Less than 1 year of college: 150
Some college more than 1 year, no degree: 880
Associate degree: 577
Bachelor's degree: 4,577
Master's degree: 2,750
Professional school degree: 450
Doctorate degree: 420
Housing units in structures:
One, detached: 5,867
One, attached: 1,808
Two: 31
3 or 4: 54
5 to 9: 442
10 to 19: 1,835
20 to 49: 1,228
50 or more: 688
Mobile homes: 29
Housing units lacking complete plumbing facilities in 2022: 0.3%
Housing units lacking complete kitchen facilities in 2022: 1.4%