Silver Springs, NV (Nevada) Houses and Residents
| Silver Springs: | $263,285 |
| Nevada: | $434,700 |
Total population: 5,296 (Urban population: 0, Rural population: 4,818 (22 farm, 4,796 nonfarm))
Houses: 2,719 (2,396 occupied: 1,922 owner occupied, 470 renter occupied)
| % of renters here: | 20% |
| State: | 40% |
Housing density: 38 houses/condos per square mile
Median price asked for vacant for-sale houses and condos in 2022: $202,851.
Median contract rent in 2022: $1,057 (lower quartile is $934, upper quartile is $1,272)
Median rent asked for vacant for-rent units in 2022: $637
Median gross rent in Silver Springs, NV in 2022: $1,382
Housing units in Silver Springs with a mortgage: 1,080 (83 second mortgage, 0 home equity loan, 76 both second mortgage and home equity loan)
Houses without a mortgage: 0
Median household income for houses/condos with a mortgage: $65,216
Median household income for apartments without a mortgage: $30,031
Median monthly housing costs: $964
Compare current foreclosures near Silver Springs, NV:
| Photo | Address | Area | Beds / Baths | Price | Details |
|---|---|---|---|---|---|

|
#1
Tuscarora St
Silver Springs, NV 89429
|
1,560 sq. feet
|
2 baths 3 beds |
show details | |

|
#2
Karen St
Silver Springs, NV 89429
|
1,404 sq. feet
|
2 baths 3 beds |
show details | |

|
#3
Shoshone Dr
Silver Springs, NV 89429
|
1,632 sq. feet
|
2 baths 3 beds |
show details | |

|
#4
Cheyenne Trl
Silver Springs, NV 89429
|
1,536 sq. feet
|
2 baths 3 beds |
show details | |

|
#5
E 5th St
Silver Springs, NV 89429
|
1,375 sq. feet
|
2 baths 3 beds |
show details | |

|
#6
Pawnee Dr
Silver Springs, NV 89429
|
- sq. feet
|
- baths - beds |
show details | |

|
#7
E 7th St
Silver Springs, NV 89429
|
- sq. feet
|
- baths - beds |
show details | |

|
#8
Sioux Ln
Silver Springs, NV 89429
|
- sq. feet
|
- baths - beds |
show details | |

|
#9
Pueblo St
Silver Springs, NV 89429
|
- sq. feet
|
- baths - beds |
show details | |

|
#10
Ardmore St
Silver Springs, NV 89429
|
- sq. feet
|
- baths - beds |
show details |
| Photo | Address | Area | Beds / Baths | Price | Details |
|---|---|---|---|---|---|

|
#11
Desert Springs Ln
Fernley, NV 89408
|
1,760 sq. feet
|
2 baths 3 beds |
show details | |

|
#12
Emigrant Way
Fernley, NV 89408
|
1,250 sq. feet
|
2 baths 3 beds |
show details | |

|
#13
Shadow Ln
Fernley, NV 89408
|
1,213 sq. feet
|
2 baths 3 beds |
show details | |

|
#14
Trubode Ln
Fernley, NV 89408
|
1,476 sq. feet
|
2 baths 3 beds |
show details | |

|
#15
Darren Way
Fernley, NV 89408
|
1,471 sq. feet
|
2 baths 3 beds |
show details | |

|
#16
Prairie Ln
Fernley, NV 89408
|
1,520 sq. feet
|
2 baths 3 beds |
show details | |

|
#17
Todd Ct
Fernley, NV 89408
|
1,566 sq. feet
|
2 baths 3 beds |
show details | |

|
#18
Stone Creek Ct
Fernley, NV 89408
|
1,425 sq. feet
|
2 baths 3 beds |
show details | |

|
#19
Desert Springs Ln
Fernley, NV 89408
|
1,760 sq. feet
|
2 baths 3 beds |
show details | |

|
#20
Fort Sutter Blvd
Fernley, NV 89408
|
1,476 sq. feet
|
2 baths 3 beds |
show details |
| Photo | Address | Area | Beds / Baths | Price | Details |
|---|---|---|---|---|---|

|
#21
Emigrant Way
Fernley, NV 89408
|
1,284 sq. feet
|
2 baths 3 beds |
show details | |

|
#22
Rose Ln
Fernley, NV 89408
|
1,724 sq. feet
|
2 baths 4 beds |
show details | |

|
#23
D St
Fernley, NV 89408
|
1,488 sq. feet
|
2 baths 3 beds |
show details | |

|
#24
Sage St
Fernley, NV 89408
|
1,380 sq. feet
|
2 baths 3 beds |
show details | |

|
#25
Dixie Ln
Fernley, NV 89408
|
1,960 sq. feet
|
2 baths 4 beds |
show details | |

|
#26
Winter Pl
Fernley, NV 89408
|
1,815 sq. feet
|
2 baths 4 beds |
show details | |

|
#27
Cook Way
Fernley, NV 89408
|
2,223 sq. feet
|
2 baths 4 beds |
show details | |

|
#28
Brierwood Ln
Fernley, NV 89408
|
2,103 sq. feet
|
2 baths 4 beds |
show details | |

|
#29
Ruby St
Fernley, NV 89408
|
1,588 sq. feet
|
2 baths 3 beds |
show details | |

|
#30
Garnet Way
Fernley, NV 89408
|
2,491 sq. feet
|
3 baths 5 beds |
show details |
| Photo | Address | Area | Beds / Baths | Price | Details |
|---|---|---|---|---|---|

|
#31
Rawles Dr
Fernley, NV 89408
|
1,850 sq. feet
|
2 baths 3 beds |
show details | |

|
#32
Fremont St
Fernley, NV 89408
|
1,512 sq. feet
|
2 baths 3 beds |
show details | |

|
#33
Sandia Dr
Fernley, NV 89408
|
1,632 sq. feet
|
2 baths 3 beds |
show details | |

|
#34
Oak Dr
Fernley, NV 89408
|
2,472 sq. feet
|
2 baths 4 beds |
show details | |

|
#35
Alpine Dr
Fernley, NV 89408
|
3,516 sq. feet
|
3 baths 7 beds |
show details | |

|
#36
Mountain Rose Dr
Fernley, NV 89408
|
1,532 sq. feet
|
2 baths 3 beds |
show details | |

|
#37
Cottonwood Ln
Fernley, NV 89408
|
- sq. feet
|
- baths - beds |
show details | |

|
#38
Cottonwood Lane
Fernley, NV 89408
|
- sq. feet
|
- baths - beds |
show details | |

|
#39
Cottonwood
Fernley, NV 89408
|
- sq. feet
|
- baths - beds |
show details | |

|
#40
Cottonwood
Fernley, NV 89408
|
- sq. feet
|
- baths - beds |
show details |
| Photo | Address | Area | Beds / Baths | Price | Details |
|---|---|---|---|---|---|

|
#41
Cottonwood Lane
Fernley, NV 89408
|
- sq. feet
|
- baths - beds |
show details | |

|
#42
Desert Springs Ln
Fernley, NV 89408
|
- sq. feet
|
- baths - beds |
show details | |

|
#43
E Cedar St
Fernley, NV 89408
|
- sq. feet
|
- baths - beds |
show details | |

|
#44
Winnies Ln
Fernley, NV 89408
|
- sq. feet
|
- baths - beds |
show details | |

|
#45
Pony Express Trl Unit B
Dayton, NV 89403
|
- sq. feet
|
- baths - beds |
show details | |

|
#46
Canal Dr
Fernley, NV 89408
|
- sq. feet
|
- baths - beds |
show details | |

|
#47
N Fork Rd
Fernley, NV 89408
|
- sq. feet
|
- baths - beds |
show details | |

|
#48
Fremont St
Fernley, NV 89408
|
- sq. feet
|
- baths - beds |
show details | |

|
#49
Willow Way Apt 2109
Fernley, NV 89408
|
- sq. feet
|
- baths - beds |
show details | |

|
Check over 1 million property listings on Foreclosure.com!
|
browse all offers | |||


 | Theft (76 replies) |
| Potential Move to Las Vegas from DC area: outdoors person (19 replies) |
| Fernley, NV livability (30 replies) |
| building / living in Virginia city Highlands (21 replies) |
| Henderson parents: Green Valley North, South, Ranch or Gibson Springs? (2 replies) |
| Moving to Dayton Nevada (20 replies) |

Median year apartment built: 1982
Household type by relationship:
Households: 5,237- Male householders: 1,530 (552 living alone), Female householders: 848 (335 living alone)
824 spouses (819 opposite-sex spouses), 222 unmarried partners, (222 opposite-sex unmarried partners), 876 children (809 natural, 45 adopted, 21 stepchildren), 115 grandchildren, 138 brothers or sisters, 182 parents, 51 foster children, 202 other relatives, 232 non-relatives
- In group quarters: 13
Size of family households: 636 2-persons, 266 3-persons, 169 4-persons, 162 5-persons, 22 6-persons, 30 7-or-more-persons.
Size of nonfamily households: 881 1-person, 210 2-persons, 8 3-persons.
420 married couples with children.
130 single-parent households (89 men, 41 women).
94.7% of residents of Silver Springs speak English at home.
2.8% of residents speak Spanish at home (42% speak English very well, 48% speak English well, 10% speak English not well).
0.8% of residents speak other Indo-European language at home (72% speak English very well, 28% speak English not well).
1.9% of residents speak Asian or Pacific Island language at home (17% speak English very well, 15% speak English well, 68% don't speak English at all).
0.1% of residents speak other language at home (100% speak English very well).
Foreign born population: 321 (6.1%)
(32.1% of them are naturalized citizens)
| Here: | 5.2 |
| State: | 6.0 |
| Here: | 4.9 |
| State: | 4.2 |

- Bedrooms in owner-occupied houses and condos in Silver Springs, Nevada
- 32no bedroom
- 891 bedroom
- 2742 bedrooms
- 1,2733 bedrooms
- 2384 bedrooms
- 185+ bedrooms

- Bedrooms in renter-occupied apartments in Silver Springs, Nevada
- 45no bedroom
- 81 bedroom
- 1122 bedrooms
- 2983 bedrooms
- 74 bedrooms
- 05+ bedrooms

- Cars and other vehicles available in Silver Springs in owner-occupied houses/condos
- 31no vehicle
- 4991 vehicle
- 5292 vehicles
- 4773 vehicles
- 3244 vehicles
- 625+ vehicles

- Cars and other vehicles available in Silver Springs in renter-occupied apartments
- 31no vehicle
- 1121 vehicle
- 2422 vehicles
- 373 vehicles
- 244 vehicles
- 255+ vehicles

- Rooms in owner-occupied houses in Silver Springs, Nevada
- 321 room
- 82 rooms
- 803 rooms
- 3604 rooms
- 6345 rooms
- 2916 rooms
- 1997 rooms
- 1778 rooms
- 1409+ rooms

- Rooms in renter-occupied apartments in Silver Springs, Nevada
- 451 room
- 02 rooms
- 83 rooms
- 284 rooms
- 3445 rooms
- 336 rooms
- 77 rooms
- 08 rooms
- 59+ rooms


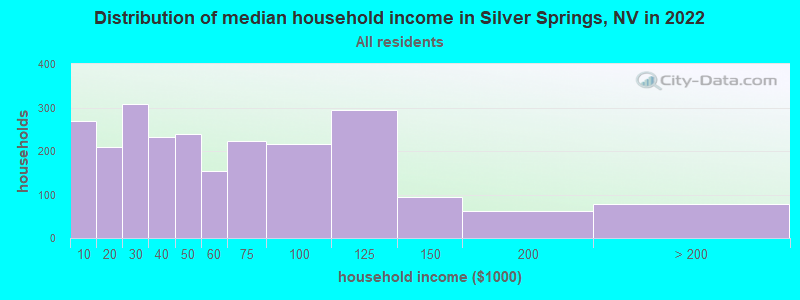
Silver Springs, NV household income distribution

- 268Less than $10,000
- 210$10,000 to $19,999
- 309$20,000 to $29,999
- 233$30,000 to $39,999
- 240$40,000 to $49,999
- 154$50,000 to $59,999
- 223$60,000 to $74,999
- 217$75,000 to $99,999
- 295$100,000 to $124,999
- 94$125,000 to $149,999
- 61$150,000 to $199,999
- 78$200,000 or more
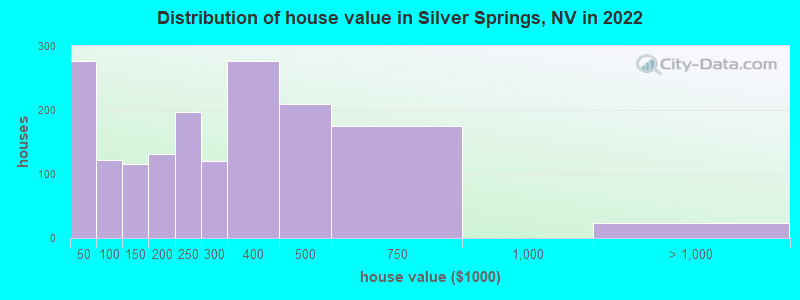
Home value of owner - occupied houses in 2022 in Silver Springs, NV
-
- 122Less than $10,000
- 28$15,000 to $19,999
- 6$25,000 to $29,999
- 56$30,000 to $34,999
- 21$35,000 to $39,999
- 40$40,000 to $49,999
- 24$50,000 to $59,999
- 19$80,000 to $89,999
- 38$90,000 to $99,999
- 61$100,000 to $124,999
- 54$125,000 to $149,999
- 80$150,000 to $174,999
- 51$175,000 to $199,999
- 197$200,000 to $249,999
- 121$250,000 to $299,999
- 277$300,000 to $399,999
- 209$400,000 to $499,999
- 174$500,000 to $749,999
- 23$1,000,000 to $1,499,999
Rent paid by renters in 2022 in Silver Springs, NV
-
- 8$100 to $149
- 7$200 to $249
- 10$250 to $299
- 20$400 to $449
- 5$500 to $549
- 6$550 to $599
- 6$750 to $799
- 24$800 to $899
- 80$900 to $999
- 109$1,000 to $1,249
- 10$1,500 to $1,999
- 53$2,000 to $2,499
- 87No cash rent


Percentage of workers working in this county: 48.8%
Number of people working at home: 95 (5.3% of all workers)
Travel time to work (commute)
- Less than 5 minutes: 65
- 5 to 9 minutes: 105
- 10 to 14 minutes: 72
- 15 to 19 minutes: 149
- 20 to 24 minutes: 162
- 25 to 29 minutes: 96
- 30 to 34 minutes: 274
- 35 to 39 minutes: 150
- 40 to 44 minutes: 0
- 45 to 59 minutes: 325
- 60 to 89 minutes: 198
- 90 or more minutes: 39
Means of transportation to work:
- Drove a car alone: 1,520 (76.3%)
- Carpooled: 325 (16.3%)
- Motorcycle: 7 (0.4%)
- Walked: 67 (3.4%)
- Worked at home: 73 (3.7%)

- Unemployment by race in 2022
- Unemployment rate for White non-Hispanic residents
- 9.4%Males
- 2.7%Females
- Unemployment rate for American Indian and Alaska Native residents
- 57.1%Males
- Unemployment rate for other race residents
- 6.6%Males
- Unemployment rate for two or more race residents
- 3.2%Males

- Year of entry for the foreign-born population in Silver Springs, Nevada
- 1312010 or later
- 172000 to 2009
- 1311990 to 1999
- 331980 to 1989
- 71970 to 1979
- 44Before 1970

First ancestries reported:
- American: 628 (22.9%)
- German: 289 (10.5%)
- English: 239 (8.7%)
- Irish: 196 (7.1%)
- Italian: 157 (5.7%)
- Norwegian: 84 (3.1%)
- Scottish: 55 (2.0%)
- Polish: 36 (1.3%)
- European: 34 (1.2%)
- Dutch: 29 (1.1%)
- Swedish: 25 (0.9%)
- British: 21 (0.8%)
- Scandinavian: 9 (0.3%)
- Danish: 7 (0.3%)
- Portuguese: 6 (0.2%)
- Slovene: 6 (0.2%)
Most common places of birth for foreign-born residents (%):
| Silver Springs: | 28.3% (91) |
| Nevada: | 36.8% (218,248) |
| Silver Springs: | 20.6% (66) |
| Nevada: | 4.0% (23,923) |
| Silver Springs: | 19.9% (64) |
| Nevada: | 3.3% (19,621) |
| Silver Springs: | 14.0% (45) |
| Nevada: | 0.7% (4,038) |
| Silver Springs: | 8.4% (27) |
| Nevada: | 1.9% (11,407) |
| Silver Springs: | 7.8% (25) |
| Nevada: | 0.2% (1,474) |
Place of birth for U.S.-born residents:
- This state: 1,093
- Other state: 3,753
- Northeast: 226
- Midwest: 516
- South: 294
- West: 2,733
91.5% of Silver Springs residents lived in the same house 1 years ago.
Out of people who lived in different houses, 23.4% lived in this county.
Out of people who lived in different counties, 50.4% lived in Nevada.
| Silver Springs: | 91.5% |
| State average: | 86.4% |
Education attainment for males 25 years and older:
- No schooling: 7
- Nursery to 4th grade: 0
- 5th and 6th grade: 0
- 7th and 8th grade: 84
- 9th grade: 24
- 10th grade: 128
- 11th grade: 31
- 12th grade, no diploma: 175
- High school graduate (or equivalency): 709
- Less than 1 year of college: 393
- Some college more than 1 year, no degree: 298
- Associate degree: 225
- Bachelor's degree: 228
- Master's degree: 92
- Professional school degree: 27
- Doctorate degree: 17

Education attainment for females 25 years and older:
- No schooling: 26
- Nursery to 4th grade: 0
- 5th and 6th grade: 0
- 7th and 8th grade: 25
- 9th grade: 61
- 10th grade: 92
- 11th grade: 106
- 12th grade, no diploma: 51
- High school graduate (or equivalency): 797
- Less than 1 year of college: 176
- Some college more than 1 year, no degree: 267
- Associate degree: 66
- Bachelor's degree: 146
- Master's degree: 30
- Professional school degree: 6
- Doctorate degree: 17


Housing units in structures:
- One, detached: 1,194
- Two: 8
- 5 to 9: 9
- 20 to 49: 39
- Mobile homes: 1,454
- Boats, RVs, vans, etc.: 14
Median worth of mobile homes: $199,604
Housing units lacking complete kitchen facilities in 2022: 4.3%
House/condo owner moved in on average 12 years ago
Renter moved in on average 1 years ago

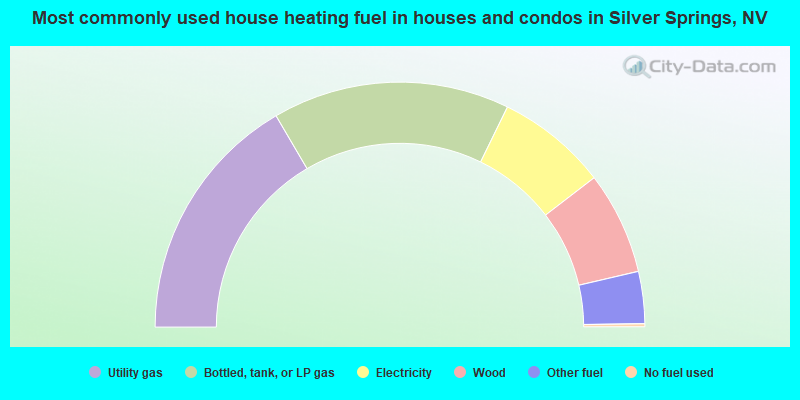
- 33.2%Utility gas
- 31.4%Bottled, tank, or LP gas
- 14.7%Electricity
- 13.6%Wood
- 6.9%Other fuel
- 0.4%No fuel used
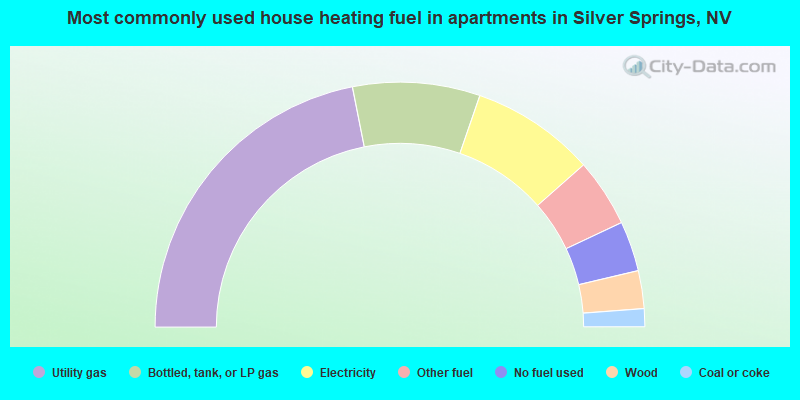
- 43.8%Utility gas
- 16.8%Bottled, tank, or LP gas
- 16.4%Electricity
- 9.0%Other fuel
- 6.6%No fuel used
- 5.0%Wood
- 2.4%Coal or coke
Private vs. public school enrollment:
| Here: | 10.6% |
| Nevada: | 12.9% |
| Here: | 19.6% |
| Nevada: | 6.9% |
| Here: | 10.9% |
| Nevada: | 16.0% |


