Slidell, LA (Louisiana) Houses and Residents
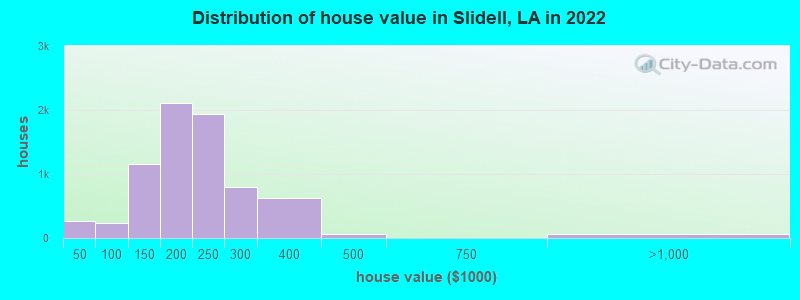
Estimated median house or condo value in 2022: $204,224 (it was $90,200 in 2000 )
Slidell:
$204,224Louisiana:
$209,200
Lower value quartile - upper value quartile: $160,687 - $247,800Mean price in 2022: Detached houses: $246,571 Here:
$246,571State:
$273,555
Townhouses or other attached units: $211,648 Here:
$211,648State:
$297,713
In 2-unit structures: $304,699 Here:
$304,699State:
$325,117
In 3-to-4-unit structures: $361,883 Here:
$361,883State:
$213,088
In 5-or-more-unit structures: $179,446 Here:
$179,446State:
$257,054
Mobile homes: $65,117 Here:
$65,117State:
$89,857
Total population: 27,622 (Urban population: 25,588, Rural population: 0)
Houses: 12,143 (11,117 occupied: 7,926 owner occupied, 3,354 renter occupied )
% of renters here:
30%State:
32%
Housing density: 1,030 houses/condos per square mile
Median price asked for vacant for-sale houses and condos in 2022: $107,724.
Median contract rent in 2022: $1,014 (lower quartile is $731, upper quartile is $1,363)
Median rent asked for vacant for-rent units in 2022: $1,634
Median gross rent in Slidell, LA in 2022: $1,327
Housing units in Slidell with a mortgage: 4,625 (148 second mortgage, 18 home equity loan, 89 both second mortgage and home equity loan )Houses without a mortgage: 31
Median household income for houses/condos with a mortgage: $85,631
Median household income for apartments without a mortgage: $58,322
Median monthly housing costs: $1,173
Data:
Median house or condo value ($)
Median house or condo value ($ change since 2000)
Median house or condo value ($) - White
Median house or condo value ($) - Black or African American
Median house or condo value ($) - Asian
Median house or condo value ($) - Hispanic or Latino
Median house or condo value ($) - American Indian and Alaska Native
Median house or condo value ($) - Multirace
Median house or condo value ($) - Other Race
Median price asked for mobile homes ($)
Household density (households per square mile)
Mean house or condo value by units in structure - 1, detached ($)
Mean house or condo value by units in structure - 1, attached ($)
Mean house or condo value by units in structure - 2 ($)
Mean house or condo value by units in structure by units in structure - 3 or 4 ($)
Mean house or condo value by units in structure - 5 or more ($)
Mean house or condo value by units in structure - Boat, RV, van, etc. ($)
Mean house or condo value by units in structure - Mobile home ($)
Median contract rent ($)
Median contract rent - Lower quartile ($)
Median contract rent - Upper quartile ($)
Median gross rent ($)
Urban houses (%)
Rural houses (%)
Houses occupied (%)
Houses occupied (% change since 2000)
Houses owner occupied (%)
Houses owner occupied (% change since 2000)
Houses renter occupied (%)
Houses renter occupied (% change since 2000)
Vacant housing units - For rent (%)
Vacant housing units - For rent (% change since 2000)
Vacant housing units - For sale only (%)
Vacant housing units - For sale only (% change since 2000)
Vacant housing units - Rented or sold, not occupied (%)
Vacant housing units - Rented or sold, not occupied (% change since 2000)
Vacant housing units - For seasonal, recreational, or occasional use (%)
Vacant housing units - For seasonal, recreational, or occasional use (% change since 2000)
Vacant housing units - For migrant workers (%)
Vacant housing units - For migrant workers (% change since 2000)
Vacant housing units - Other vacant (%)
Vacant housing units - Other vacant (% change since 2000)
Median monthly housing costs ($)
Median household income for houses/condos with a mortgage ($)
Median household income for houses/condos without a mortgage ($)
Median household income ($)
Median household income ($) - White
Median household income ($) - Black or African American
Median household income ($) - Asian
Median household income ($) - Hispanic or Latino
Median household income ($) - American Indian and Alaska Native
Median household income ($) - Multirace
Median household income ($) - Other Race
Mortgage status - with mortgage (%)
Mortgage status - with second mortgage (%)
Mortgage status - with home equity loan (%)
Mortgage status - with both second mortgage and home equity loan (%)
Mortgage status - without a mortgage (%)
Median year house/condo built
Median year apartment built
Household type by relationship - Male householder living alone (%)
Household type by relationship - Male householder not living alone (%)
Household type by relationship - Female householder living alone (%)
Household type by relationship - Female householder not living alone (%)
Household type by relationship - Opposite-Sex spouse (%)
Household type by relationship - Same-Sex spouse (%)
Household type by relationship - Opposite-Sex unmarried partner (%)
Household type by relationship - Same-Sex unmarried partner (%)
Household type by relationship - In group quarters (%)
Size of family households - 2-person household (%)
Size of family households - 3-person household (%)
Size of family households - 4-person household (%)
Size of family households - 5-person household (%)
Size of family households - 6-person household (%)
Size of family households - 7-or-more-person household (%)
Size of nonfamily households - 1-person household (%)
Size of nonfamily households - 2-person household (%)
Size of nonfamily households - 3-person household (%)
Size of nonfamily households - 4-person household (%)
Size of nonfamily households - 5-person household (%)
Size of nonfamily households - 6-person household (%)
Size of nonfamily households - 7-or-moreperson household (%)
Year house built - Built 2010 or later (%)
Year house built - Built 2000 to 2009 (%)
Year house built - Built 1990 to 1999 (%)
Year house built - Built 1980 to 1989 (%)
Year house built - Built 1970 to 1979 (%)
Year house built - Built 1960 to 1969 (%)
Year house built - Built 1950 to 1959 (%)
Year house built - Built 1940 to 1949 (%)
Year house built - Built 1939 or earlier (%)
Median number of rooms in houses and condos
Median number of rooms in apartments
Median number of bedrooms in owner occupied houses
Mean number of bedrooms in owner occupied houses
Median number of bedrooms in renter occupied houses
Mean number of bedrooms in renter occupied houses
Median number of vehichles in owner occupied houses
Mean number of vehichles in owner occupied houses
Median number of vehichles in renter occupied houses
Mean number of vehichles in renter occupied houses
Rooms in owner-occupied houses - 1 room (%)
Rooms in owner-occupied houses - 2 rooms (%)
Rooms in owner-occupied houses - 3 rooms (%)
Rooms in owner-occupied houses - 4 rooms (%)
Rooms in owner-occupied houses - 5 rooms (%)
Rooms in owner-occupied houses - 6 rooms (%)
Rooms in owner-occupied houses - 7 rooms (%)
Rooms in owner-occupied houses - 8 rooms (%)
Rooms in owner-occupied houses - 9+ rooms (%)
Rooms in renter-occupied houses - 1 room (%)
Rooms in renter-occupied houses - 2 rooms (%)
Rooms in renter-occupied houses - 3 rooms (%)
Rooms in renter-occupied houses - 4 rooms (%)
Rooms in renter-occupied houses - 5 rooms (%)
Rooms in renter-occupied houses - 6 rooms (%)
Rooms in renter-occupied houses - 7 rooms (%)
Rooms in renter-occupied houses - 8 rooms (%)
Rooms in renter-occupied houses - 9+ rooms (%)
Bedrooms in owner-occupied houses - no bedrooms (%)
Bedrooms in owner-occupied houses - 1 bedroom (%)
Bedrooms in owner-occupied houses - 2 bedrooms (%)
Bedrooms in owner-occupied houses - 3 bedrooms (%)
Bedrooms in owner-occupied houses - 4 bedrooms (%)
Bedrooms in owner-occupied houses - 5+ bedrooms (%)
Bedrooms in renter-occupied houses - no bedrooms (%)
Bedrooms in renter-occupied houses - 1 bedroom (%)
Bedrooms in renter-occupied houses - 2 bedrooms (%)
Bedrooms in renter-occupied houses - 3 bedrooms (%)
Bedrooms in renter-occupied houses - 4 bedrooms (%)
Bedrooms in renter-occupied houses - 5+ bedrooms (%)
Vehicles available in owner-occupied houses - no vehicle available (%)
Vehicles available in owner-occupied houses - 1 vehicle available(%)
Vehicles available in owner-occupied houses - 2 Vehicles available (%)
Vehicles available in owner-occupied houses - 3 Vehicles available (%)
Vehicles available in owner-occupied houses - 4 Vehicles available (%)
Vehicles available in owner-occupied houses - 5+ Vehicles available (%)
Vehicles available in renter-occupied houses - no vehicle available (%)
Vehicles available in renter-occupied houses - 1 vehicle available (%)
Vehicles available in renter-occupied houses - 2 Vehicles available (%)
Vehicles available in renter-occupied houses - 3 Vehicles available (%)
Vehicles available in renter-occupied houses - 4 Vehicles available (%)
Vehicles available in renter-occupied houses - 5+ Vehicles available (%)
Housing units in structures - 1, detached (%)
Housing units in structures - 1, attached (%)
Housing units in structures - 2 (%)
Housing units in structures - 3 or 4 (%)
Housing units in structures - 5 to 9 (%)
Housing units in structures - 10 to 19 (%)
Housing units in structures - 20 to 49 (%)
Housing units in structures - 50 or more (%)
Housing units in structures - Mobile home (%)
Housing units in structures - Boat, RV, van, etc. (%)
Housing units in structures - Owners - 1, detached (%)
Housing units in structures - Owners - 1, attached (%)
Housing units in structures - Owners - 2 (%)
Housing units in structures - Owners - 3 or 4 (%)
Housing units in structures - Owners - 5 to 9 (%)
Housing units in structures - Owners - 10 to 19 (%)
Housing units in structures - Owners - 20 to 49 (%)
Housing units in structures - Owners - 50 or more (%)
Housing units in structures - Owners - Mobile home (%)
Housing units in structures - Owners - Boat, RV, van, etc. (%)
Housing units in structures - Renters - 1, detached (%)
Housing units in structures - Renters - 1, attached (%)
Housing units in structures - Renters - 2 (%)
Housing units in structures - Renters - 3 or 4 (%)
Housing units in structures - Renters - 5 to 9 (%)
Housing units in structures - Renters - 10 to 19 (%)
Housing units in structures - Renters - 20 to 49 (%)
Housing units in structures - Renters - 50 or more (%)
Housing units in structures - Renters - Mobile home (%)
Housing units in structures - Renters - Boat, RV, van, etc. (%)
House/condo owner moved in on average (years ago)
Renter moved in on average (years ago)
Year householder moved into unit - Moved in 1999 to March 2000 (%)
Year householder moved into unit - Moved in 1999 to March 2000 (%) - White
Year householder moved into unit - Moved in 1999 to March 2000 (%) - Black or African American
Year householder moved into unit - Moved in 1999 to March 2000 (%) - Asian
Year householder moved into unit - Moved in 1999 to March 2000 (%) - Hispanic or Latino
Year householder moved into unit - Moved in 1999 to March 2000 (%) - American Indian and Alaska Native
Year householder moved into unit - Moved in 1999 to March 2000 (%) - Multirace
Year householder moved into unit - Moved in 1999 to March 2000 (%) - Other Race
Year householder moved into unit - Moved in 1995 to 1998 (%)
Year householder moved into unit - Moved in 1995 to 1998 (%) - White
Year householder moved into unit - Moved in 1995 to 1998 (%) - Black or African American
Year householder moved into unit - Moved in 1995 to 1998 (%) - Asian
Year householder moved into unit - Moved in 1995 to 1998 (%) - Hispanic or Latino
Year householder moved into unit - Moved in 1995 to 1998 (%) - American Indian and Alaska Native
Year householder moved into unit - Moved in 1995 to 1998 (%) - Multirace
Year householder moved into unit - Moved in 1995 to 1998 (%) - Other Race
Year householder moved into unit - Moved in 1990 to 1994 (%)
Year householder moved into unit - Moved in 1990 to 1994 (%) - White
Year householder moved into unit - Moved in 1990 to 1994 (%) - Black or African American
Year householder moved into unit - Moved in 1990 to 1994 (%) - Asian
Year householder moved into unit - Moved in 1990 to 1994 (%) - Hispanic or Latino
Year householder moved into unit - Moved in 1990 to 1994 (%) - American Indian and Alaska Native
Year householder moved into unit - Moved in 1990 to 1994 (%) - Multirace
Year householder moved into unit - Moved in 1990 to 1994 (%) - Other Race
Year householder moved into unit - Moved in 1980 to 1989 (%)
Year householder moved into unit - Moved in 1980 to 1989 (%) - White
Year householder moved into unit - Moved in 1980 to 1989 (%) - Black or African American
Year householder moved into unit - Moved in 1980 to 1989 (%) - Asian
Year householder moved into unit - Moved in 1980 to 1989 (%) - Hispanic or Latino
Year householder moved into unit - Moved in 1980 to 1989 (%) - American Indian and Alaska Native
Year householder moved into unit - Moved in 1980 to 1989 (%) - Multirace
Year householder moved into unit - Moved in 1980 to 1989 (%) - Other Race
Year householder moved into unit - Moved in 1970 to 1979 (%)
Year householder moved into unit - Moved in 1970 to 1979 (%) - White
Year householder moved into unit - Moved in 1970 to 1979 (%) - Black or African American
Year householder moved into unit - Moved in 1970 to 1979 (%) - Asian
Year householder moved into unit - Moved in 1970 to 1979 (%) - Hispanic or Latino
Year householder moved into unit - Moved in 1970 to 1979 (%) - American Indian and Alaska Native
Year householder moved into unit - Moved in 1970 to 1979 (%) - Multirace
Year householder moved into unit - Moved in 1970 to 1979 (%) - Other Race
Year householder moved into unit - Moved in 1969 or earlier (%)
Year householder moved into unit - Moved in 1969 or earlier (%) - White
Year householder moved into unit - Moved in 1969 or earlier (%) - Black or African American
Year householder moved into unit - Moved in 1969 or earlier (%) - Asian
Year householder moved into unit - Moved in 1969 or earlier (%) - Hispanic or Latino
Year householder moved into unit - Moved in 1969 or earlier (%) - American Indian and Alaska Native
Year householder moved into unit - Moved in 1969 or earlier (%) - Multirace
Year householder moved into unit - Moved in 1969 or earlier (%) - Other Race
Housing units lacking complete plumbing facilities (%)
Housing units lacking complete kitchen facilities (%)
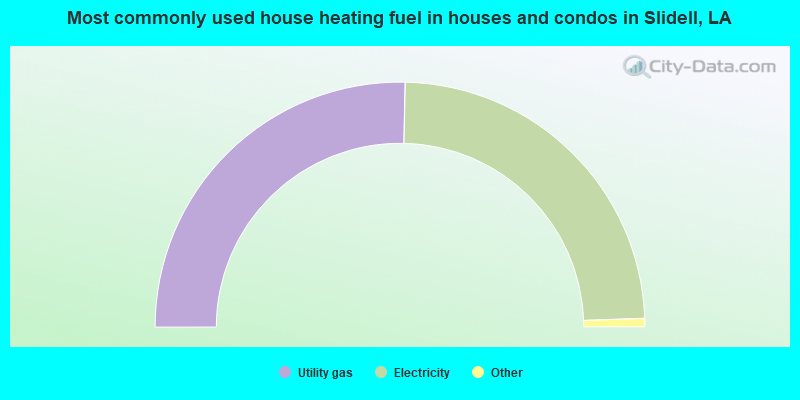
House heating fuel used in houses and condos - Utility gas (%)
House heating fuel used in houses and condos - Bottled, tank, or LP gas (%)
House heating fuel used in houses and condos - Electricity (%)
House heating fuel used in houses and condos - Fuel oil, kerosene, etc. (%)
House heating fuel used in houses and condos - Coal or coke (%)
House heating fuel used in houses and condos - Wood (%)
House heating fuel used in houses and condos - Solar energy (%)
House heating fuel used in houses and condos - Other fuel (%)
House heating fuel used in houses and condos - No fuel used (%)
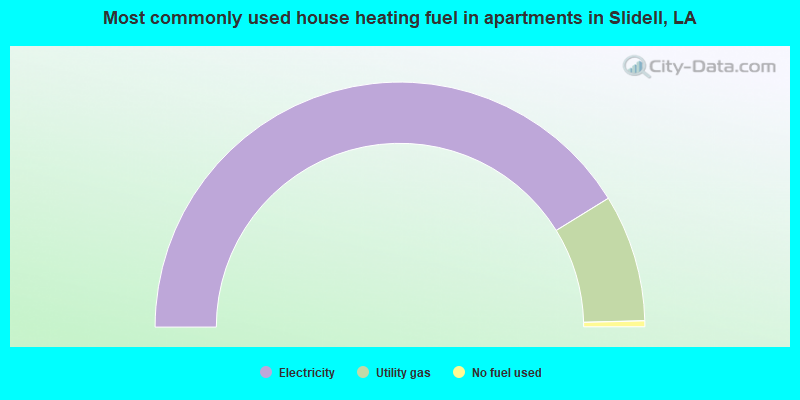
House heating fuel used in apartments - Utility gas (%)
House heating fuel used in apartments - Bottled, tank, or LP gas (%)
House heating fuel used in apartments - Electricity (%)
House heating fuel used in apartments - Fuel oil, kerosene, etc. (%)
House heating fuel used in apartments - Coal or coke (%)
House heating fuel used in apartments - Wood (%)
House heating fuel used in apartments - Solar energy (%)
House heating fuel used in apartments - Other fuel (%)
House heating fuel used in apartments - No fuel used (%)
Latest news about housing in Slidell, LA collected exclusively by city-data.com from local newspapers, TV, and radio stations
Median year house/condo built: 1977Median year apartment built: 1990Household type by relationship:
Households: 29,454
Male householders: 4,477 (1,081 living alone ), Female householders: 6,570 (2,099 living alone )5,019 spouses (4,923 opposite-sex spouses ), 1,024 unmarried partners , (1,018 opposite-sex unmarried partners ), 8,843 children (8,025 natural , 371 adopted , 446 stepchildren ), 848 grandchildren , 337 brothers or sisters , 553 parents , 0 foster children , 337 other relatives , 1,037 non-relatives In group quarters: 404
Size of family households: 3,358 2-persons , 1,474 3-persons , 1,543 4-persons , 511 5-persons , 261 6-persons , 106 7-or-more-persons .
Size of nonfamily households: 3,439 1-person , 463 2-persons , 162 3-persons , 21 6-persons .
3,188 married couples with children. single-parent households (1,165 men , 2,007 women ).
93.9% of residents of Slidell speak English at home. of residents speak Spanish at home (79% speak English very well , 9% speak English well , 10% speak English not well , 2% don't speak English at all ).of residents speak other Indo-European language at home (70% speak English very well , 15% speak English well , 15% speak English not well ).of residents speak Asian or Pacific Island language at home (74% speak English very well , 14% speak English well , 12% speak English not well , 1% don't speak English at all ).
Foreign born population: 963 (3.3%)of them are naturalized citizens )
Median number of rooms in houses and condos:
Median number of rooms in apartments
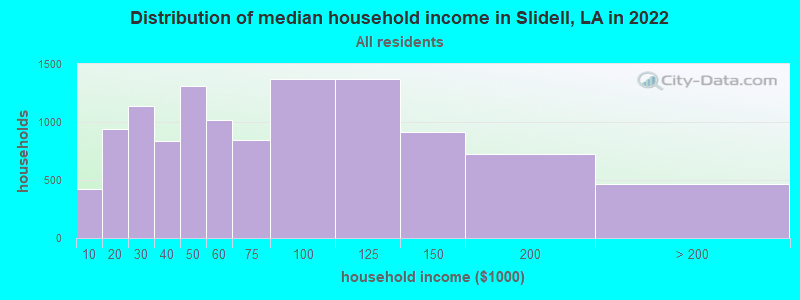
Slidell, LA household income distribution 426 Less than $10,000939 $10,000 to $19,9991,138 $20,000 to $29,999836 $30,000 to $39,9991,308 $40,000 to $49,9991,016 $50,000 to $59,999841 $60,000 to $74,9991,370 $75,000 to $99,9991,371 $100,000 to $124,999917 $125,000 to $149,999727 $150,000 to $199,999463 $200,000 or more
Home value of owner - occupied houses in 2022 in Slidell, LA 8 Less than $10,00051 $10,000 to $14,99953 $15,000 to $19,99931 $20,000 to $24,99935 $25,000 to $29,99974 $30,000 to $34,99912 $40,000 to $49,99911 $50,000 to $59,99976 $60,000 to $69,99934 $70,000 to $79,99932 $80,000 to $89,99964 $90,000 to $99,999275 $100,000 to $124,999883 $125,000 to $149,9991,107 $150,000 to $174,9991,005 $175,000 to $199,9991,937 $200,000 to $249,999800 $250,000 to $299,999624 $300,000 to $399,99965 $400,000 to $499,9996 $500,000 to $749,99949 $750,000 to $999,99911 $2,000,000 or moreRent paid by renters in 2022 in Slidell, LA 29 Less than $10037 $150 to $19970 $200 to $24918 $250 to $29982 $300 to $34994 $350 to $39918 $400 to $449160 $450 to $49957 $500 to $54919 $550 to $59957 $600 to $64949 $650 to $699106 $700 to $74929 $750 to $799146 $800 to $899477 $900 to $999550 $1,000 to $1,249661 $1,250 to $1,499376 $1,500 to $1,99952 $2,000 to $2,49953 $3,500 or more104 No cash rent
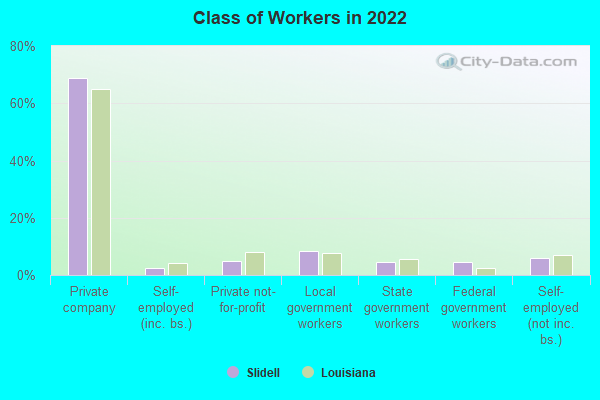
Percentage of workers working in this county: 66.9%Number of people working at home: 1,852 (14.2% of all workers )
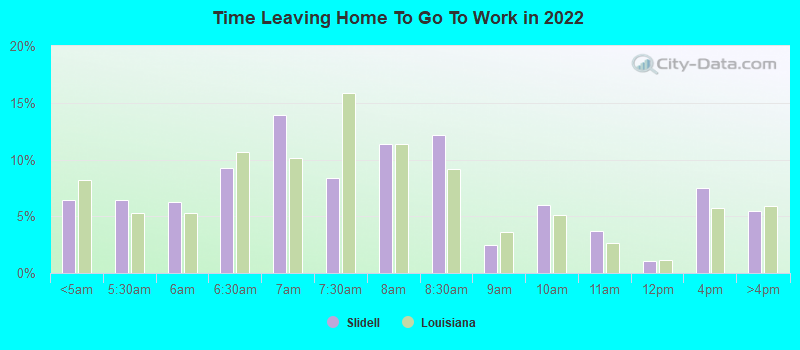
Travel time to work (commute)
Less than 5 minutes: 3745 to 9 minutes: 1,67510 to 14 minutes: 1,73415 to 19 minutes: 1,31520 to 24 minutes: 92725 to 29 minutes: 60530 to 34 minutes: 1,03335 to 39 minutes: 47340 to 44 minutes: 86845 to 59 minutes: 1,15360 to 89 minutes: 1,00790 or more minutes: 361
Means of transportation to work:
Drove a car alone: 15,459 (76.0%)Carpooled: 2,567 (12.6%)Bus : 4 (0.0%)Taxi: 281 (1.4%)Bicycle: 34 (0.2%)Walked: 196 (1.0%)Worked at home: 1,852 (9.1%)
Unemployment by race in 2022
Unemployment rate for White non-Hispanic residents 4.7% Males4.3% FemalesUnemployment rate for Black residents 6.9% Males13.2% FemalesUnemployment rate for American Indian and Alaska Native residents 4.8% Males17.3% FemalesUnemployment rate for Asian residents 17.0% MalesUnemployment rate for two or more race residents 0.5% MalesUnemployment rate for Hispanic or Latino residents 2.0% Females
Year of entry for the foreign-born population in Slidell, Louisiana
340 2010 or later 280 2000 to 2009 95 1990 to 1999 92 1980 to 1989 97 1970 to 1979 232 Before 1970
First ancestries reported:
American: 3,363 (24.0%)
French: 1,312 (9.4%)
Italian: 920 (6.6%)
English: 829 (5.9%)
Irish: 779 (5.6%)
German: 562 (4.0%)
Ukrainian: 223 (1.6%)
Belizean: 135 (1.0%)
Portuguese: 80 (0.6%)
Welsh: 78 (0.6%)
Scottish: 76 (0.5%)
European: 65 (0.5%)
Swiss: 65 (0.5%)
Polish: 60 (0.4%)
Haitian: 59 (0.4%)
Norwegian: 51 (0.4%)
French Canadian: 50 (0.4%)
Scotch-Irish: 48 (0.3%)
Dutch: 46 (0.3%)
Eastern European: 30 (0.2%)
Slovak: 27 (0.2%)
Lithuanian: 23 (0.2%)
Lebanese: 22 (0.2%)
Greek: 22 (0.2%)
Brazilian: 20 (0.1%)
Canadian: 20 (0.1%)
Ghanaian: 15 (0.1%)
Jordanian: 12 (0.09%)
Iranian: 12 (0.09%)
West Indian: 10 (0.07%)
African: 8 (0.06%)
British: 7 (0.05%)
Cajun: 7 (0.05%)
Danish: 5 (0.04%)
Jamaican: 1 (0.01%) Most common places of birth for foreign-born residents (%): Vietnam Slidell:
16.7% (194)Louisiana:
9.2% (18,115)
Honduras Slidell:
9.0% (104)Louisiana:
18.9% (37,225)
Italy Slidell:
8.9% (103)Louisiana:
0.5% (905)
Mexico Slidell:
8.0% (93)Louisiana:
12.1% (23,732)
Pakistan Slidell:
7.5% (87)Louisiana:
1.2% (2,282)
Ukraine Slidell:
7.4% (86)Louisiana:
0.4% (720)
Germany Slidell:
6.7% (78)Louisiana:
1.6% (3,186)
Philippines Slidell:
5.7% (66)Louisiana:
3.1% (6,086)
Belize Slidell:
5.5% (64)Louisiana:
0.4% (864)
Guatemala Slidell:
3.8% (44)Louisiana:
2.8% (5,576)
Laos Slidell:
3.6% (42)Louisiana:
0.6% (1,184)
Netherlands Slidell:
3.0% (35)Louisiana:
0.3% (632)
Ethiopia Slidell:
2.1% (24)Louisiana:
0.5% (892)
Nicaragua Slidell:
1.6% (19)Louisiana:
2.1% (4,115)
Colombia Slidell:
1.6% (18)Louisiana:
1.0% (1,918)
Place of birth for U.S.-born residents:
This state: 20,157Other state: 7,908Northeast: 962Midwest: 1,220South: 4,759West: 942 86.2% of Slidell residents lived in the same house 1 years ago.
Out of people who lived in different houses, 33.9% lived in this county.
Out of people who lived in different counties, 33.4% lived in Louisiana.
Slidell:
86.2%State average:
88.3%
Education attainment for males 25 years and older:
No schooling: 98Nursery to 4th grade: 1235th and 6th grade: 467th and 8th grade: 659th grade: 10110th grade: 4411th grade: 10512th grade, no diploma: 242High school graduate (or equivalency): 2,479Less than 1 year of college: 844Some college more than 1 year, no degree: 2,040Associate degree: 498Bachelor's degree: 1,956Master's degree: 517Professional school degree: 51Doctorate degree: 82
Education attainment for females 25 years and older:
No schooling: 32Nursery to 4th grade: 1235th and 6th grade: 87th and 8th grade: 2499th grade: 51810th grade: 11711th grade: 21812th grade, no diploma: 126High school graduate (or equivalency): 2,483Less than 1 year of college: 1,065Some college more than 1 year, no degree: 2,035Associate degree: 959Bachelor's degree: 1,928Master's degree: 1,035Professional school degree: 38Doctorate degree: 122
Housing units in structures:
One, detached: 9,287One, attached: 397Two: 3153 or 4: 3595 to 9: 19610 to 19: 80320 to 49: 42950 or more: 265Mobile homes: 87Median worth of mobile homes: $156,571
Housing units lacking complete plumbing facilities in 2022: 0.2%Housing units lacking complete kitchen facilities in 2022: 0.9%House/condo owner moved in on average 12 years ago
Renter moved in on average 4 years ago
Private vs. public school enrollment:
Students in private schools in grades 1 to 8 (elementary and middle school): 318 Students in private schools in grades 9 to 12 (high school): 87 Students in private undergraduate colleges: 124 Here:
14.1%Louisiana:
17.4%