Sneads Ferry, NC (North Carolina) Houses and Residents
| Sneads Ferry: | $226,345 |
| North Carolina: | $280,600 |
Mean price in 2022:
Detached houses: $272,984
Here: $272,984 State: $375,326 Townhouses or other attached units: $248,015
Here: $248,015 State: $317,935 Mobile homes: $157,972
Here: $157,972 State: $124,933
Total population: 2,646 (Urban population: 0, Rural population: 2,152 (22 farm, 2,130 nonfarm))
Houses: 1,773 (1,116 occupied: 889 owner occupied, 262 renter occupied)
| % of renters here: | 23% |
| State: | 33% |
Housing density: 472 houses/condos per square mile
Median price asked for vacant for-sale houses and condos in 2022 in this county: $238,743.
Median contract rent in 2022: $917 (lower quartile is $617, upper quartile is $1,311)
Median rent asked for vacant for-rent units in 2022: $761
Median gross rent in Sneads Ferry, NC in 2022: $1,016
Housing units in Sneads Ferry with a mortgage: 538 (93 second mortgage, 56 home equity loan, 20 both second mortgage and home equity loan)
Houses without a mortgage: 0
Median household income for apartments without a mortgage: $31,424
Median monthly housing costs: $815
Compare current foreclosures near Sneads Ferry, NC:
| Photo | Address | Area | Beds / Baths | Price | Details |
|---|---|---|---|---|---|

|
#1
Old Folkstone Rd
Sneads Ferry, NC 28460
|
1,152 sq. feet
|
2 baths 3 beds |
show details | |

|
#2
Fulcher Landing Rd
Sneads Ferry, NC 28460
|
2,114 sq. feet
|
2 baths 3 beds |
show details | |

|
#3
Shellbank Dr
Sneads Ferry, NC 28460
|
2,525 sq. feet
|
2 baths 3 beds |
show details | |

|
#4
Peru Rd
Sneads Ferry, NC 28460
|
1,712 sq. feet
|
2 baths 3 beds |
show details | |

|
#5
Zion Ln
Sneads Ferry, NC 28460
|
1,782 sq. feet
|
2 baths 4 beds |
show details | |

|
#6
Chadwick Shores Dr
Sneads Ferry, NC 28460
|
- sq. feet
|
- baths - beds |
show details | |

|
#7
High Ridge Ct
Sneads Ferry, NC 28460
|
- sq. feet
|
- baths - beds |
show details | |

|
#8
Needlerush Rd
Sneads Ferry, NC 28460
|
- sq. feet
|
- baths - beds |
show details | |

|
#9
Lake Haven Dr
Sneads Ferry, NC 28460
|
- sq. feet
|
- baths - beds |
show details | |

|
#10
Bald Cypress Ln
Sneads Ferry, NC 28460
|
- sq. feet
|
- baths - beds |
show details |
| Photo | Address | Area | Beds / Baths | Price | Details |
|---|---|---|---|---|---|

|
#11
Marsh Haven Dr
Sneads Ferry, NC 28460
|
- sq. feet
|
- baths - beds |
show details | |

|
#12
Seabird Ln
Sneads Ferry, NC 28460
|
- sq. feet
|
- baths - beds |
show details | |

|
#13
Citation Ln
Sneads Ferry, NC 28460
|
- sq. feet
|
- baths - beds |
show details | |

|
#14
Marina Wynd Way
Sneads Ferry, NC 28460
|
- sq. feet
|
- baths - beds |
show details | |

|
#15
Chadwick Acres Rd
Sneads Ferry, NC 28460
|
- sq. feet
|
- baths - beds |
show details | |

|
#16
E Dolphin Vw
Sneads Ferry, NC 28460
|
- sq. feet
|
- baths - beds |
show details | |

|
#17
Waters Rd
Jacksonville, NC 28546
|
1,296 sq. feet
|
3 baths 4 beds |
show details | |

|
#18
Wood Bridge Rd
Hampstead, NC 28443
|
2,280 sq. feet
|
3 baths 4 beds |
show details | |

|
#19
Harbord Dr
Midway Park, NC 28544
|
1,550 sq. feet
|
2 baths 3 beds |
show details | |

|
#20
Maplehurst Dr
Jacksonville, NC 28540
|
2,070 sq. feet
|
2 baths 3 beds |
show details |
| Photo | Address | Area | Beds / Baths | Price | Details |
|---|---|---|---|---|---|

|
#21
Walnut Dr
Jacksonville, NC 28540
|
1,040 sq. feet
|
2 baths 3 beds |
show details | |

|
#22
Clearview Dr
Holly Ridge, NC 28445
|
1,728 sq. feet
|
2 baths 3 beds |
show details | |

|
#23
Avon Dr
Hubert, NC 28539
|
2,872 sq. feet
|
3 baths 3 beds |
show details | |

|
#24
Woodleaf Ln
Jacksonville, NC 28540
|
1,296 sq. feet
|
2 baths 3 beds |
show details | |

|
#25
Broadleaf Dr
Jacksonville, NC 28546
|
1,638 sq. feet
|
2 baths 3 beds |
show details | |

|
#26
Bay Harbor Dr
Hampstead, NC 28443
|
1,176 sq. feet
|
2 baths 3 beds |
show details | |

|
#27
Bay Harbor Dr
Hampstead, NC 28443
|
1,924 sq. feet
|
2 baths 3 beds |
show details | |

|
#28
Regalwood Dr
Jacksonville, NC 28546
|
1,440 sq. feet
|
1 baths 4 beds |
show details | |

|
#29
Sanders Dr
Hubert, NC 28539
|
2,951 sq. feet
|
2 baths 4 beds |
show details | |

|
#30
Meadowland Cir
Maple Hill, NC 28454
|
2,123 sq. feet
|
3 baths 4 beds |
show details |
| Photo | Address | Area | Beds / Baths | Price | Details |
|---|---|---|---|---|---|

|
#31
Decatur Rd
Jacksonville, NC 28540
|
1,678 sq. feet
|
1 baths 3 beds |
show details | |

|
#32
Shadowridge Rd
Jacksonville, NC 28546
|
1,160 sq. feet
|
1 baths 3 beds |
show details | |

|
#33
Bordeaux St
Jacksonville, NC 28540
|
800 sq. feet
|
1 baths 2 beds |
show details | |

|
#34
Long Acre Dr
Jacksonville, NC 28546
|
1,578 sq. feet
|
2 baths 3 beds |
show details | |

|
#35
Cobalt Stream Ct
Jacksonville, NC 28546
|
1,526 sq. feet
|
2 baths 3 beds |
show details | |

|
#36
Providence Dr
Jacksonville, NC 28546
|
1,816 sq. feet
|
2 baths 3 beds |
show details | |

|
#37
W Thomas Dr
Jacksonville, NC 28546
|
2,001 sq. feet
|
2 baths 3 beds |
show details | |

|
#38
Estate Dr
Jacksonville, NC 28540
|
1,508 sq. feet
|
2 baths 3 beds |
show details | |

|
#39
Pond Dr
Hubert, NC 28539
|
1,524 sq. feet
|
2 baths 3 beds |
show details | |

|
#40
Thomas Dr
Jacksonville, NC 28546
|
2,220 sq. feet
|
2 baths 4 beds |
show details |
| Photo | Address | Area | Beds / Baths | Price | Details |
|---|---|---|---|---|---|

|
#41
Forest Grove Ave
Jacksonville, NC 28540
|
1,323 sq. feet
|
2 baths 2 beds |
show details | |

|
#42
Barn St
Jacksonville, NC 28540
|
1,150 sq. feet
|
1 baths 3 beds |
show details | |

|
#43
E Ivybridge Dr
Hubert, NC 28539
|
1,519 sq. feet
|
2 baths 3 beds |
show details | |

|
#44
Crooked Creek Rd
Jacksonville, NC 28540
|
2,360 sq. feet
|
2 baths 5 beds |
show details | |

|
#45
N Burning Tree Dr
Hampstead, NC 28443
|
1,792 sq. feet
|
2 baths 3 beds |
show details | |

|
#46
Balsam Rd
Jacksonville, NC 28546
|
1,080 sq. feet
|
1 baths 3 beds |
show details | |

|
#47
Duke Ct
Jacksonville, NC 28546
|
1,612 sq. feet
|
1 baths 3 beds |
show details | |

|
#48
Riggs Rd
Hubert, NC 28539
|
1,326 sq. feet
|
2 baths 3 beds |
show details | |

|
#49
Winners Cir S
Jacksonville, NC 28546
|
1,152 sq. feet
|
2 baths 2 beds |
show details | |

|
Check over 1 million property listings on Foreclosure.com!
|
browse all offers | |||


 | Summerhouse on Everett Bay Model Homes - Holly Ridge (16 replies) |
| Coastal New England vs. Southeast Coastal House's (8 replies) |
| Where to look for a home best for ex-farm dogs (10 replies) |
| Moving to Sneads Ferry (9 replies) |
| Moving home and residential rental business to Jacksonville NC area (3 replies) |
| Clothing & Household Charity in Sneads Ferry (2 replies) |

Median year apartment built: 1991
Household type by relationship:
Households: 2,177- Male householders: 612 (215 living alone), Female householders: 484 (271 living alone)
552 spouses (552 opposite-sex spouses), 34 unmarried partners, (34 opposite-sex unmarried partners), 436 children (419 natural, 10 adopted, 7 stepchildren), 27 grandchildren, 9 brothers or sisters, 14 parents, 0 foster children, 6 other relatives, 0 non-relatives
Size of family households: 382 2-persons, 72 3-persons, 166 4-persons, 1 6-persons.
Size of nonfamily households: 540 1-person, 29 2-persons.
352 married couples with children.
52 single-parent households (0 men, 52 women).
91.0% of residents of Sneads Ferry speak English at home.
2.5% of residents speak Spanish at home (100% speak English very well).
6.5% of residents speak other Indo-European language at home (100% speak English very well).
0.2% of residents speak Asian or Pacific Island language at home (100% speak English well).
Foreign born population: 149 (6.8%)
(43.6% of them are naturalized citizens)
| Here: | 5.8 |
| State: | 6.4 |
| Here: | 4.4 |
| State: | 4.4 |

- Bedrooms in owner-occupied houses and condos in Sneads Ferry, North Carolina
- 0no bedroom
- 171 bedroom
- 2732 bedrooms
- 4563 bedrooms
- 1294 bedrooms
- 145+ bedrooms

- Bedrooms in renter-occupied apartments in Sneads Ferry, North Carolina
- 0no bedroom
- 811 bedroom
- 502 bedrooms
- 1313 bedrooms
- 04 bedrooms
- 05+ bedrooms

- Cars and other vehicles available in Sneads Ferry in owner-occupied houses/condos
- 0no vehicle
- 3001 vehicle
- 2632 vehicles
- 2423 vehicles
- 194 vehicles
- 655+ vehicles

- Cars and other vehicles available in Sneads Ferry in renter-occupied apartments
- 0no vehicle
- 961 vehicle
- 972 vehicles
- 693 vehicles
- 04 vehicles
- 05+ vehicles

- Rooms in owner-occupied houses in Sneads Ferry, North Carolina
- 01 room
- 02 rooms
- 363 rooms
- 1114 rooms
- 2505 rooms
- 1786 rooms
- 1647 rooms
- 498 rooms
- 1009+ rooms

- Rooms in renter-occupied apartments in Sneads Ferry, North Carolina
- 01 room
- 02 rooms
- 813 rooms
- 194 rooms
- 1445 rooms
- 156 rooms
- 07 rooms
- 38 rooms
- 09+ rooms


Sneads Ferry, NC household income distribution

- 140Less than $10,000
- 155$10,000 to $19,999
- 229$20,000 to $29,999
- 17$30,000 to $39,999
- 97$40,000 to $49,999
- 45$50,000 to $59,999
- 58$60,000 to $74,999
- 237$75,000 to $99,999
- 44$100,000 to $124,999
- 12$125,000 to $149,999
- 64$150,000 to $199,999
- 34$200,000 or more

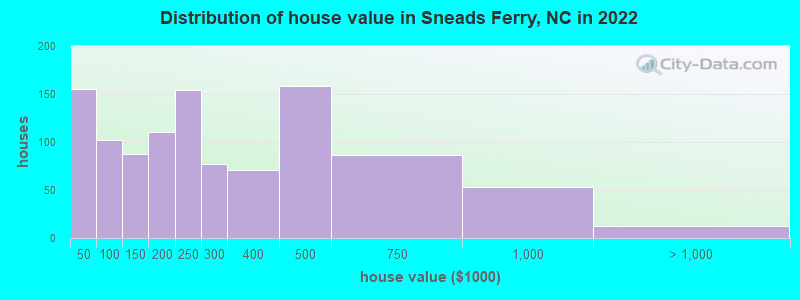
Home value of owner - occupied houses in 2022 in Sneads Ferry, NC
-
- 88Less than $10,000
- 14$10,000 to $14,999
- 7$20,000 to $24,999
- 44$40,000 to $49,999
- 8$50,000 to $59,999
- 28$60,000 to $69,999
- 13$70,000 to $79,999
- 8$90,000 to $99,999
- 9$100,000 to $124,999
- 78$125,000 to $149,999
- 110$175,000 to $199,999
- 153$200,000 to $249,999
- 76$250,000 to $299,999
- 71$300,000 to $399,999
- 158$400,000 to $499,999
- 85$500,000 to $749,999
- 52$750,000 to $999,999
- 13$1,500,000 to $1,999,999
Rent paid by renters in 2022 in Sneads Ferry, NC
-
- 3$450 to $499
- 14$550 to $599
- 46$600 to $649
- 15$700 to $749
- 20$800 to $899
- 40$900 to $999
- 60$1,250 to $1,499
- 1$2,000 to $2,499
- 4No cash rent

Percentage of workers working in this county: 92.5%
Number of people working at home: 113 (11.0% of all workers)
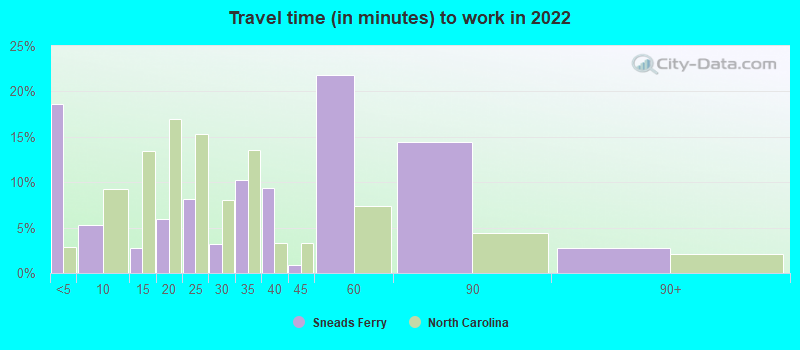
Travel time to work (commute)
- Less than 5 minutes: 0
- 5 to 9 minutes: 130
- 10 to 14 minutes: 270
- 15 to 19 minutes: 99
- 20 to 24 minutes: 102
- 25 to 29 minutes: 16
- 30 to 34 minutes: 193
- 35 to 39 minutes: 2
- 40 to 44 minutes: 18
- 45 to 59 minutes: 2
- 60 to 89 minutes: 22
- 90 or more minutes: 91
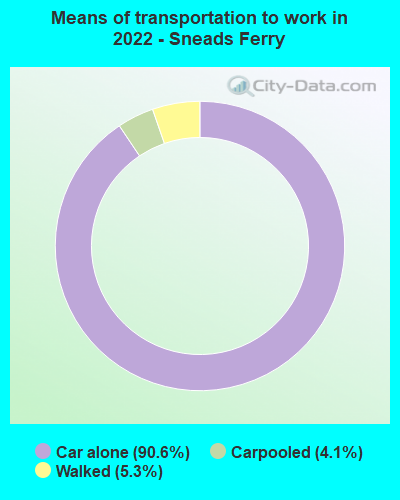
Means of transportation to work:
- Drove a car alone: 943 (84.0%)
- Carpooled: 38 (3.4%)
- Walked: 50 (4.5%)

- Year of entry for the foreign-born population in Sneads Ferry, North Carolina
- 882010 or later
- 02000 to 2009
- 01990 to 1999
- 101980 to 1989
- 81970 to 1979
- 31Before 1970

First ancestries reported:
- Irish: 253 (27.3%)
- American: 115 (12.4%)
- German: 95 (10.2%)
- English: 87 (9.4%)
- Scotch-Irish: 53 (5.7%)
- Portuguese: 51 (5.5%)
- Norwegian: 34 (3.7%)
- Scottish: 30 (3.2%)
- Welsh: 27 (2.9%)
- Czechoslovakian: 24 (2.6%)
- French Canadian: 16 (1.7%)
- Italian: 8 (0.9%)
Most common places of birth for foreign-born residents (%):
| Sneads Ferry: | 70.0% (98) |
| North Carolina: | 1.8% (15,534) |
| Sneads Ferry: | 25.7% (36) |
| North Carolina: | 9.3% (80,594) |
| Sneads Ferry: | 5.7% (8) |
| North Carolina: | 0.0% (169) |
Place of birth for U.S.-born residents:
- This state: 1,042
- Other state: 1,006
- Northeast: 518
- Midwest: 159
- South: 236
- West: 86
93.0% of Sneads Ferry residents lived in the same house 1 years ago.
Out of people who lived in different houses, 18.9% lived in this county.
Out of people who lived in different counties, 21.7% lived in North Carolina.
| Sneads Ferry: | 93.0% |
| State average: | 87.3% |
Education attainment for males 25 years and older:
- No schooling: 0
- Nursery to 4th grade: 0
- 5th and 6th grade: 13
- 7th and 8th grade: 69
- 9th grade: 0
- 10th grade: 0
- 11th grade: 0
- 12th grade, no diploma: 14
- High school graduate (or equivalency): 264
- Less than 1 year of college: 24
- Some college more than 1 year, no degree: 199
- Associate degree: 46
- Bachelor's degree: 60
- Master's degree: 24
- Professional school degree: 0
- Doctorate degree: 0

Education attainment for females 25 years and older:
- No schooling: 0
- Nursery to 4th grade: 0
- 5th and 6th grade: 0
- 7th and 8th grade: 0
- 9th grade: 0
- 10th grade: 12
- 11th grade: 25
- 12th grade, no diploma: 24
- High school graduate (or equivalency): 254
- Less than 1 year of college: 11
- Some college more than 1 year, no degree: 144
- Associate degree: 232
- Bachelor's degree: 117
- Master's degree: 38
- Professional school degree: 0
- Doctorate degree: 5


Housing units in structures:
- One, detached: 1,211
- One, attached: 129
- 3 or 4: 18
- 5 to 9: 33
- Mobile homes: 364
- Boats, RVs, vans, etc.: 16
House/condo owner moved in on average 15 years ago
Renter moved in on average 6 years ago

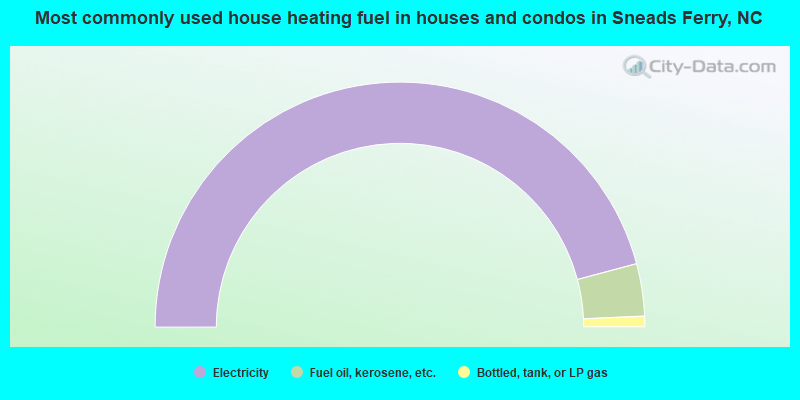
- 91.7%Electricity
- 6.9%Fuel oil, kerosene, etc.
- 1.4%Bottled, tank, or LP gas
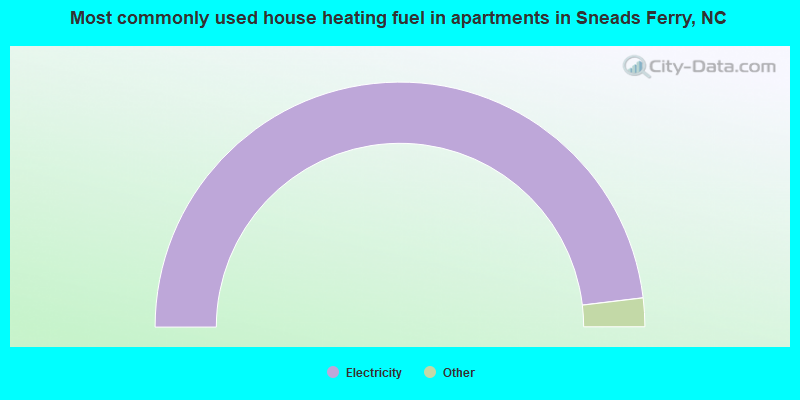
- 96.3%Electricity
- 2.4%No fuel used
- 1.2%Utility gas
Private vs. public school enrollment:
| Here: | 20.8% |
| North Carolina: | 13.8% |
| Here: | 0.0% |
| North Carolina: | 11.9% |
| Here: | 0.0% |
| North Carolina: | 19.3% |


