Sneedville, TN (Tennessee) Houses and Residents
| Sneedville: | $100,987 |
| Tennessee: | $284,800 |
Mean price in 2022:
Detached houses: $138,931
Here: $138,931 State: $374,382 Mobile homes: $38,388
Here: $38,388 State: $101,421
Total population: 1,361 (Urban population: 0, Rural population: 1,259 (4 farm, 1,255 nonfarm))
Houses: 723 (642 occupied: 315 owner occupied, 337 renter occupied)
| % of renters here: | 52% |
| State: | 33% |
Housing density: 317 houses/condos per square mile
Median price asked for vacant for-sale houses and condos in 2022 in this county: $2,533,956.
Median contract rent in 2022: $448 (lower quartile is $209, upper quartile is $858)
Median rent asked for vacant for-rent units in 2022: $457
Median gross rent in Sneedville, TN in 2022: $623
Housing units in Sneedville with a mortgage: 85 (14 second mortgage, 0 home equity loan, 11 both second mortgage and home equity loan)
Houses without a mortgage: 0
Median household income for houses/condos with a mortgage: $87,274
Median household income for apartments without a mortgage: $37,600
Median monthly housing costs: $481
Compare current foreclosures near Sneedville, TN:
| Photo | Address | Area | Beds / Baths | Price | Details |
|---|---|---|---|---|---|

|
#1
Collins St
Sneedville, TN 37869
|
1,223 sq. feet
|
2 baths 3 beds |
show details | |

|
#2
Tom Hill Dr
Sneedville, TN 37869
|
- sq. feet
|
- baths - beds |
show details | |

|
#3
Lone Rd
Sneedville, TN 37869
|
- sq. feet
|
- baths - beds |
show details | |

|
#4
Vardy Blackwater
Sneedville, TN 37869
|
- sq. feet
|
- baths - beds |
show details | |

|
#5
Unicorn Ln
Sneedville, TN 37869
|
- sq. feet
|
- baths - beds |
show details | |

|
#6
W Trent Valley Rd
Sneedville, TN 37869
|
- sq. feet
|
- baths - beds |
show details | |

|
#7
Mckinney Chapel Rd
Rogersville, TN 37857
|
1,596 sq. feet
|
2 baths - beds |
show details | |

|
#8
Mullins Rd
Russellville, TN 37860
|
1,232 sq. feet
|
2 baths - beds |
show details | |

|
#9
Thorn Hill School Rd
Thorn Hill, TN 37881
|
1,736 sq. feet
|
2 baths - beds |
show details | |

|
#10
Ellis St
Bean Station, TN 37708
|
1,820 sq. feet
|
2 baths - beds |
show details |
| Photo | Address | Area | Beds / Baths | Price | Details |
|---|---|---|---|---|---|

|
#11
Tuggle Hill Rd
Rogersville, TN 37857
|
956 sq. feet
|
3 baths - beds |
show details | |

|
#12
E Mckinney Ave
Rogersville, TN 37857
|
1,224 sq. feet
|
2 baths - beds |
show details | |

|
#13
Flora Ferry Rd
Rogersville, TN 37857
|
846 sq. feet
|
1 baths - beds |
show details | |

|
#14
Vista Dr
Rogersville, TN 37857
|
960 sq. feet
|
1 baths - beds |
show details | |

|
#15
Hickory Cove Rd
Rogersville, TN 37857
|
1,680 sq. feet
|
2 baths - beds |
show details | |

|
#16
E Mckinney Ave
Rogersville, TN 37857
|
1,295 sq. feet
|
1 baths - beds |
show details | |

|
#17
W Broadway St
Rogersville, TN 37857
|
1,192 sq. feet
|
1 baths - beds |
show details | |

|
#18
Kirkham Rd
Bean Station, TN 37708
|
1,092 sq. feet
|
1 baths - beds |
show details | |

|
#19
Warren Ln
Bean Station, TN 37708
|
960 sq. feet
|
1 baths - beds |
show details | |

|
#20
Blacktop Dr
Blackwater, VA 24221
|
- sq. feet
|
2 baths 4 beds |
show details |
| Photo | Address | Area | Beds / Baths | Price | Details |
|---|---|---|---|---|---|

|
#21
Cedar Hills Ln
Rogersville, TN 37857
|
1,086 sq. feet
|
1 baths - beds |
show details | |

|
#22
Moores Chapel Rd
Bean Station, TN 37708
|
1,400 sq. feet
|
2 baths - beds |
show details | |

|
#23
Mcneil Cir
Mooresburg, TN 37811
|
1,469 sq. feet
|
1 baths - beds |
show details | |

|
#24
Pressmens Home Rd
Rogersville, TN 37857
|
1,837 sq. feet
|
1 baths - beds |
show details | |

|
#25
Robin Ln
Bean Station, TN 37708
|
- sq. feet
|
- baths - beds |
show details | |

|
#26
C W Ln
Thorn Hill, TN 37881
|
- sq. feet
|
- baths - beds |
show details | |

|
#27
Woodland Ave
Rogersville, TN 37857
|
- sq. feet
|
- baths - beds |
show details | |

|
#28
New Life Rd
Rogersville, TN 37857
|
1,568 sq. feet
|
- baths - beds |
show details | |

|
#29
Clinch Valley Rd
Eidson, TN 37731
|
1,056 sq. feet
|
- baths - beds |
show details | |

|
#30
Klepper Estates Dr
Rogersville, TN 37857
|
2,052 sq. feet
|
- baths - beds |
show details |
| Photo | Address | Area | Beds / Baths | Price | Details |
|---|---|---|---|---|---|

|
#31
Austin Mill Rd
Rogersville, TN 37857
|
- sq. feet
|
- baths - beds |
show details | |

|
#32
Highway 113
Bulls Gap, TN 37711
|
- sq. feet
|
- baths - beds |
show details | |

|
#33
Union Church Rd
Thorn Hill, TN 37881
|
- sq. feet
|
- baths - beds |
show details | |

|
#34
Prices Rd
Surgoinsville, TN 37873
|
- sq. feet
|
- baths - beds |
show details | |

|
#35
Rivershadows Dr
Rogersville, TN 37857
|
1,512 sq. feet
|
- baths - beds |
show details | |

|
#36
E Main St Apt 12
Rogersville, TN 37857
|
- sq. feet
|
- baths - beds |
show details | |

|
#37
James Rd
Rogersville, TN 37857
|
- sq. feet
|
- baths - beds |
show details | |

|
#38
Trent Rd
Bean Station, TN 37708
|
552 sq. feet
|
- baths - beds |
show details | |

|
#39
E Main St Apt 118
Rogersville, TN 37857
|
- sq. feet
|
- baths - beds |
show details | |

|
#40
Harmon Dr
Rogersville, TN 37857
|
- sq. feet
|
- baths - beds |
show details |
| Photo | Address | Area | Beds / Baths | Price | Details |
|---|---|---|---|---|---|

|
#41
Stapleton Ln
Rogersville, TN 37857
|
- sq. feet
|
- baths - beds |
show details | |

|
#42
N Brummitt St
Rogersville, TN 37857
|
960 sq. feet
|
- baths - beds |
show details | |

|
#43
Oak St
Rogersville, TN 37857
|
- sq. feet
|
- baths - beds |
show details | |

|
#44
Livesay Cir
Rogersville, TN 37857
|
- sq. feet
|
- baths - beds |
show details | |

|
#45
N Hawkins St Apt 6
Rogersville, TN 37857
|
- sq. feet
|
- baths - beds |
show details | |

|
#46
Shavers Ford Rd
Jonesville, VA 24263
|
- sq. feet
|
- baths - beds |
show details | |

|
#47
Shephards Chapel Rd
Rogersville, TN 37857
|
- sq. feet
|
- baths - beds |
show details | |

|
Check over 1 million property listings on Foreclosure.com!
|
browse all offers | |||

Latest news about housing in Sneedville, TN collected exclusively by city-data.com from local newspapers, TV, and radio stations

 | Home Rentals/Jobs In Sneedville (4 replies) |
| Need help on locations to move (15 replies) |
| Considering Moving to TN from California (13 replies) |
| Forced Relocation to East TN - Need location/housing help (13 replies) |
| Sneedville - high speed Internet access (9 replies) |
| Granger / Hawkins County Info needed? (25 replies) |

Median year apartment built: 1983
Household type by relationship:
Households: 1,619- Male householders: 322 (85 living alone), Female householders: 311 (99 living alone)
237 spouses (237 opposite-sex spouses), 75 unmarried partners, (25 opposite-sex unmarried partners), 332 children (283 natural, 6 adopted, 42 stepchildren), 43 grandchildren, 29 brothers or sisters, 0 parents, 0 foster children, 58 other relatives, 60 non-relatives
- In group quarters: 148
Size of family households: 155 2-persons, 174 3-persons, 93 4-persons, 23 5-persons, 2 6-persons.
Size of nonfamily households: 188 1-person, 12 2-persons, 3 5-persons.
115 married couples with children.
117 single-parent households (37 men, 80 women).
98.5% of residents of Sneedville speak English at home.
0.6% of residents speak Spanish at home (30% speak English very well, 40% speak English well, 30% speak English not well).
0.4% of residents speak other Indo-European language at home (100% speak English very well).
Foreign born population: 7 (0.4%)
(0.0% of them are naturalized citizens)
| Here: | 5.4 |
| State: | 6.5 |
| Here: | 4.1 |
| State: | 4.4 |

- Bedrooms in owner-occupied houses and condos in Sneedville, Tennessee
- 0no bedroom
- 101 bedroom
- 492 bedrooms
- 2053 bedrooms
- 474 bedrooms
- 45+ bedrooms

- Bedrooms in renter-occupied apartments in Sneedville, Tennessee
- 0no bedroom
- 871 bedroom
- 1192 bedrooms
- 1243 bedrooms
- 84 bedrooms
- 05+ bedrooms

- Cars and other vehicles available in Sneedville in owner-occupied houses/condos
- 5no vehicle
- 771 vehicle
- 1452 vehicles
- 623 vehicles
- 214 vehicles
- 65+ vehicles

- Cars and other vehicles available in Sneedville in renter-occupied apartments
- 99no vehicle
- 1401 vehicle
- 912 vehicles
- 83 vehicles
- 04 vehicles
- 05+ vehicles

- Rooms in owner-occupied houses in Sneedville, Tennessee
- 01 room
- 02 rooms
- 263 rooms
- 274 rooms
- 1175 rooms
- 716 rooms
- 417 rooms
- 198 rooms
- 149+ rooms

- Rooms in renter-occupied apartments in Sneedville, Tennessee
- 01 room
- 202 rooms
- 543 rooms
- 1444 rooms
- 825 rooms
- 376 rooms
- 07 rooms
- 28 rooms
- 09+ rooms


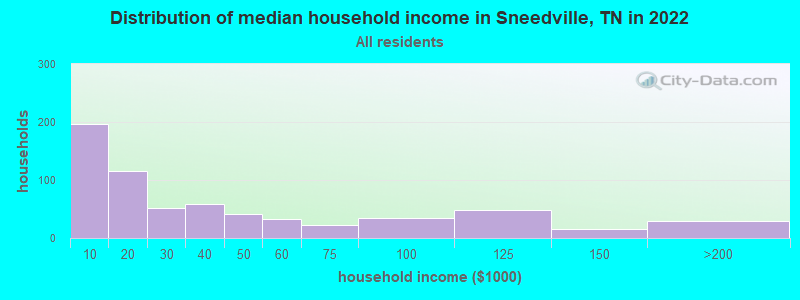
Sneedville, TN household income distribution

- 197Less than $10,000
- 115$10,000 to $19,999
- 51$20,000 to $29,999
- 59$30,000 to $39,999
- 42$40,000 to $49,999
- 33$50,000 to $59,999
- 23$60,000 to $74,999
- 34$75,000 to $99,999
- 49$100,000 to $124,999
- 16$125,000 to $149,999
- 27$150,000 to $199,999
- 2$200,000 or more
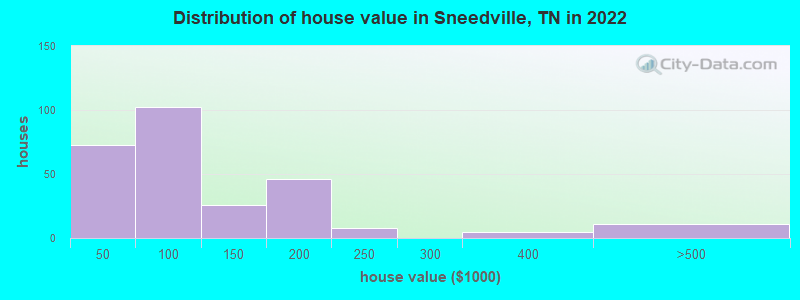
Home value of owner - occupied houses in 2022 in Sneedville, TN
-
- 3Less than $10,000
- 27$10,000 to $14,999
- 3$15,000 to $19,999
- 19$20,000 to $24,999
- 20$40,000 to $49,999
- 32$50,000 to $59,999
- 20$70,000 to $79,999
- 11$80,000 to $89,999
- 15$90,000 to $99,999
- 16$100,000 to $124,999
- 8$125,000 to $149,999
- 26$150,000 to $174,999
- 18$175,000 to $199,999
- 8$200,000 to $249,999
- 5$300,000 to $399,999
- 11$400,000 to $499,999
Rent paid by renters in 2022 in Sneedville, TN
-
- 8Less than $100
- 64$150 to $199
- 15$200 to $249
- 2$250 to $299
- 25$300 to $349
- 14$350 to $399
- 52$400 to $449
- 14$450 to $499
- 10$500 to $549
- 9$550 to $599
- 2$600 to $649
- 19$800 to $899
- 48$900 to $999
- 7$1,000 to $1,249
- 34No cash rent

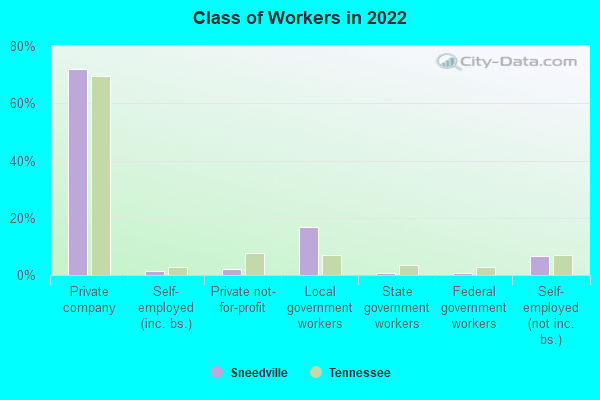
Percentage of workers working in this county: 66.9%
Number of people working at home: 15 (3.5% of all workers)
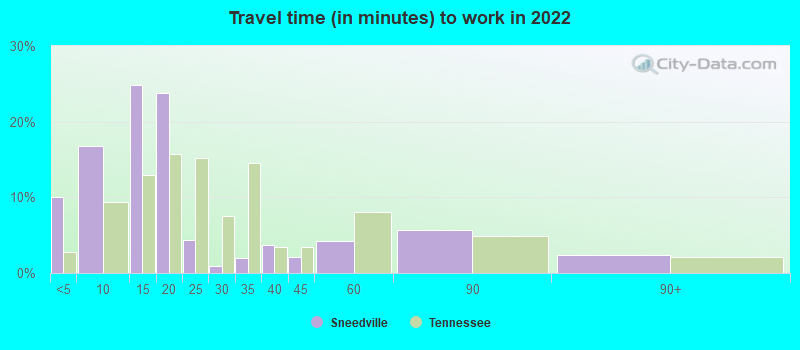
Travel time to work (commute)
- Less than 5 minutes: 114
- 5 to 9 minutes: 92
- 10 to 14 minutes: 44
- 15 to 19 minutes: 9
- 20 to 24 minutes: 9
- 25 to 29 minutes: 0
- 30 to 34 minutes: 2
- 35 to 39 minutes: 22
- 40 to 44 minutes: 10
- 45 to 59 minutes: 34
- 60 to 89 minutes: 55
- 90 or more minutes: 12
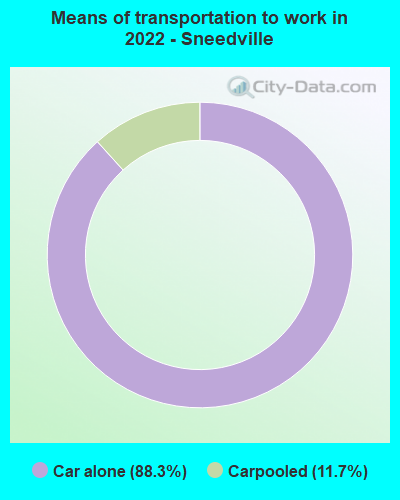
Means of transportation to work:
- Drove a car alone: 930 (83.2%)
- Carpooled: 130 (11.6%)
- Worked at home: 15 (1.3%)
- Unemployment by race in 2022
- Unemployment rate for White non-Hispanic residents
- 6.9%Males
- 12.2%Females

- Year of entry for the foreign-born population in Sneedville, Tennessee
- 42010 or later
- 02000 to 2009
- 41990 to 1999
- 01980 to 1989
- 01970 to 1979
- 4Before 1970
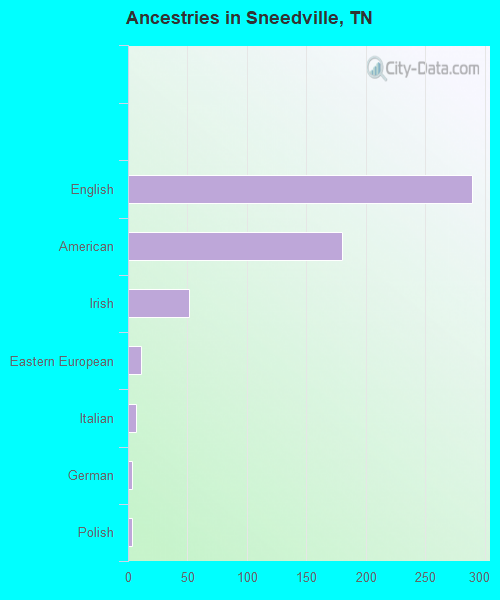
First ancestries reported:
- English: 289 (27.1%)
- American: 180 (16.9%)
- Irish: 51 (4.8%)
- Eastern European: 11 (1.0%)
- Italian: 7 (0.7%)
- German: 3 (0.3%)
- Polish: 3 (0.3%)
Most common places of birth for foreign-born residents (%):
| Sneedville: | 85.7% (6) |
| Tennessee: | 23.0% (86,435) |
Place of birth for U.S.-born residents:
- This state: 1,263
- Other state: 332
- Northeast: 8
- Midwest: 45
- South: 274
- West: 0
87.1% of Sneedville residents lived in the same house 1 years ago.
Out of people who lived in different houses, 38.1% lived in this county.
Out of people who lived in different counties, 93.2% lived in Tennessee.
| Sneedville: | 87.1% |
| State average: | 87.0% |
Education attainment for males 25 years and older:
- No schooling: 0
- Nursery to 4th grade: 3
- 5th and 6th grade: 2
- 7th and 8th grade: 24
- 9th grade: 13
- 10th grade: 13
- 11th grade: 5
- 12th grade, no diploma: 9
- High school graduate (or equivalency): 284
- Less than 1 year of college: 16
- Some college more than 1 year, no degree: 141
- Associate degree: 2
- Bachelor's degree: 32
- Master's degree: 17
- Professional school degree: 0
- Doctorate degree: 0

Education attainment for females 25 years and older:
- No schooling: 2
- Nursery to 4th grade: 8
- 5th and 6th grade: 7
- 7th and 8th grade: 9
- 9th grade: 10
- 10th grade: 7
- 11th grade: 23
- 12th grade, no diploma: 22
- High school graduate (or equivalency): 247
- Less than 1 year of college: 36
- Some college more than 1 year, no degree: 121
- Associate degree: 29
- Bachelor's degree: 8
- Master's degree: 20
- Professional school degree: 0
- Doctorate degree: 0


Housing units in structures:
- One, detached: 374
- One, attached: 12
- Two: 38
- 3 or 4: 93
- 5 to 9: 87
- 10 to 19: 6
- 20 to 49: 3
- Mobile homes: 108
Housing units lacking complete kitchen facilities in 2022: 1.9%
House/condo owner moved in on average 20 years ago
Renter moved in on average 5 years ago

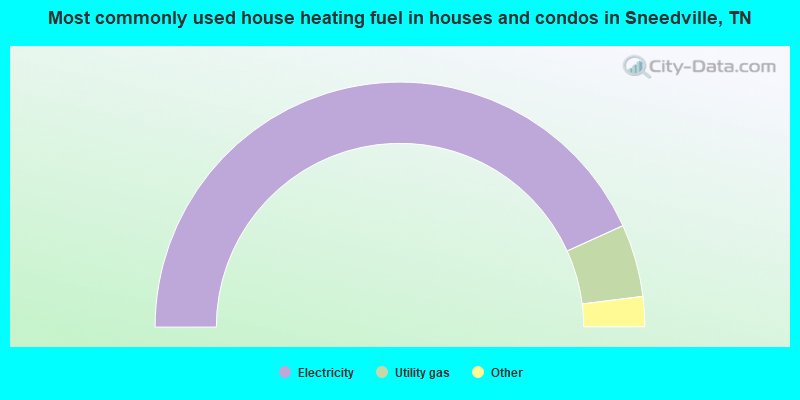
- 86.7%Electricity
- 9.6%Utility gas
- 2.3%Wood
- 1.3%Bottled, tank, or LP gas
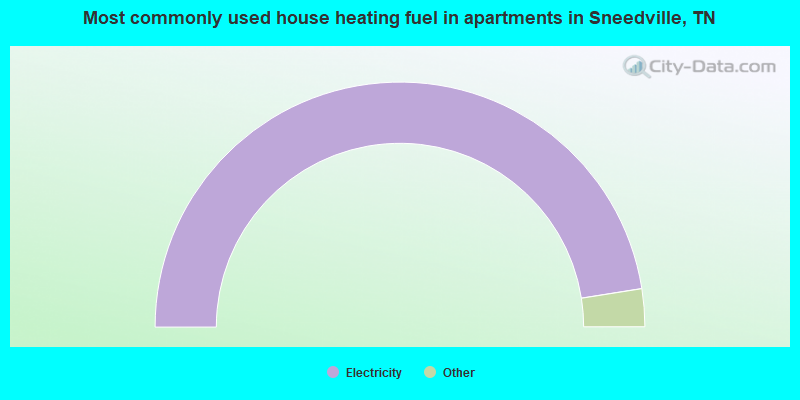
- 95.0%Electricity
- 1.6%No fuel used
- 1.2%Utility gas
- 1.2%Bottled, tank, or LP gas
- 0.9%Wood
Private vs. public school enrollment:
| Here: | 0.0% |
| Tennessee: | 15.0% |
| Here: | 5.7% |
| Tennessee: | 16.2% |
| Here: | 0.0% |
| Tennessee: | 23.5% |


