Jump to a detailed profile or search site with Google Custom Search

Solana Beach, CA (California) Houses and Residents

Estimated median house or condo value in 2022: $1,888,273 (it was $450,000 in 2000)
Solana Beach:

$1,888,273
California:

$715,900
Lower value quartile - upper value quartile: $1,267,673 - $2,331,847

Total population: 13,337 (Urban population: 12,887, Rural population: 0)

Houses: 6,498 (5,510 occupied: 3,698 owner occupied, 1,847 renter occupied)

% of renters here:

33%
State:

44%

Housing density: 1,842 houses/condos per square mile

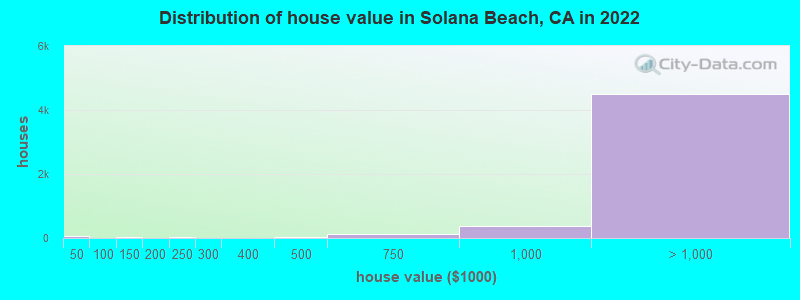
Median price asked for vacant for-sale houses and condos in 2022: $2,606,741.

Median contract rent in 2022: over $2,000 (lower quartile is over $2,000, upper quartile is over $2,000)


Median rent asked for vacant for-rent units in 2022: $4,127


Median gross rent in Solana Beach, CA in 2022: over $2,000

Housing units in Solana Beach with a mortgage: 2,278 (351 second mortgage, 0 home equity loan, 246 both second mortgage and home equity loan)
Houses without a mortgage: 53

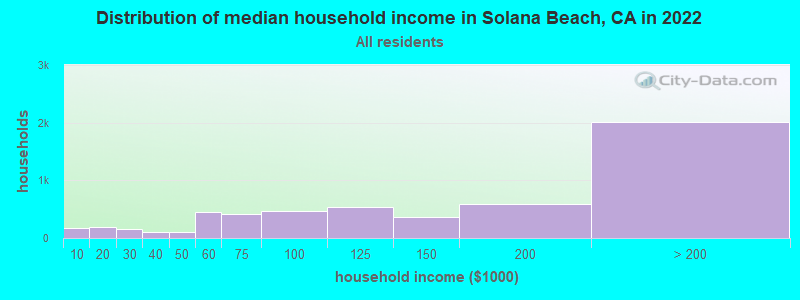
Median household income for houses/condos with a mortgage: $216,950

Median household income for apartments without a mortgage: $107,497

Median monthly housing costs: $3,071

Compare current foreclosures near Solana Beach, CA:

Check out more offers near Solana Beach, CA.
Powered by Foreclosure.com

Settings
X
Data:
Loading data...
Based on 2000-2022 data
Loading data...

123
Hide US histogram

Solana Beach, California Age and Sex of Residents
Median year house/condo built: 1976

Median year apartment built: 1975

Household type by relationship:

Households: 12,892
  • Male householders: 2,655 (476 living alone), Female householders: 2,758 (1,037 living alone)
  • 3,055 spouses (3,037 opposite-sex spouses), 300 unmarried partners, (292 opposite-sex unmarried partners), 3,346 children (3,113 natural, 90 adopted, 142 stepchildren), 75 grandchildren, 107 brothers or sisters, 89 parents, 0 foster children, 87 other relatives, 416 non-relatives

Size of family households: 2,059 2-persons, 775 3-persons, 559 4-persons, 134 5-persons, 141 6-persons, 28 7-or-more-persons.

Size of nonfamily households: 1,554 1-person, 300 2-persons, 11 3-persons, 14 4-persons.

1,671 married couples with children.
857 single-parent households (231 men, 626 women).

80.7% of residents of Solana Beach speak English at home.
11.4% of residents speak Spanish at home (77% speak English very well, 9% speak English well, 14% speak English not well).
5.1% of residents speak other Indo-European language at home (63% speak English very well, 25% speak English well, 11% speak English not well, 2% don't speak English at all).
2.7% of residents speak Asian or Pacific Island language at home (37% speak English very well, 18% speak English well, 45% speak English not well).
0.2% of residents speak other language at home (100% speak English very well).

Foreign born population: 1,585 (12.3%)
(57.6% of them are naturalized citizens)

Median number of rooms in houses and condos:
Here:

6.3
State:

6.0

Median number of rooms in apartments
Here:

4.1
State:

3.9

Owner-occupied Renter-occupied
Bedrooms in owner-occupied houses and condos in Solana Beach, California
  • Bedrooms in owner-occupied houses and condos in Solana Beach, California
  • 0no bedroom
  • 851 bedroom
  • 9632 bedrooms
  • 1,1403 bedrooms
  • 1,1824 bedrooms
  • 3285+ bedrooms
Bedrooms in renter-occupied apartments in Solana Beach, California
  • Bedrooms in renter-occupied apartments in Solana Beach, California
  • 117no bedroom
  • 3751 bedroom
  • 7912 bedrooms
  • 4923 bedrooms
  • 724 bedrooms
  • 05+ bedrooms
Owner-occupied Renter-occupied
Cars and other vehicles available in Solana Beach in owner-occupied houses/condos
  • Cars and other vehicles available in Solana Beach in owner-occupied houses/condos
  • 102no vehicle
  • 8271 vehicle
  • 1,9382 vehicles
  • 5443 vehicles
  • 2834 vehicles
  • 45+ vehicles
Cars and other vehicles available in Solana Beach in renter-occupied apartments
  • Cars and other vehicles available in Solana Beach in renter-occupied apartments
  • 146no vehicle
  • 7451 vehicle
  • 6232 vehicles
  • 2663 vehicles
  • 524 vehicles
  • 155+ vehicles
Owner-occupied Renter-occupied
Rooms in owner-occupied houses in Solana Beach, California
  • Rooms in owner-occupied houses in Solana Beach, California
  • 01 room
  • 112 rooms
  • 1683 rooms
  • 3964 rooms
  • 5975 rooms
  • 8356 rooms
  • 4567 rooms
  • 5808 rooms
  • 6559+ rooms
Rooms in renter-occupied apartments in Solana Beach, California
  • Rooms in renter-occupied apartments in Solana Beach, California
  • 1171 room
  • 1352 rooms
  • 3333 rooms
  • 5864 rooms
  • 2855 rooms
  • 2216 rooms
  • 907 rooms
  • 298 rooms
  • 539+ rooms
Year house built
Median 2022 house/condo value by year built
Median house/condo value by year householder moved into unit
Breakdown of mean house values by ages of householders
Owners and renters by unit type in Solana Beach, CA
  • Solana Beach, CA household income distribution

  • Distribution of median household income in Solana Beach, CA in 2022
  • 180Less than $10,000
  • 193$10,000 to $19,999
  • 148$20,000 to $29,999
  • 109$30,000 to $39,999
  • 103$40,000 to $49,999
  • 445$50,000 to $59,999
  • 411$60,000 to $74,999
  • 471$75,000 to $99,999
  • 533$100,000 to $124,999
  • 371$125,000 to $149,999
  • 594$150,000 to $199,999
  • 2,009$200,000 or more
  • Home value of owner - occupied houses in 2022 in Solana Beach, CA

  • Distribution of house value in Solana Beach, CA in 2022
  • 24Less than $10,000
  • 36$15,000 to $19,999
  • 24$100,000 to $124,999
  • 8$175,000 to $199,999
  • 37$200,000 to $249,999
  • 6$300,000 to $399,999
  • 24$400,000 to $499,999
  • 126$500,000 to $749,999
  • 362$750,000 to $999,999
  • 1,254$1,000,000 to $1,499,999
  • 1,117$1,500,000 to $1,999,999
  • 2,127$2,000,000 or more
  • Rent paid by renters in 2022 in Solana Beach, CA

  • Distribution of rent paid by renters in Solana Beach, CA in 2022
  • 25$450 to $499
  • 14$500 to $549
  • 9$1,000 to $1,249
  • 48$1,250 to $1,499
  • 104$1,500 to $1,999
  • 489$2,000 to $2,499
  • 387$2,500 to $2,999
  • 238$3,000 to $3,499
  • 585$3,500 or more
  • 19No cash rent
Time Leaving Home To Go To Work in 2022

Percentage of workers working in this county: 96.0%
Number of people working at home: 2,059 (34.4% of all workers)

Travel time (in minutes) to work in 2022

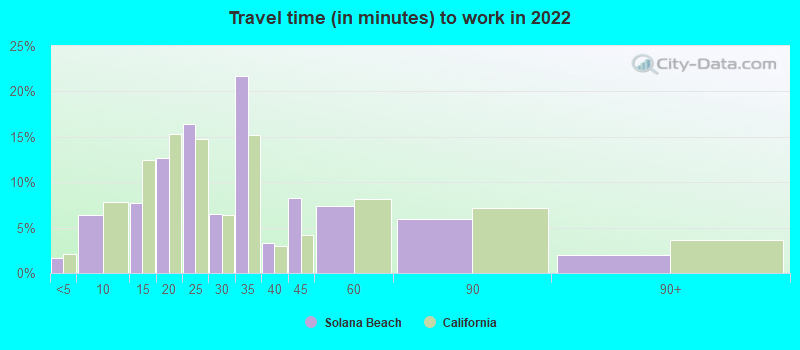
Travel time to work (commute)

  • Less than 5 minutes: 229
  • 5 to 9 minutes: 637
  • 10 to 14 minutes: 623
  • 15 to 19 minutes: 486
  • 20 to 24 minutes: 708
  • 25 to 29 minutes: 416
  • 30 to 34 minutes: 612
  • 35 to 39 minutes: 147
  • 40 to 44 minutes: 80
  • 45 to 59 minutes: 131
  • 60 to 89 minutes: 50
  • 90 or more minutes: 101
Means of transportation to work in 2022 - Solana Beach

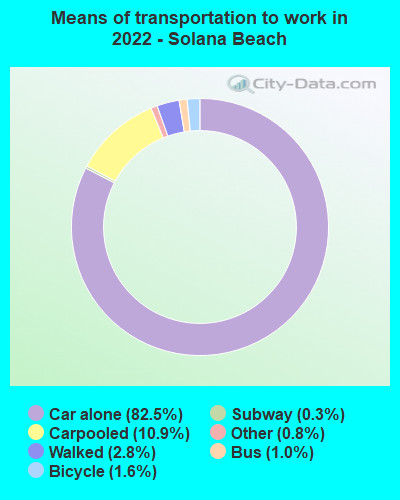
Means of transportation to work:

  • Drove a car alone: 5,489 (63.5%)
  • Carpooled: 759 (8.8%)
  • Bus: 60 (0.7%)
  • Long-distance train or commuter rail: 11 (0.1%)
  • Taxi: 58 (0.7%)
  • Bicycle: 114 (1.3%)
  • Walked: 209 (2.4%)
  • Worked at home: 2,059 (23.8%)
Class of Workers in 2022
  • Unemployment by race in 2022
  • Unemployment rate for White non-Hispanic residents
  • 1.3%Males
  • 5.5%Females
  • Unemployment rate for two or more race residents
  • 4.0%Males
  • 1.5%Females
  • Unemployment rate for Hispanic or Latino residents
  • 3.0%Males
  • 1.9%Females
Year of entry for the foreign-born population in Solana Beach, California
  • Year of entry for the foreign-born population in Solana Beach, California
  • 2722010 or later
  • 4182000 to 2009
  • 3301990 to 1999
  • 5491980 to 1989
  • 2591970 to 1979
  • 443Before 1970
Ancestries in Solana Beach, CA

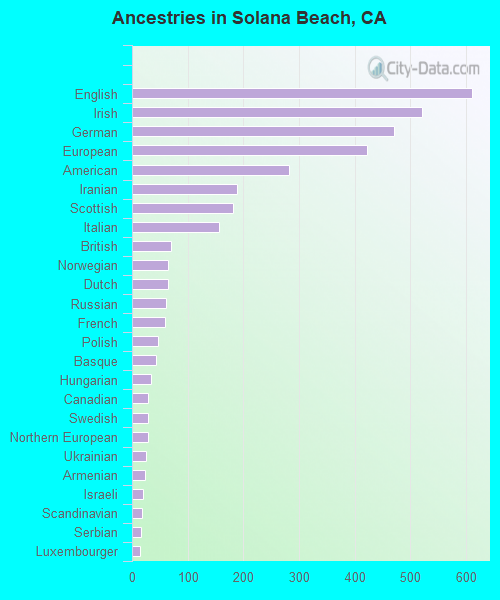
First ancestries reported:

  • English: 611 (10.7%)
  • Irish: 522 (9.1%)
  • German: 470 (8.2%)
  • European: 423 (7.4%)
  • American: 283 (5.0%)
  • Iranian: 189 (3.3%)
  • Scottish: 182 (3.2%)
  • Italian: 156 (2.7%)
  • British: 70 (1.2%)
  • Norwegian: 64 (1.1%)
  • Dutch: 64 (1.1%)
  • Russian: 61 (1.1%)
  • French: 59 (1.0%)
  • Polish: 47 (0.8%)
  • Basque: 44 (0.8%)
  • Hungarian: 35 (0.6%)
  • Canadian: 29 (0.5%)
  • Swedish: 28 (0.5%)
  • Northern European: 28 (0.5%)
  • Ukrainian: 25 (0.4%)
  • Armenian: 24 (0.4%)
  • Israeli: 19 (0.3%)
  • Scandinavian: 18 (0.3%)
  • Serbian: 17 (0.3%)
  • Luxembourger: 14 (0.2%)
  • Czech: 14 (0.2%)
  • Brazilian: 14 (0.2%)
  • Slovak: 14 (0.2%)
  • Egyptian: 14 (0.2%)
  • British West Indian: 13 (0.2%)
  • Danish: 12 (0.2%)
  • Ghanaian: 10 (0.2%)
  • Yugoslavian: 9 (0.2%)
  • Scotch-Irish: 8 (0.1%)
  • French Canadian: 7 (0.1%)
  • Greek: 7 (0.1%)
  • Welsh: 6 (0.1%)
  • Latvian: 5 (0.09%)
  • Lithuanian: 5 (0.09%)
  • Slavic: 5 (0.09%)
  • Australian: 3 (0.05%)

Most common places of birth for foreign-born residents (%):

Mexico
Solana Beach:

23.8% (378)
California:

37.2% (3,881,193)

Laos
Solana Beach:

10.1% (160)
California:

0.5% (48,911)

Iran
Solana Beach:

9.3% (148)
California:

2.0% (206,004)

Taiwan
Solana Beach:

6.8% (108)
California:

1.7% (176,274)

Canada
Solana Beach:

4.4% (69)
California:

1.2% (127,477)

United Kingdom, excluding England and Scotland
Solana Beach:

4.2% (67)
California:

0.6% (60,582)

Russia
Solana Beach:

3.7% (58)
California:

0.7% (71,932)

Indonesia
Solana Beach:

2.6% (42)
California:

0.4% (39,097)

Vietnam
Solana Beach:

2.5% (40)
California:

4.9% (512,335)

Israel
Solana Beach:

2.1% (34)
California:

0.3% (33,029)

Korea
Solana Beach:

2.1% (34)
California:

3.0% (315,248)

England
Solana Beach:

1.9% (30)
California:

0.6% (57,953)

Germany
Solana Beach:

1.6% (26)
California:

0.7% (73,304)

Place of birth for U.S.-born residents:

  • This state: 6,878
  • Other state: 4,323
  • Northeast: 1,263
  • Midwest: 1,542
  • South: 733
  • West: 770

90.7% of Solana Beach residents lived in the same house 1 years ago.
   Out of people who lived in different houses, 43.3% lived in this county.
   Out of people who lived in different counties, 50.7% lived in California.


Solana Beach:

90.7%
State average:

88.9%

Education attainment for males 25 years and older:

  • No schooling: 44
  • Nursery to 4th grade: 0
  • 5th and 6th grade: 7
  • 7th and 8th grade: 45
  • 9th grade: 0
  • 10th grade: 0
  • 11th grade: 12
  • 12th grade, no diploma: 28
  • High school graduate (or equivalency): 367
  • Less than 1 year of college: 85
  • Some college more than 1 year, no degree: 271
  • Associate degree: 283
  • Bachelor's degree: 1,811
  • Master's degree: 865
  • Professional school degree: 535
  • Doctorate degree: 314
Educational Attainment for Males

Education attainment for females 25 years and older:

  • No schooling: 26
  • Nursery to 4th grade: 0
  • 5th and 6th grade: 52
  • 7th and 8th grade: 0
  • 9th grade: 39
  • 10th grade: 0
  • 11th grade: 8
  • 12th grade, no diploma: 79
  • High school graduate (or equivalency): 457
  • Less than 1 year of college: 176
  • Some college more than 1 year, no degree: 558
  • Associate degree: 246
  • Bachelor's degree: 2,512
  • Master's degree: 695
  • Professional school degree: 290
  • Doctorate degree: 222
Educational Attainment for Females
Solana Beach marital status for males
Solana Beach marital status for females

Housing units in structures:

  • One, detached: 2,878
  • One, attached: 1,280
  • Two: 191
  • 3 or 4: 519
  • 5 to 9: 485
  • 10 to 19: 440
  • 20 to 49: 277
  • 50 or more: 414
  • Mobile homes: 10
Housing units lacking complete plumbing facilities in 2022: 0.1%

Housing units lacking complete kitchen facilities in 2022: 0.1%

House/condo owner moved in on average 15 years ago

Renter moved in on average 3 years ago

Year householders moved into residence in Solana Beach
Houses and condos Apartments
Most commonly used house heating fuel in houses and condos in Solana Beach, CA
  • 67.5%Utility gas
  • 24.7%Electricity
  • 3.0%No fuel used
  • 2.8%Solar energy
  • 1.1%Wood
  • 0.9%Bottled, tank, or LP gas
Most commonly used house heating fuel in apartments in Solana Beach, CA
  • 45.3%Utility gas
  • 38.2%Electricity
  • 10.3%No fuel used
  • 3.1%Wood
  • 1.4%Other fuel
  • 1.3%Solar energy
  • 0.4%Bottled, tank, or LP gas

Private vs. public school enrollment:

Students in private schools in grades 1 to 8 (elementary and middle school): 89
Here:

7.7%
California:

10.5%

Students in private schools in grades 9 to 12 (high school): 55
Here:

8.5%
California:

8.5%

Students in private undergraduate colleges: 110
Here:

40.4%
California:

15.9%
School Enrollment by Level of School for Male Students
School Enrollment by Level of School for Female Students
Age and Sex of Sensory-Disabled Noninstitutionalized Residents
Age and Sex of Physically-Disabled Noninstitutionalized Residents
Age and Sex of Mentally-Disabled Noninstitutionalized Residents
Age and Sex of Self-Care Disabled Noninstitutionalized Residents
Age and Sex of Go-Outside-Home Disabled Noninstitutionalized Residents
Age and Sex of Noninstitutionalized Residents with Employment Disability