Solis, TX (Texas) Houses and Residents
| Solis: | |
| Texas: |
Mean price in 2022:
Detached houses: $197,352
Here: $197,352 State: $369,058 Mobile homes: $50,778
Here: $50,778 State: $124,413
Total population: 512 (Urban population: 335, Rural population: 138 (all nonfarm))
Houses: 155 (145 occupied: 43 owner occupied, 104 renter occupied)
| % of renters here: | 71% |
| State: | 38% |
Housing density: 74 houses/condos per square mile
Median price asked for vacant for-sale houses and condos in 2022 in this county: $196,146.
Median contract rent in 2022: $864 (lower quartile is $683, upper quartile is $887)
Median gross rent in Solis, TX in 2022: $1,053
Housing units in Solis with a mortgage: 39 (0 second mortgage, 0 home equity loan, 0 both second mortgage and home equity loan)
Houses without a mortgage: 0
Compare current foreclosures near Solis, TX:
| Photo | Address | Area | Beds / Baths | Price | Details |
|---|---|---|---|---|---|

|
#1
Lion Lake Dr N
Weslaco, TX 78596
|
3,556 sq. feet
|
4 baths 5 beds |
$289,900
|
show details |

|
#2
Irene St
Weslaco, TX 78599
|
1,696 sq. feet
|
2 baths 3 beds |
show details | |

|
#3
W Adrian St
Harlingen, TX 78552
|
1,171 sq. feet
|
2 baths 3 beds |
show details | |

|
#4
Robusta Ct
Harlingen, TX 78552
|
3,341 sq. feet
|
4 baths 5 beds |
show details | |

|
#5
E Mccullar Ct
Harlingen, TX 78552
|
- sq. feet
|
3 baths 4 beds |
show details | |

|
#6
Scenic Ln
Harlingen, TX 78552
|
1,308 sq. feet
|
2 baths 3 beds |
show details | |

|
#7
N Sky Soldier Rd
Weslaco, TX 78596
|
- sq. feet
|
3 baths 3 beds |
show details | |

|
#8
Luis Dr
Mercedes, TX 78570
|
1,315 sq. feet
|
2 baths 3 beds |
show details | |

|
#9
Amber Dr
Weslaco, TX 78596
|
1,085 sq. feet
|
2 baths 3 beds |
show details | |

|
#10
Irene St
Weslaco, TX 78596
|
- sq. feet
|
2 baths 3 beds |
show details |
| Photo | Address | Area | Beds / Baths | Price | Details |
|---|---|---|---|---|---|

|
#11
Orange St
Mercedes, TX 78570
|
1,066 sq. feet
|
2 baths 3 beds |
show details | |

|
#12
Moon Lake Dr N
Weslaco, TX 78596
|
1,645 sq. feet
|
2 baths 3 beds |
show details | |

|
#13
Meredith St
La Feria, TX 78559
|
3,187 sq. feet
|
3 baths 5 beds |
show details | |

|
#14
Carlos St
San Benito, TX 78586
|
1,404 sq. feet
|
1 baths 3 beds |
show details | |

|
#15
Rio Rancho Rd
Harlingen, TX 78552
|
1,538 sq. feet
|
1 baths 2 beds |
show details | |

|
#16
W Washington St
Weslaco, TX 78599
|
2,252 sq. feet
|
2 baths 4 beds |
show details | |

|
#17
Bella Vista Ave
Weslaco, TX 78596
|
4,184 sq. feet
|
2 baths 3 beds |
show details | |

|
#18
Vista Verde Cir W
Harlingen, TX 78552
|
1,197 sq. feet
|
2 baths 3 beds |
show details | |

|
#19
Beckham Rd
Harlingen, TX 78552
|
2,661 sq. feet
|
2 baths 3 beds |
show details | |

|
#20
Lazy Lake Dr
Harlingen, TX 78550
|
3,254 sq. feet
|
2 baths 3 beds |
show details |
| Photo | Address | Area | Beds / Baths | Price | Details |
|---|---|---|---|---|---|

|
#21
W Ann Arbor St
Harlingen, TX 78552
|
1,532 sq. feet
|
- baths 3 beds |
show details | |

|
#22
Sun Crest Dr
Harlingen, TX 78552
|
1,835 sq. feet
|
2 baths 3 beds |
show details | |

|
#23
Lazy Palm Dr S
Harlingen, TX 78552
|
1,072 sq. feet
|
2 baths 3 beds |
show details | |

|
#24
E 9th St
Weslaco, TX 78596
|
1,441 sq. feet
|
2 baths 3 beds |
show details | |

|
#25
Pennsylvania Ave
San Benito, TX 78586
|
2,292 sq. feet
|
2 baths 4 beds |
show details | |

|
#26
Sun Dr
Harlingen, TX 78552
|
1,196 sq. feet
|
2 baths 3 beds |
show details | |

|
#27
Janneth St
Donna, TX 78537
|
2,656 sq. feet
|
3 baths 5 beds |
show details | |

|
#28
E Loma Dr
Mercedes, TX 78570
|
1,336 sq. feet
|
1 baths 3 beds |
show details | |

|
#29
Swallow Dr
Donna, TX 78537
|
1,347 sq. feet
|
2 baths 3 beds |
show details | |

|
#30
Rabb Rd
Santa Rosa, TX 78593
|
1,156 sq. feet
|
2 baths 3 beds |
show details |
| Photo | Address | Area | Beds / Baths | Price | Details |
|---|---|---|---|---|---|

|
#31
S Nebraska Ave
Weslaco, TX 78596
|
1,744 sq. feet
|
2 baths 3 beds |
show details | |

|
#32
Fm 508
Harlingen, TX 78550
|
1,844 sq. feet
|
2 baths 4 beds |
show details | |

|
#33
S Oklahoma Ave
Weslaco, TX 78596
|
1,176 sq. feet
|
1 baths 2 beds |
show details | |

|
#34
S Reynolds
Rio Hondo, TX 78583
|
1,188 sq. feet
|
1 baths 3 beds |
show details | |

|
#35
N White Ranch Rd
La Feria, TX 78559
|
1,798 sq. feet
|
2 baths 3 beds |
show details | |

|
#36
E Madison Ave
Harlingen, TX 78550
|
1,656 sq. feet
|
2 baths 3 beds |
show details | |

|
#37
Bougainvillea Ave
Weslaco, TX 78596
|
1,473 sq. feet
|
2 baths 3 beds |
show details | |

|
#38
Villarreal St
Edinburg, TX 78542
|
1,368 sq. feet
|
2 baths 3 beds |
show details | |

|
#39
N 27th St
Harlingen, TX 78550
|
1,203 sq. feet
|
2 baths 3 beds |
show details | |

|
#40
Lilia Dr
Weslaco, TX 78599
|
1,952 sq. feet
|
2 baths 4 beds |
show details |
| Photo | Address | Area | Beds / Baths | Price | Details |
|---|---|---|---|---|---|

|
#41
E Pierce Ave
Harlingen, TX 78550
|
900 sq. feet
|
1 baths 3 beds |
show details | |

|
#42
N Border Ave
Weslaco, TX 78596
|
1,645 sq. feet
|
2 baths 4 beds |
show details | |

|
#43
Mi Tierra Dr
Weslaco, TX 78599
|
1,517 sq. feet
|
2 baths 3 beds |
show details | |

|
#44
Palo Blanco St
San Benito, TX 78586
|
1,195 sq. feet
|
2 baths 3 beds |
show details | |

|
#45
S Nebraska Ave
Weslaco, TX 78596
|
1,200 sq. feet
|
1 baths 3 beds |
show details | |

|
#46
N A St
Harlingen, TX 78550
|
1,160 sq. feet
|
1 baths - beds |
show details | |

|
#47
N 12th St
Donna, TX 78537
|
1,100 sq. feet
|
- baths 2 beds |
show details | |

|
#48
Mi Cielo
Weslaco, TX 78599
|
1,369 sq. feet
|
3 baths - beds |
show details | |

|
#49
Jasper Dr
Weslaco, TX 78596
|
1,746 sq. feet
|
- baths 3 beds |
show details | |

|
Check over 1 million property listings on Foreclosure.com!
|
browse all offers | |||

Latest news about housing in Solis, TX collected exclusively by city-data.com from local newspapers, TV, and radio stations

 | Nobody here cares about deputy Sandeep Dhaliwal? (14 replies) |
| 2019 Dallas mayors race (28 replies) |
| A HARD worker looking to better himself..... (28 replies) |
| Pre-purchase Home Inspection for older home.. reasonable $$? (8 replies) |
| Grocery Stores: What's up (166 replies) |
| Questions about moving to El Paso and the schools (97 replies) |

Median year apartment built: 2004
Household type by relationship:
Households: 693- Male householders: 45 (17 living alone), Female householders: 97 (0 living alone)
54 spouses (54 opposite-sex spouses), 0 unmarried partners, (0 opposite-sex unmarried partners), 393 children (322 natural, 55 adopted, 15 stepchildren), 44 grandchildren, 0 brothers or sisters, 0 parents, 0 foster children, 0 other relatives, 58 non-relatives
Size of family households: 25 2-persons, 12 3-persons, 65 5-persons, 12 6-persons, 2 7-or-more-persons.
Size of nonfamily households: 17 1-person.
62 married couples with children.
247 single-parent households (0 men, 247 women).
28.8% of residents of Solis speak English at home.
69.8% of residents speak Spanish at home (79% speak English very well, 8% speak English well, 6% speak English not well, 6% don't speak English at all).
Foreign born population: 101 (14.6%)
(1.0% of them are naturalized citizens)
| Here: | 5.5 |
| State: | 6.3 |
| Here: | 6.4 |
| State: | 4.0 |

- Bedrooms in owner-occupied houses and condos in Solis, Texas
- 0no bedroom
- 01 bedroom
- 362 bedrooms
- 43 bedrooms
- 04 bedrooms
- 35+ bedrooms

- Bedrooms in renter-occupied apartments in Solis, Texas
- 0no bedroom
- 01 bedroom
- 492 bedrooms
- 03 bedrooms
- 554 bedrooms
- 05+ bedrooms

- Cars and other vehicles available in Solis in owner-occupied houses/condos
- 0no vehicle
- 71 vehicle
- 352 vehicles
- 13 vehicles
- 04 vehicles
- 05+ vehicles

- Cars and other vehicles available in Solis in renter-occupied apartments
- 21no vehicle
- 181 vehicle
- 662 vehicles
- 03 vehicles
- 04 vehicles
- 05+ vehicles

- Rooms in owner-occupied houses in Solis, Texas
- 01 room
- 02 rooms
- 03 rooms
- 194 rooms
- 15 rooms
- 216 rooms
- 37 rooms
- 08 rooms
- 09+ rooms

- Rooms in renter-occupied apartments in Solis, Texas
- 01 room
- 02 rooms
- 183 rooms
- 104 rooms
- 215 rooms
- 06 rooms
- 557 rooms
- 08 rooms
- 09+ rooms


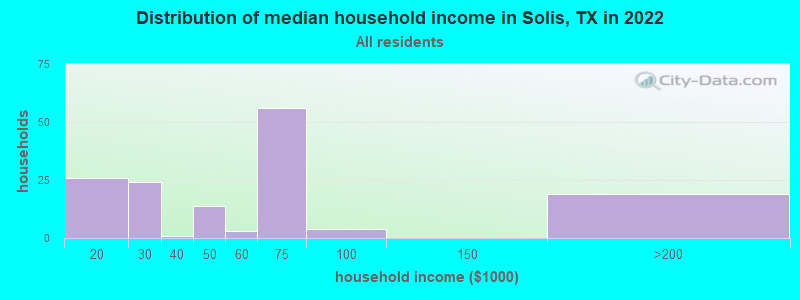
Solis, TX household income distribution

- 26$10,000 to $19,999
- 24$20,000 to $29,999
- 1$30,000 to $39,999
- 14$40,000 to $49,999
- 3$50,000 to $59,999
- 56$60,000 to $74,999
- 4$75,000 to $99,999
- 19$150,000 to $199,999
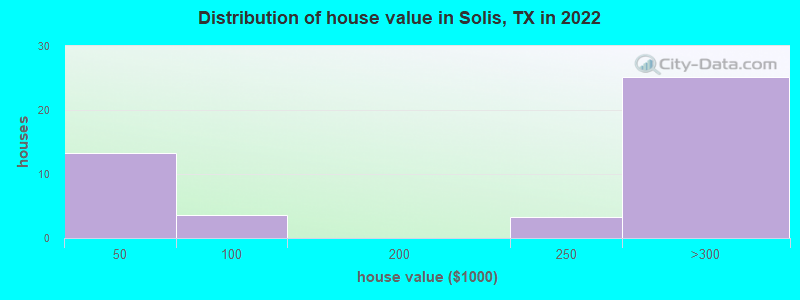
Home value of owner - occupied houses in 2022 in Solis, TX
-
- 3$10,000 to $14,999
- 10$25,000 to $29,999
- 0$60,000 to $69,999
- 2$70,000 to $79,999
- 3$200,000 to $249,999
- 25$250,000 to $299,999
Rent paid by renters in 2022 in Solis, TX
-
- 7$450 to $499
- 18$600 to $649
- 19$650 to $699
- 63$800 to $899

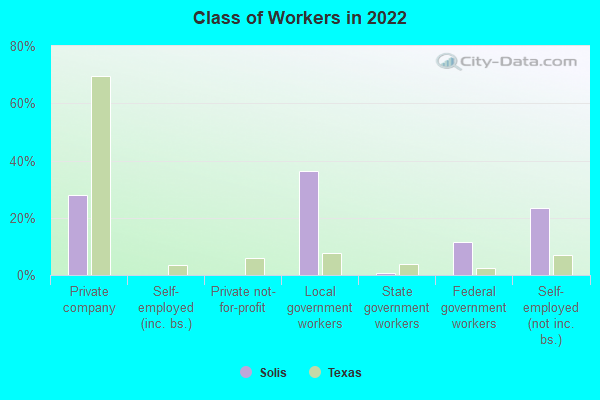
Percentage of workers working in this county: 39.7%
Number of people working at home: 3 (2.0% of all workers)
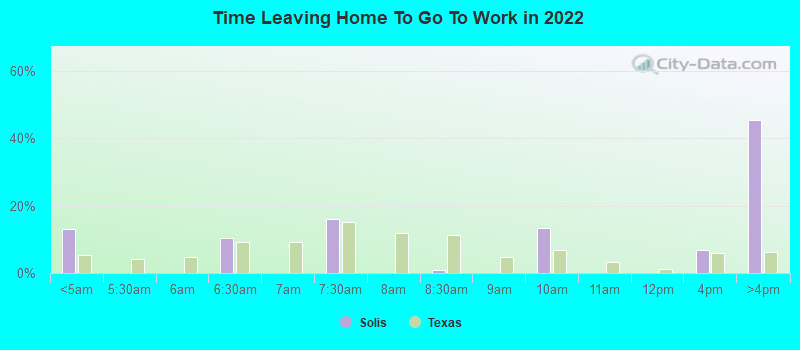
Travel time to work (commute)
- Less than 5 minutes: 0
- 5 to 9 minutes: 12
- 10 to 14 minutes: 15
- 15 to 19 minutes: 62
- 20 to 24 minutes: 1
- 25 to 29 minutes: 0
- 30 to 34 minutes: 15
- 35 to 39 minutes: 11
- 40 to 44 minutes: 0
- 45 to 59 minutes: 20
- 60 to 89 minutes: 0
- 90 or more minutes: 0
Means of transportation to work:
- Drove a car alone: 100 (73.5%)
- Carpooled: 8 (5.9%)
- Bus or trolley bus: 11 (8.1%)
- Walked: 9 (6.6%)
- Worked at home: 8 (5.9%)
- Unemployment by race in 2022
- Unemployment rate for Hispanic or Latino residents
- 52.4%Males

- Year of entry for the foreign-born population in Solis, Texas
- 02010 or later
- 702000 to 2009
- 191990 to 1999
- 91980 to 1989
- 01970 to 1979
- 0Before 1970
Most common places of birth for foreign-born residents (%):
| Solis: | 95.3% (101) |
| Texas: | 48.4% (2,411,723) |
Place of birth for U.S.-born residents:
- This state: 453
- Other state: 130
- Northeast: 2
- Midwest: 45
- South: 58
- West: 24
98.6% of Solis residents lived in the same house 1 years ago.
| Solis: | 98.6% |
| State average: | 85.7% |
Education attainment for males 25 years and older:
- No schooling: 24
- Nursery to 4th grade: 0
- 5th and 6th grade: 14
- 7th and 8th grade: 0
- 9th grade: 9
- 10th grade: 9
- 11th grade: 0
- 12th grade, no diploma: 0
- High school graduate (or equivalency): 3
- Less than 1 year of college: 0
- Some college more than 1 year, no degree: 58
- Associate degree: 21
- Bachelor's degree: 18
- Master's degree: 0
- Professional school degree: 0
- Doctorate degree: 0

Education attainment for females 25 years and older:
- No schooling: 0
- Nursery to 4th grade: 22
- 5th and 6th grade: 0
- 7th and 8th grade: 0
- 9th grade: 5
- 10th grade: 0
- 11th grade: 0
- 12th grade, no diploma: 12
- High school graduate (or equivalency): 57
- Less than 1 year of college: 0
- Some college more than 1 year, no degree: 15
- Associate degree: 0
- Bachelor's degree: 0
- Master's degree: 16
- Professional school degree: 0
- Doctorate degree: 0


Housing units in structures:
- One, detached: 103
- One, attached: 17
- Mobile homes: 34
House/condo owner moved in on average 6 years ago
Renter moved in on average 0 years ago

Private vs. public school enrollment:
| Here: | 0.0% |
| Texas: | 8.8% |
| Here: | 0.0% |
| Texas: | 8.0% |
| Here: | 0.0% |
| Texas: | 16.2% |


